Methods and systems for patient specific identification and assessmentof ocular disease risk factors and treatment efficacy
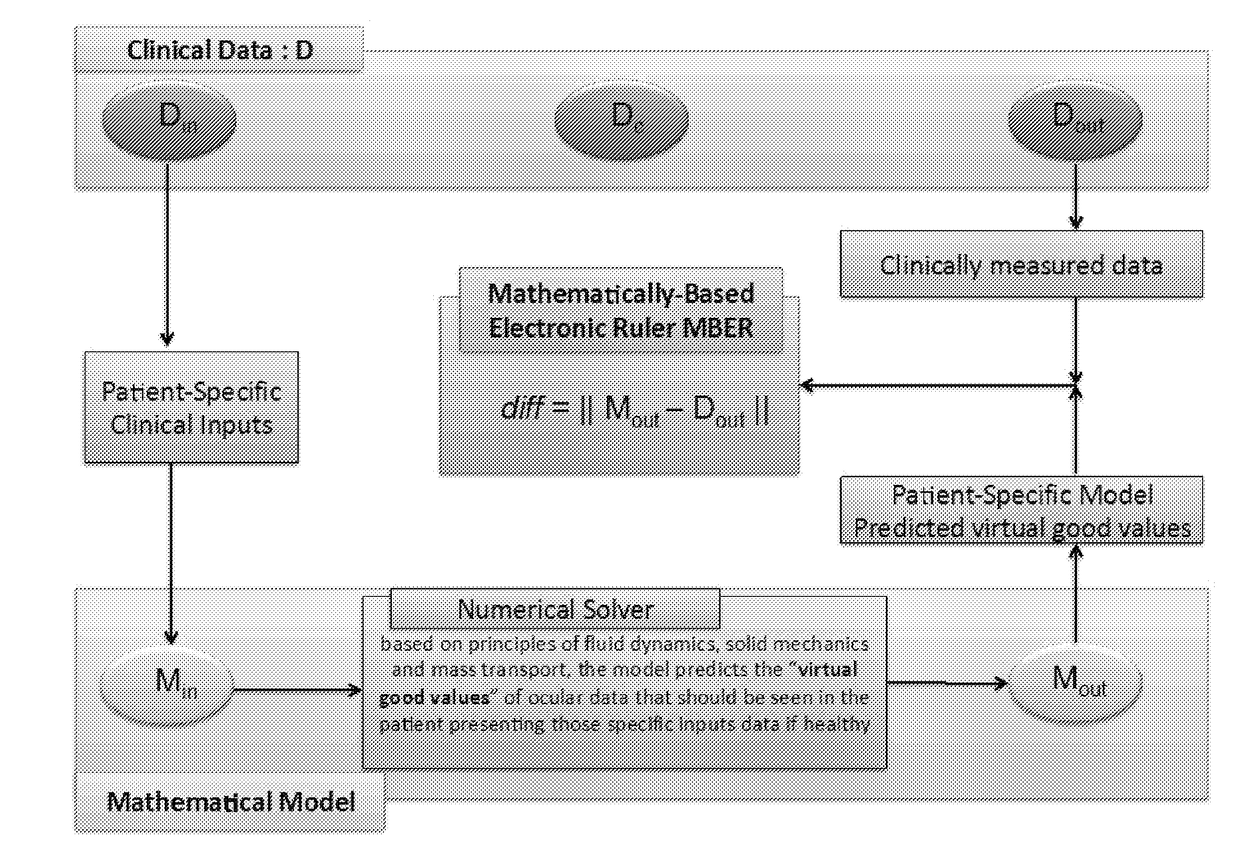
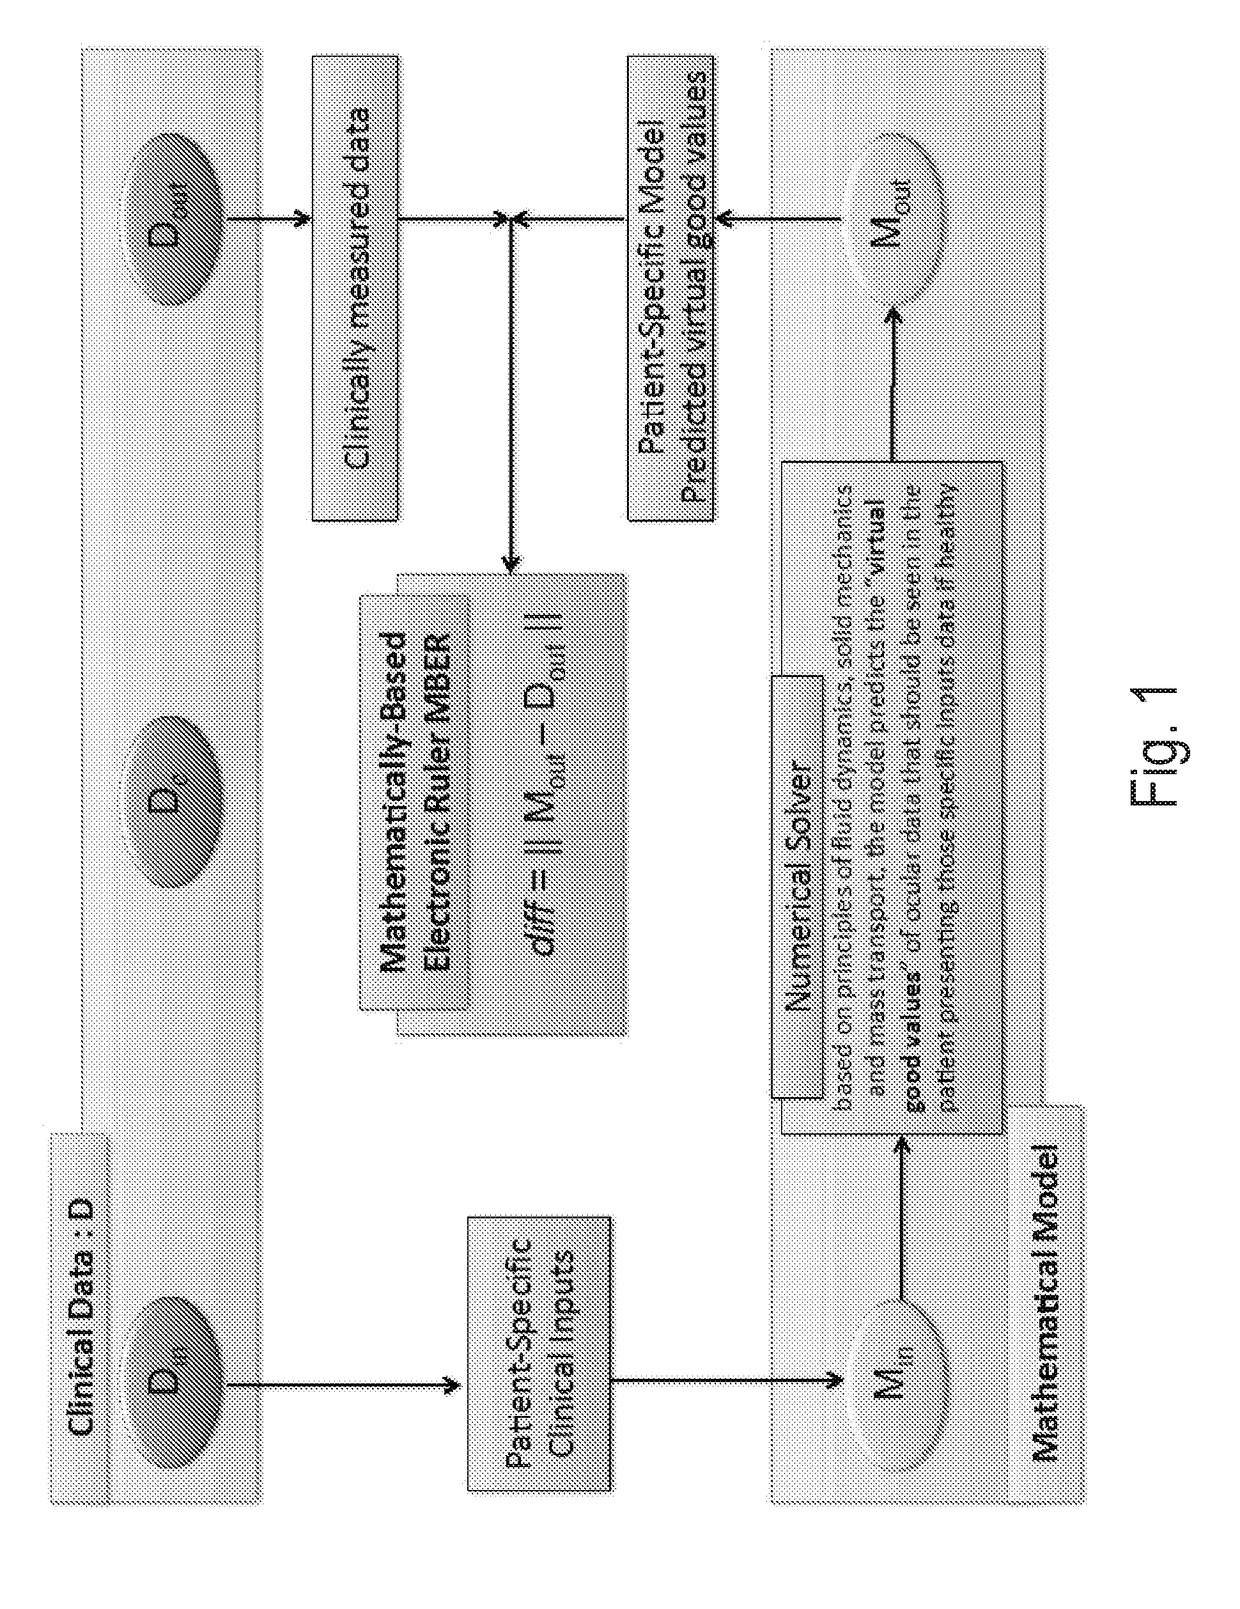
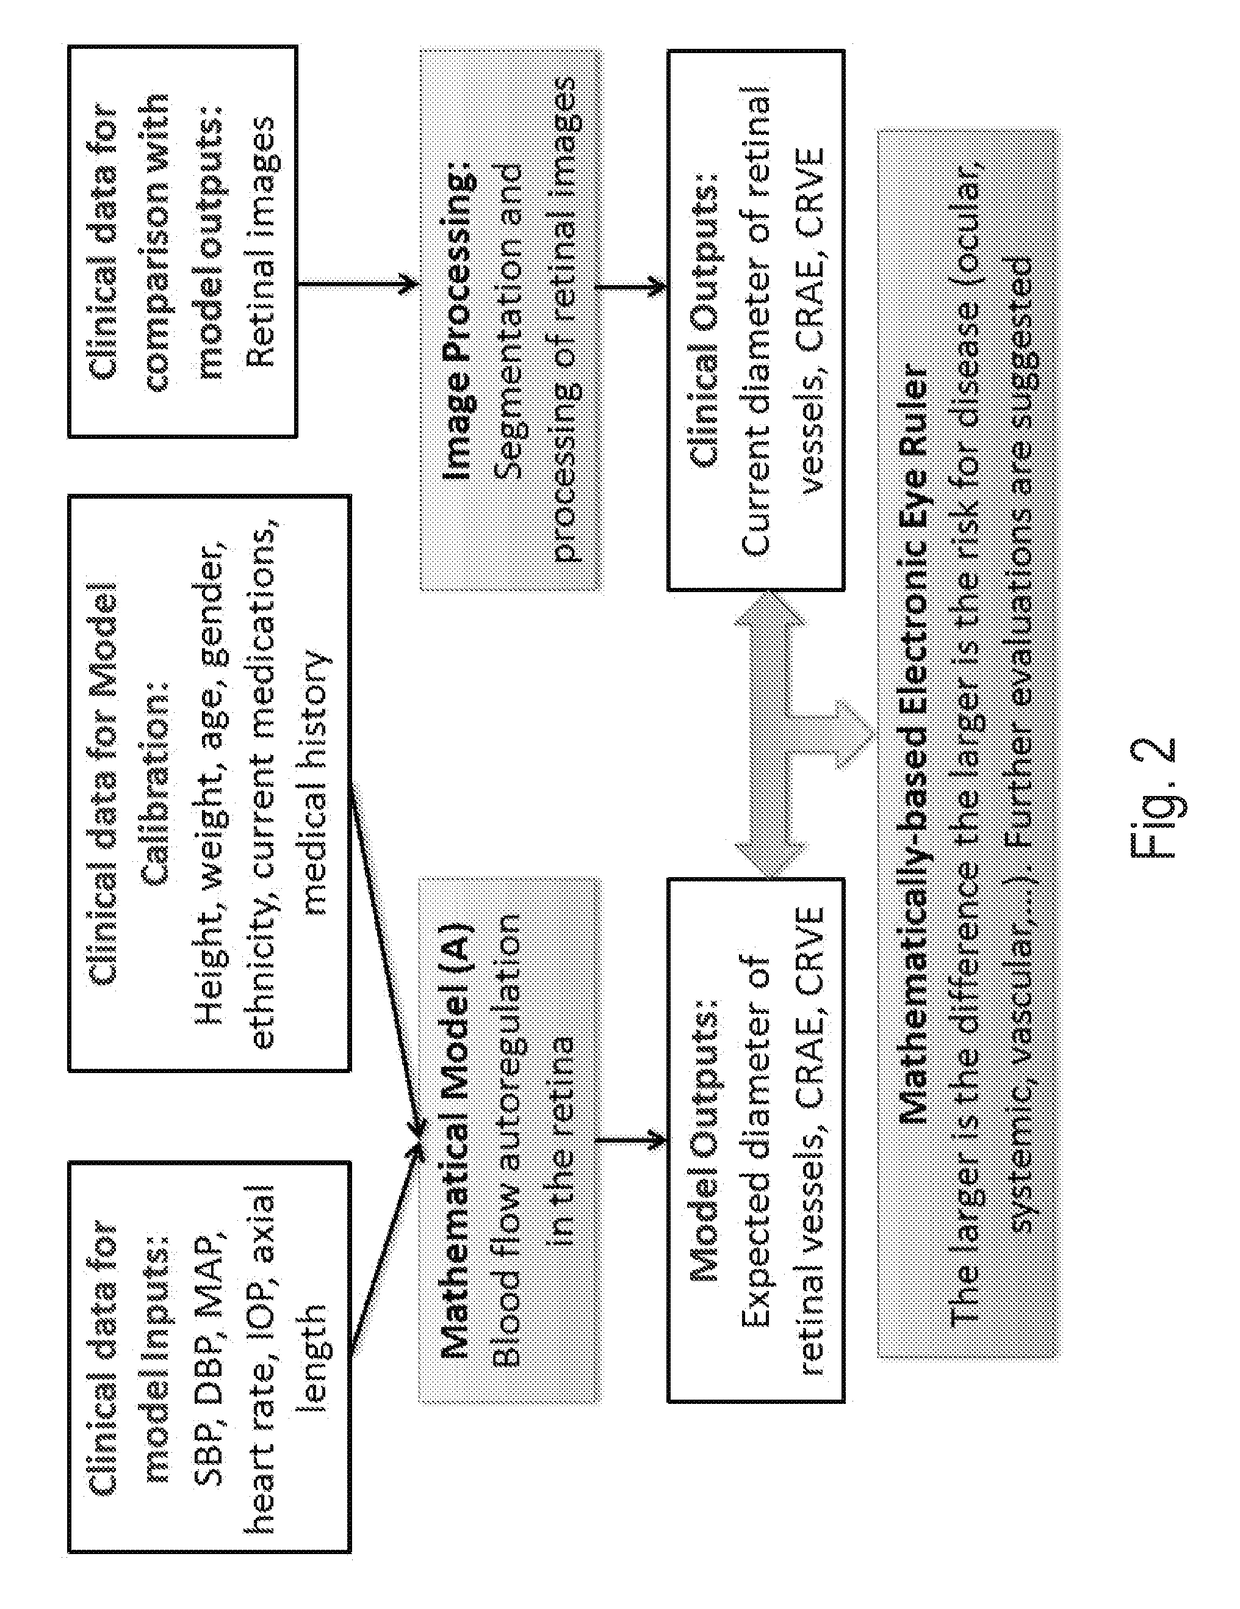
a risk factor and patient technology, applied in the field of patient specific identification and assessment of ocular disease risk factors, can solve the problems of complex risk factor interactions that are not fully understood or well described, elevated risk, and contradiction in understanding disease risk, and achieve the effect of greater ocular vasculature abnormalities
- Summary
- Abstract
- Description
- Claims
- Application Information
AI Technical Summary
Benefits of technology
Problems solved by technology
Method used
Image
Examples
example 1
linicians in Devising Therapeutic Approaches
[0078]Measurements from 89 healthy individuals and 74 glaucoma patients of age 40 years or older were collected. Individuals with systemic diseases or ocular diseases other than open angle glaucoma were excluded from the study. However, patients receiving antihypertensive medication for elevated systemic blood pressure and patients with mild cataracts were not excluded. Glaucoma was defined based on the characteristic optic disc damage and the corresponding visual field defects. Of all of the glaucoma patients considered in this study, 45 were diagnosed with primary open-angle glaucoma (POAG) and 29 were diagnosed with normal-tension glaucoma (NTG). A diagnosis of POAG was defined by an untreated IOP>21 mmHg. Patients with IOP measurements consistently 21 mmHg were classified as having NTG. All glaucoma patients underwent automated perimetry. A patient was defined as having “mild glaucoma” if the visual field mean defect (MD) was ≤5 dB and...
example 2
ng and Assessing Abnormalities
[0083]The patient group from Example 1 was used in this Example.
[0084]Patient-specific simulations were run by setting MAP and IOP equal to their measured values in a specific patient, and by setting the values of the other inputs listed in Table 1 at baseline. In this case, we consider the baseline values of the metabolic consumption were set at M0=1 cm3 O2*100 cm−3 min−1 and arterial oxygen saturation=0.9742. It should be appreciated that baseline values can be further tuned using larger datasets and / or accounting for the patient's age, gender, disease status, and other factors discussed elsewhere herein. The model was used to compute the arteriovenous difference in oxygen saturation to be expected in each patient. Then, the model predicted values of arteriovenous difference in oxygen saturation are compared with the values measured for each patient via retinal oximetry. Results are reported in the Table below for a dataset including 15 glaucoma patie...
PUM
 Abstract
Description
Claims
Application Information
 - Generate Ideas
- Intellectual Property
- Life Sciences
- Materials
- Tech Scout
- Unparalleled Data Quality
- Higher Quality Content
- 60% Fewer Hallucinations
Browse by: Latest US Patents, China's latest patents, Technical Efficacy Thesaurus, Application Domain, Technology Topic, Popular Technical Reports.
© 2025 PatSnap. All rights reserved.Legal|Privacy policy|Modern Slavery Act Transparency Statement|Sitemap|About US| Contact US: help@patsnap.com


