Cyber Defense Systems And Methods
a cyber defense and method technology, applied in the field of perimeter security, can solve the problems of infecting other systems via propagation that does not match normal business communications, and cannot change its behavior and still achieve the purpose,
- Summary
- Abstract
- Description
- Claims
- Application Information
AI Technical Summary
Benefits of technology
Problems solved by technology
Method used
Image
Examples
example enterprise
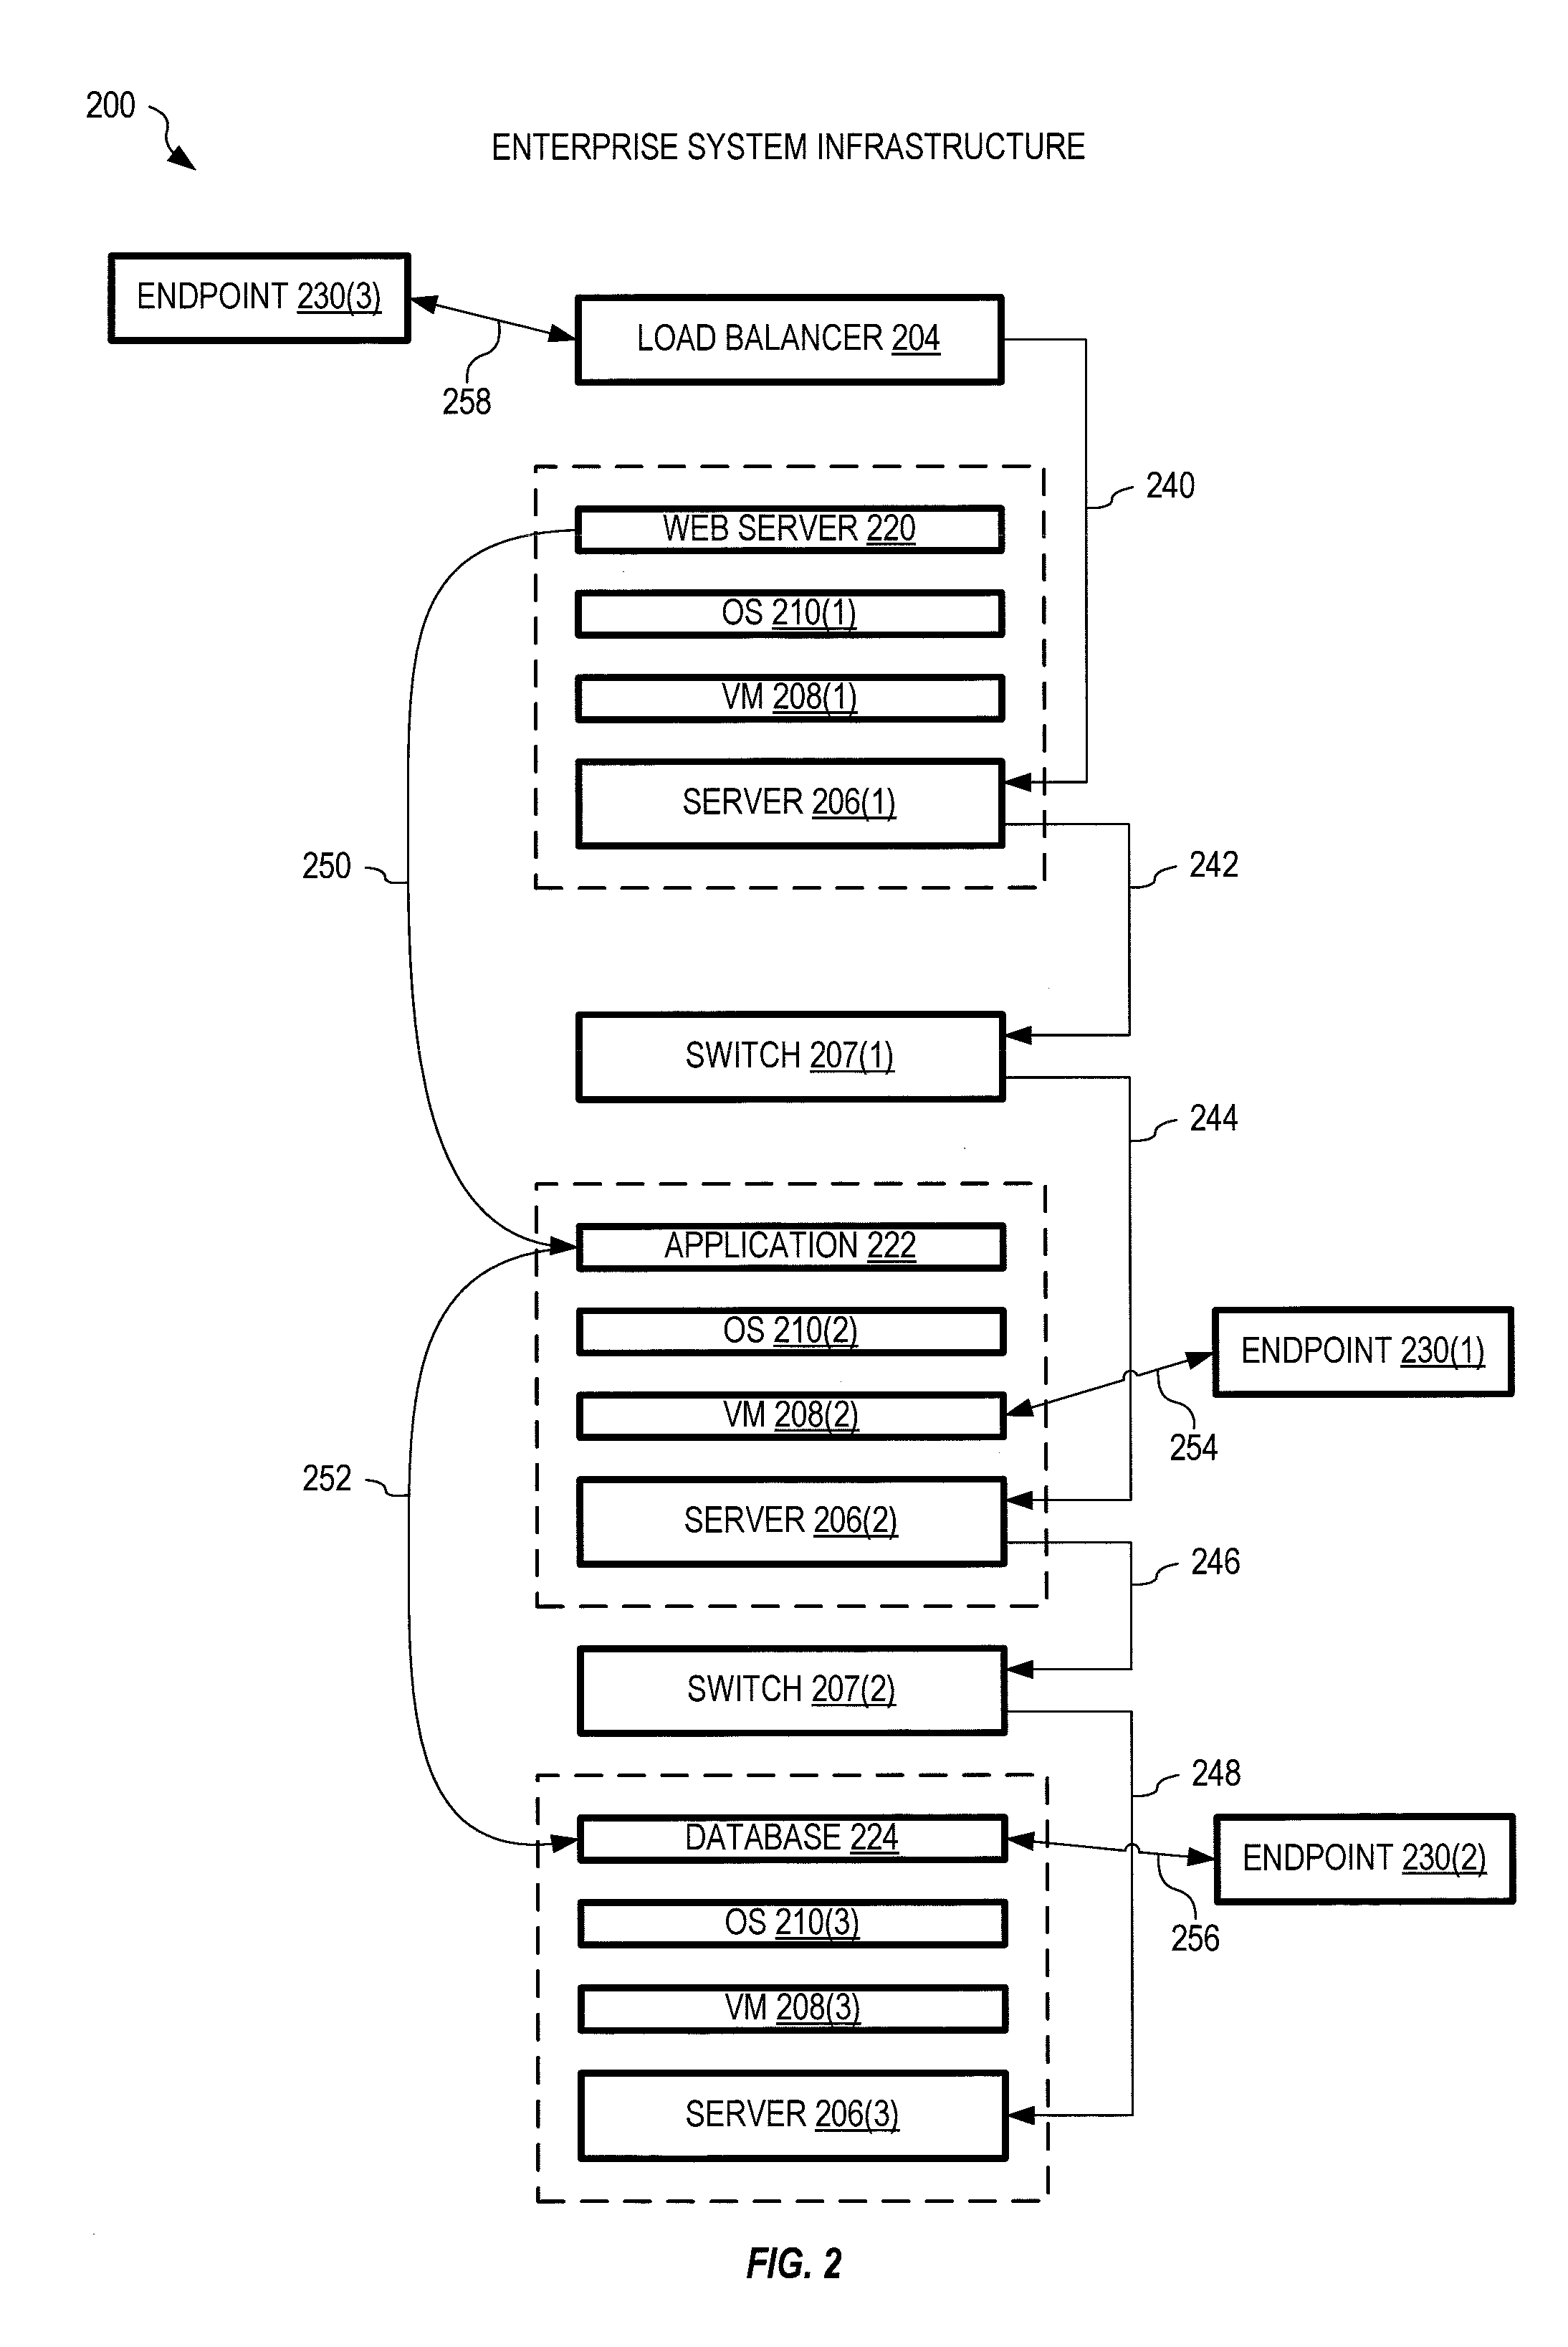
[0055]FIG. 2 shows one exemplary enterprise system 200 including a load balancer 204, three servers 206(1)-(3), and two switches 207(1)-(2). Enterprise system 200 may represent enterprise system 150 of FIG. 1.
[0056]Server 206(1) runs a VM 208(1), on which an operating system (OS) 210(1) runs to support a web server 220. Thus collectively, server 206(1), VM 208(1), OS 210(1) and web server 220 provide a web service within enterprise system 200. Server 206(2) runs a VM 208(2), on which an operating system (OS) 210(2) runs to support an application 222. Thus collectively, server 206(2), VM 208(2), OS 210(2) and application 222 provide an application service within enterprise system 200. Server 206(3) runs a VM 208(3), on which an operating system (OS) 210(3) runs to support a database 224. Thus collectively, server 206(3), VM 208(3), OS 210(3) and database 224 provide a database service within enterprise system 200.
[0057]A connection 240 provides communication between load balanc...
example 1
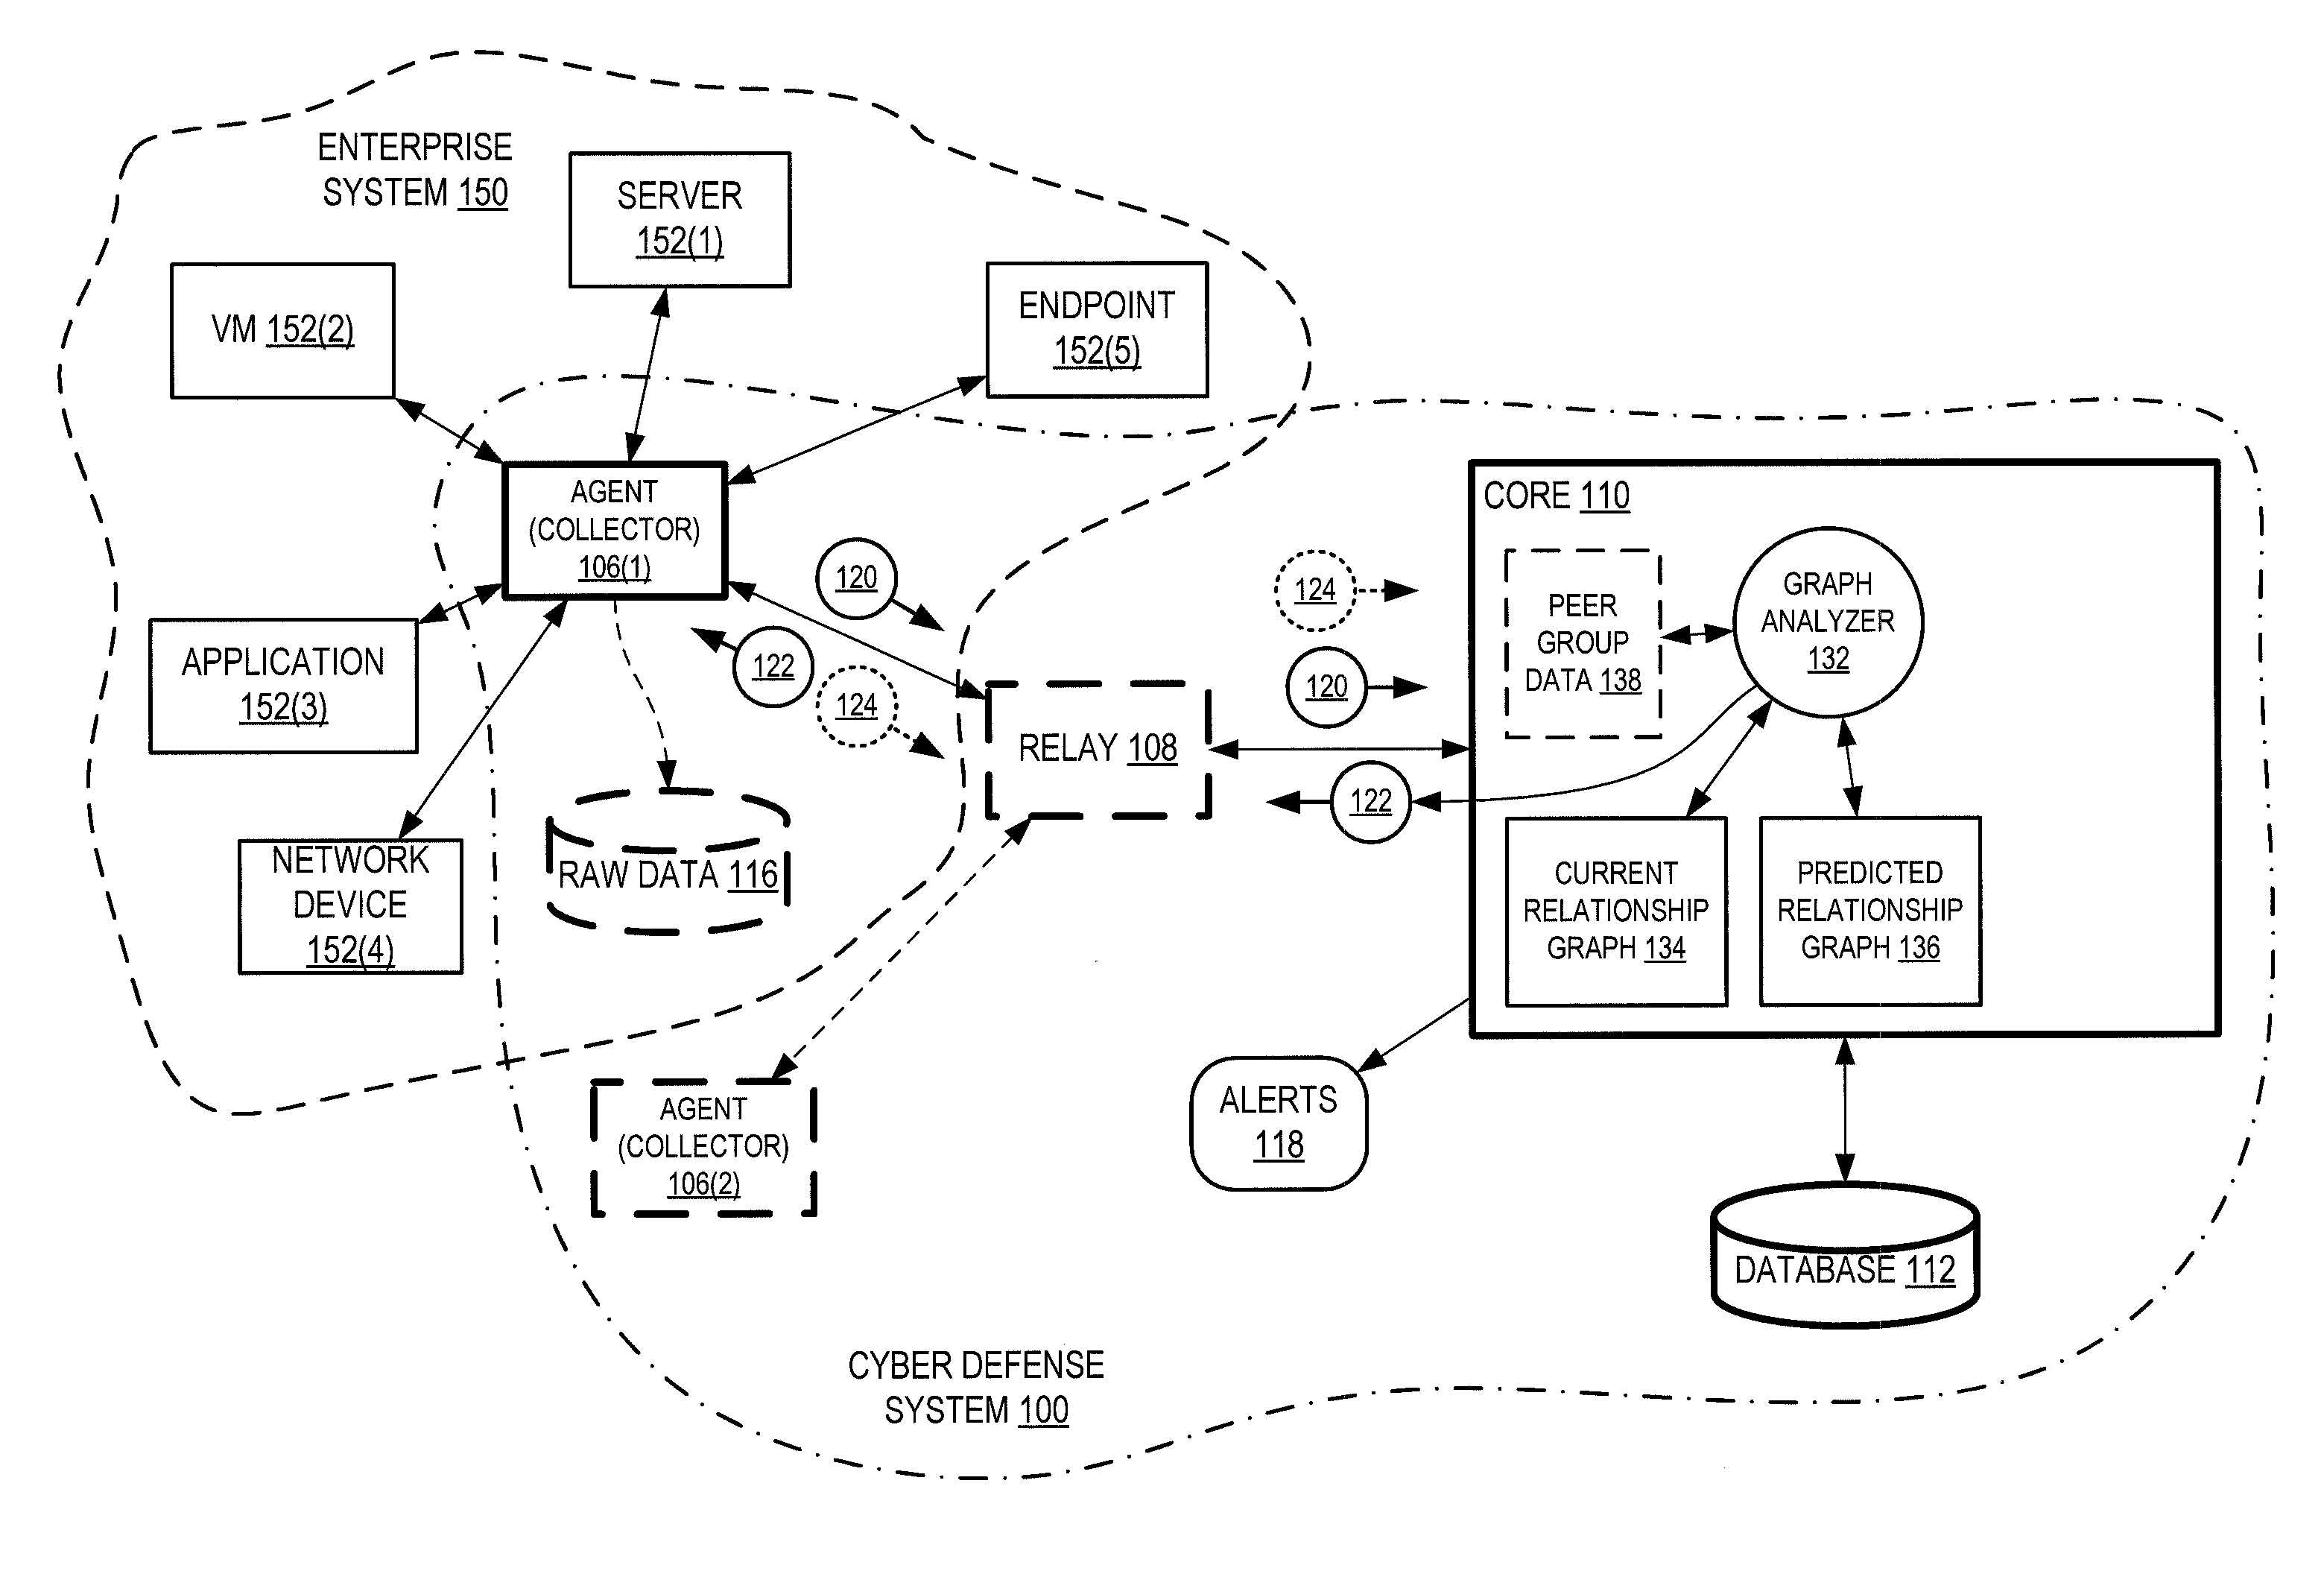
[0100]An administrator endpoint 230(2) connects to database 224 each evening for a given duration of time, and transfers a given amount of data to the database, and extracts a given amount of data from the database. This happens over several weeks. System 100 learns this behavior (i.e., records the effects of this behavior within relationship graph 134 over time) and generates a predictive relationship graph 136 predicting that this behavior will occur again the following evening, and will happen within the same rough parameters (e.g., as defined within normative baseline 454) as has happened before. Core 110 generates prediction 122 (e.g., “expect endpoint 230(2) to connect to database 224 within this time window for this duration and to pass this much data in, and this much data out”) and sends it to the appropriate agent 106. Agent 106 generates potential alert 124 when determining that prediction 122 (a) doesn't happen at all, (b) happens from a different endpoint, (c) more than...
example 2
[0104]Relationship graph 134 forms a historical record of all relationships established by a given endpoint, and includes components that the endpoint connects to (e.g., the CRM system, the email system, the HR system) and also defines (a) an order in which the endpoint connected to each of these components, (b) a duration of each connection, and (c) how much data typically traverses in each direction of the connection. From this historical data, and optionally from historical data of statistically similar endpoints, defense system 100 determines normative baseline 454. Any change in the historical pattern of connection and behavior is identified as a potential anomaly. Defense system 100 predicts, for example, that each endpoint will access previously accessed components within enterprise system 150 in a similar order, for a similar duration, and transfer similar amounts of data as previously recorded.
[0105]Certain behavior may be reduced in importance (e.g., the recorded behavior ...
PUM
 Abstract
Description
Claims
Application Information
 - Generate Ideas
- Intellectual Property
- Life Sciences
- Materials
- Tech Scout
- Unparalleled Data Quality
- Higher Quality Content
- 60% Fewer Hallucinations
Browse by: Latest US Patents, China's latest patents, Technical Efficacy Thesaurus, Application Domain, Technology Topic, Popular Technical Reports.
© 2025 PatSnap. All rights reserved.Legal|Privacy policy|Modern Slavery Act Transparency Statement|Sitemap|About US| Contact US: help@patsnap.com


