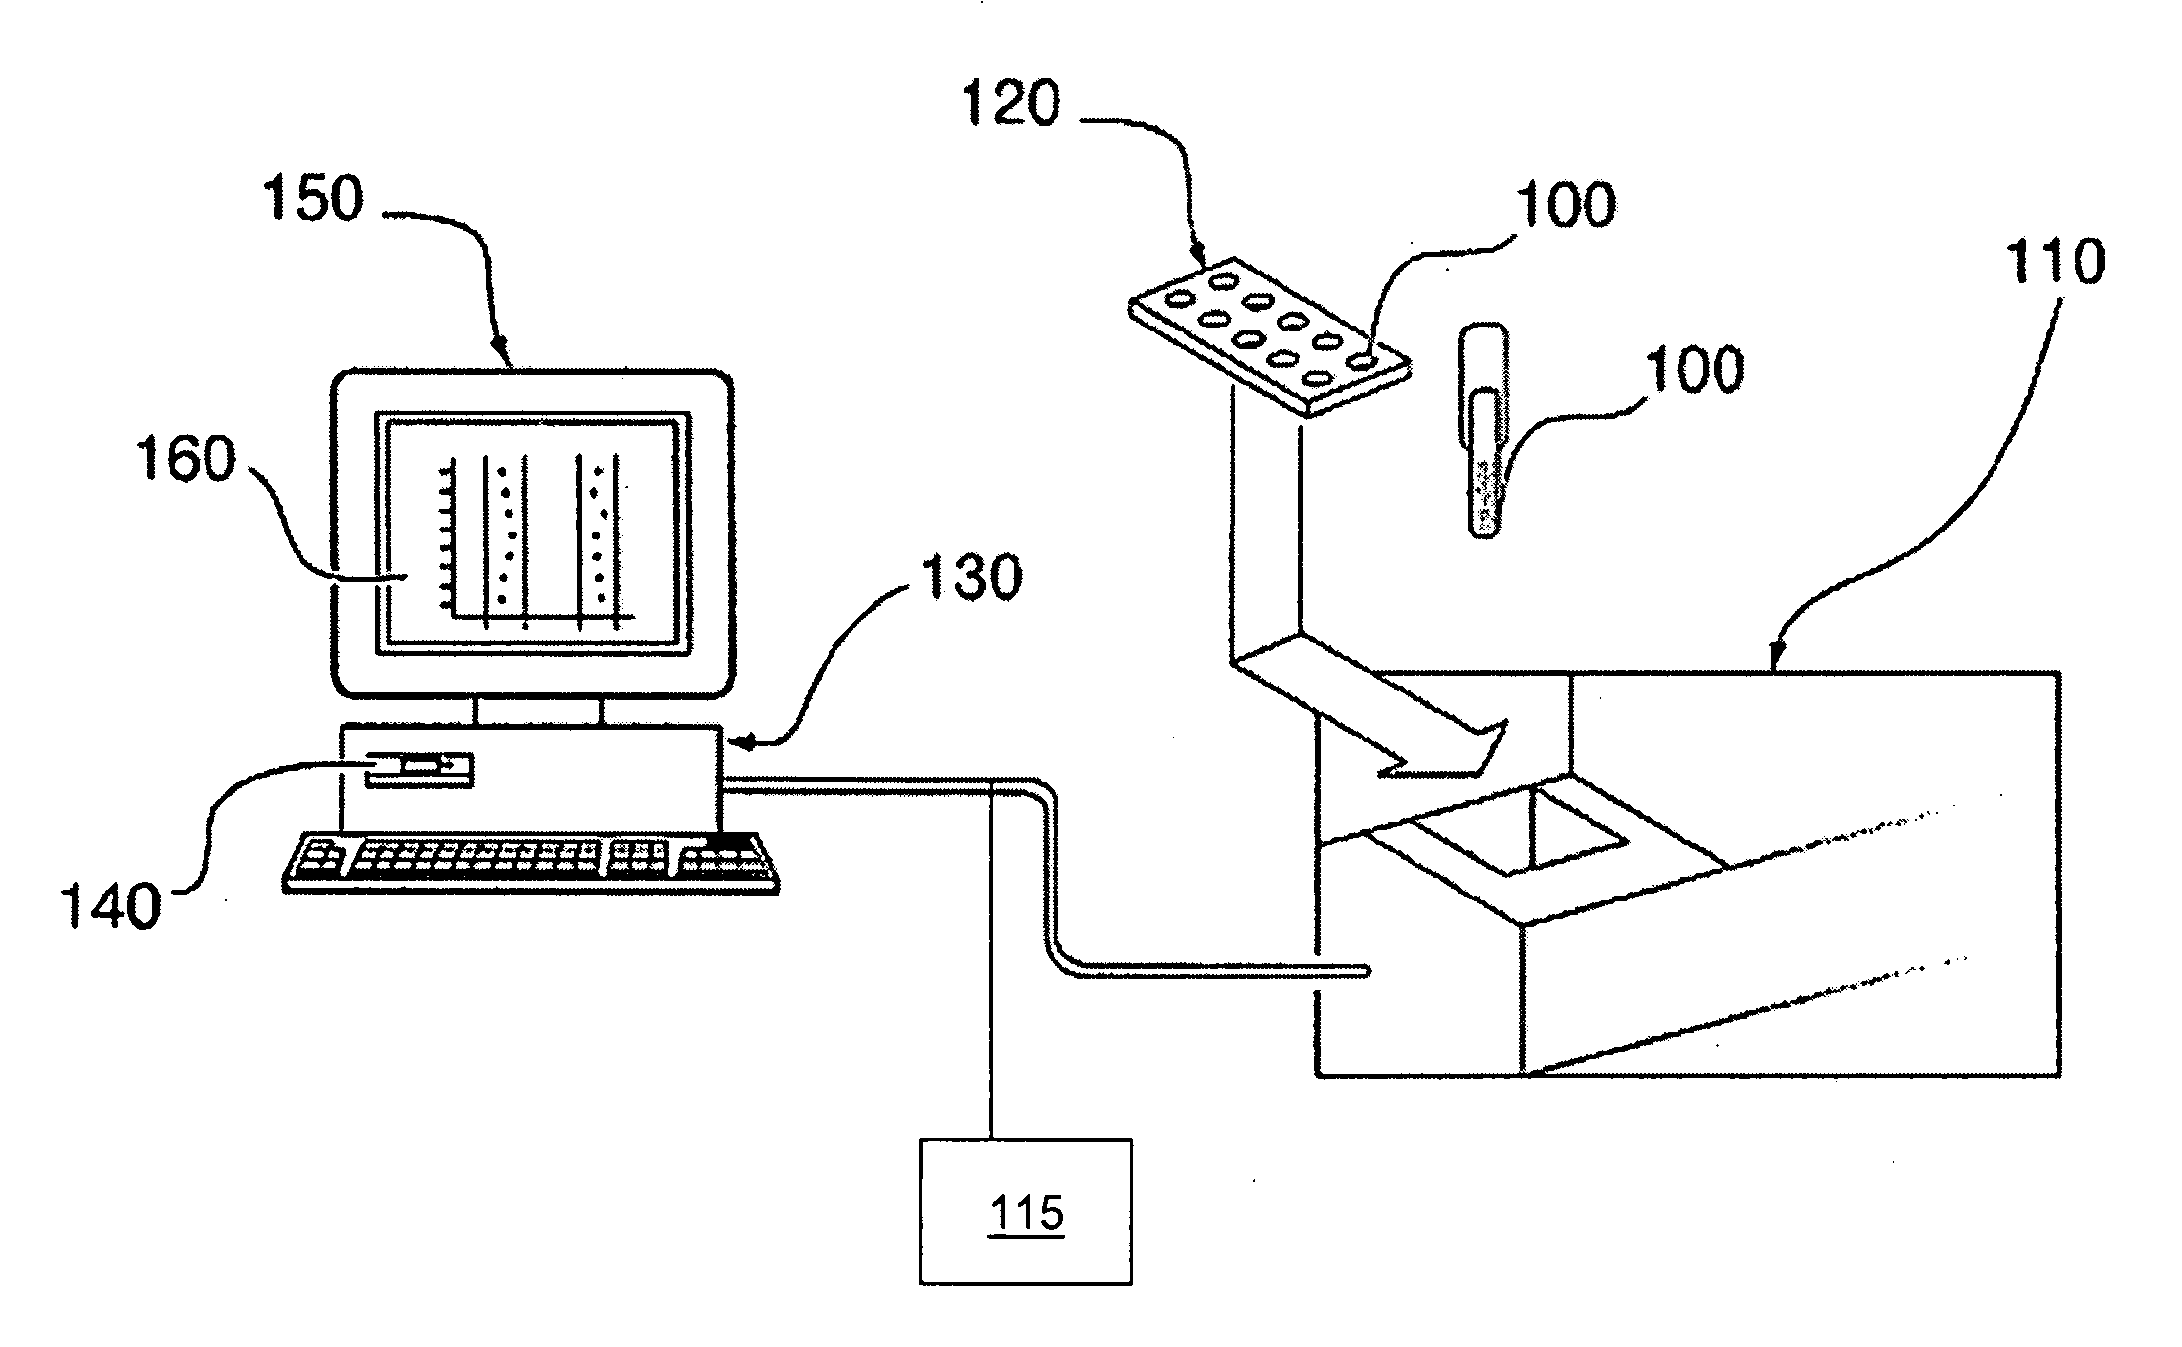
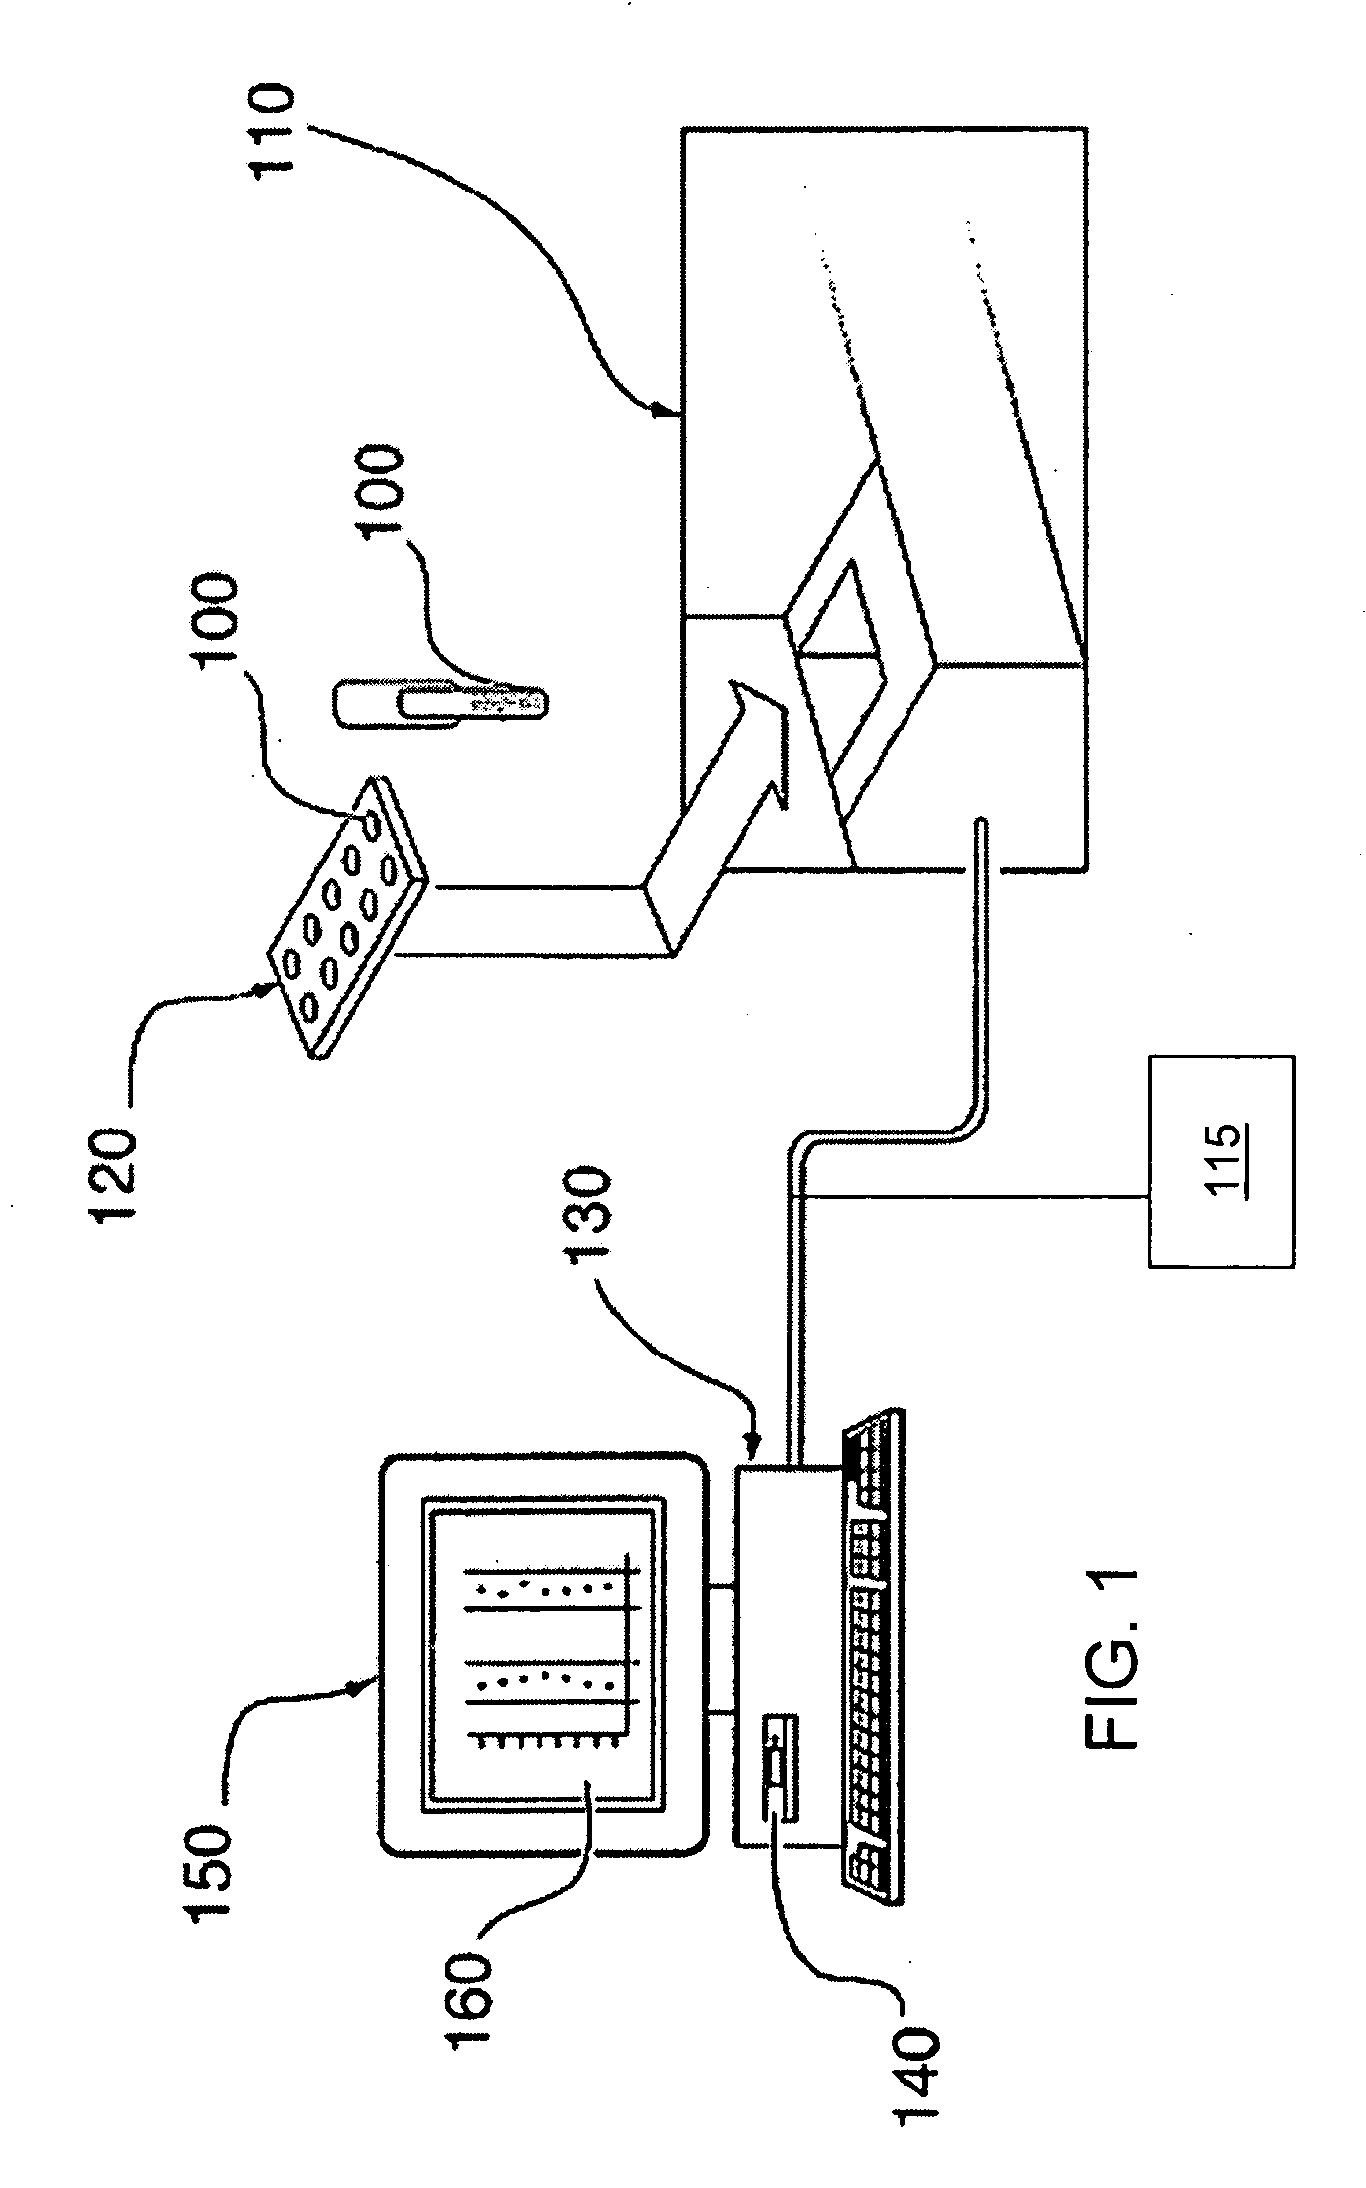
[0012]Another aspect of the present invention provides a
system for analyzing
metabolomics data, comprising a
database in communication with each of a first
data source and a second
data source, wherein the database is configured to automatically receive a three-dimensional
data set of
metabolomics data corresponding to each of a plurality of samples, from each of the first and second data sources. A processor device is in communication with said database, wherein said processor device is configured, for the
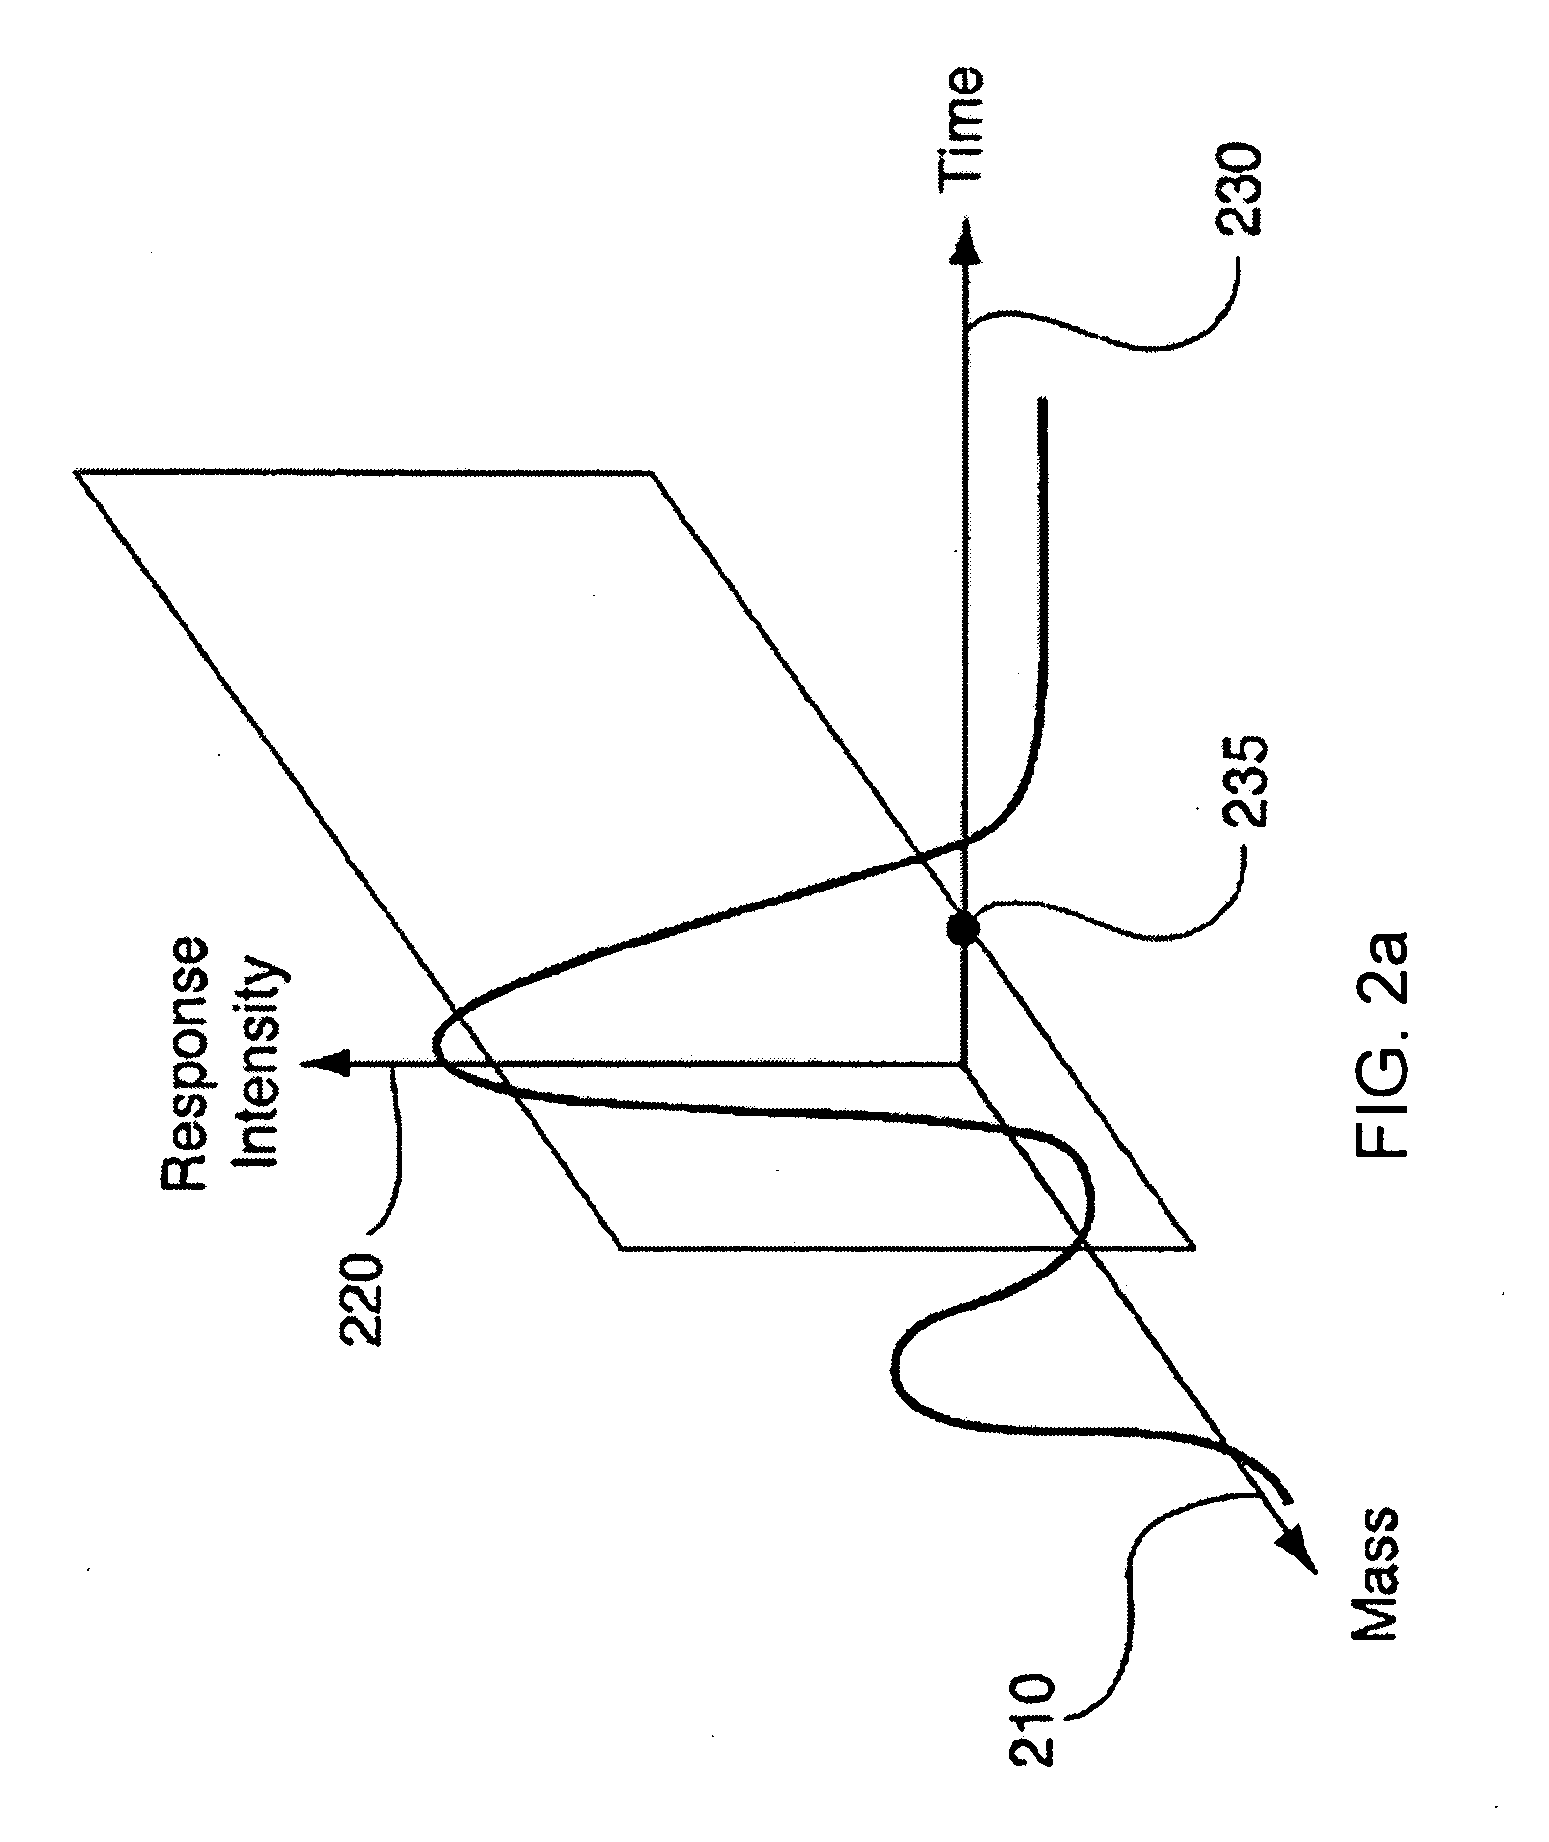
metabolomics data from each of the first and second data sources, to convert the three-dimensional data set into at least one corresponding two-dimensional data set for each of the plurality of samples; plot the at least one two-dimensional data set for each of the plurality of samples; compare the at least one plotted two-dimensional data set for each of the plurality of samples to a plurality of characteristic plots corresponding to a plurality of selected metabolites so as to screen the plurality of samples by associating at least one of the plurality of selected metabolites with the at least one plotted two-dimensional data set for each of the plurality of samples; and compare, for the screened plurality of samples determined to have the at least one of the plurality of selected metabolites associated therewith, the at least one plotted two-dimensional data set for each of the screened plurality of samples, across the screened plurality of samples, so as to determine a trend of the associated at least one of the plurality of selected metabolites, across the screened plurality of samples. A
user interface is in communication with said database and said processor device, wherein the
user interface is configured to display a visual indication of the comparison of the at least one plotted two-dimensional data set for each of the screened plurality of samples, across a plurality of the screened plurality of samples, to visually indicate the screened plurality of samples determined to have the at least one of the plurality of selected metabolites associated therewith, and the trend corresponding thereto, across the plurality of the screened plurality of samples, for the
metabolomics data from each of the first and second data sources. The displayed visual indication is further configured to facilitate determination of an identity confidence measure associated with the at least one of the plurality of selected metabolites from a comparison of the first and second data sources with respect to the at least one of the plurality of selected metabolites determined to be included in the
metabolomics data and the trend across the screened plurality of samples associated therewith.
[0015]Thus the systems, methods, and
computer program products for analyzing metabolomics data across a plurality of samples, as disclosed in conjunction with the embodiments of the present invention, provide many advantages that may include, but are not limited to: automatically compiling and indexing complex three-dimensional spectrometry data sets for a plurality of samples so as to be capable of generating a sample
population data set; converting the complex
three dimensional data sets into two dimensional data sets and corresponding data plots that are more easily comparable to a
library of data plots corresponding to a plurality of selected metabolites of interest; providing a graphical representation of the spectrometry data analyses used to identify metabolites of interest; and providing a graphical representation of the compiled data across a population of samples such that the user of the
system of the present invention may subjectively evaluate the spectrometry data and evaluate only those samples exhibiting a variance that may be indicative of the absence and / or presence of a selected
metabolite, without the need for opening a plurality of
individual data files corresponding to each particular sample under examination. In doing so, embodiments of the present invention, for example, advantageously allow a user to subjectively evaluate the spectrometry data across a plurality of samples to identify selected metabolites, allow the user to verify or otherwise determine the confidence in the identification of the selected metabolites, allow the user to examine the data associated with the identification of the selected metabolites, and allow the user to determine additional information related to the identified selected metabolites.
[0016]These advantages and others that will be evident to those skilled in the art are provided in the
system, method, and
computer program product embodiments of the present invention. Importantly, all of these advantages allow the system to display metabolomic analysis results to a user in a compact format that spans a “
fourth dimension” across the population of samples. Because, analytical results data spanning across the sample population is made more readily evident to the user in a graphical format, along with the identification of metabolites of interest as potential
disease targets, the user is better able to determine the presence and / or absence of selected metabolites and / or chemical components within or otherwise associated with the samples. Furthermore, because additional sample
population data is provided, the embodiments of the present invention are less likely to discount potentially valuable spectrometry results that may be discounted when viewed independently from the sample population.


