
Methods and systems and analysis of CGH data

a technology of cgh data and methods, applied in the field of methods and systems and analysis of cgh data, can solve the problems of perinatal genetic problems frequently, loss or gain of chromosome segments,

Inactive Publication Date: 2008-05-01
AGILENT TECH INC
View PDF56 Cites 11 Cited by
  • Summary
  • Abstract
  • Description
  • Claims
  • Application Information

AI Technical Summary

Benefits of technology

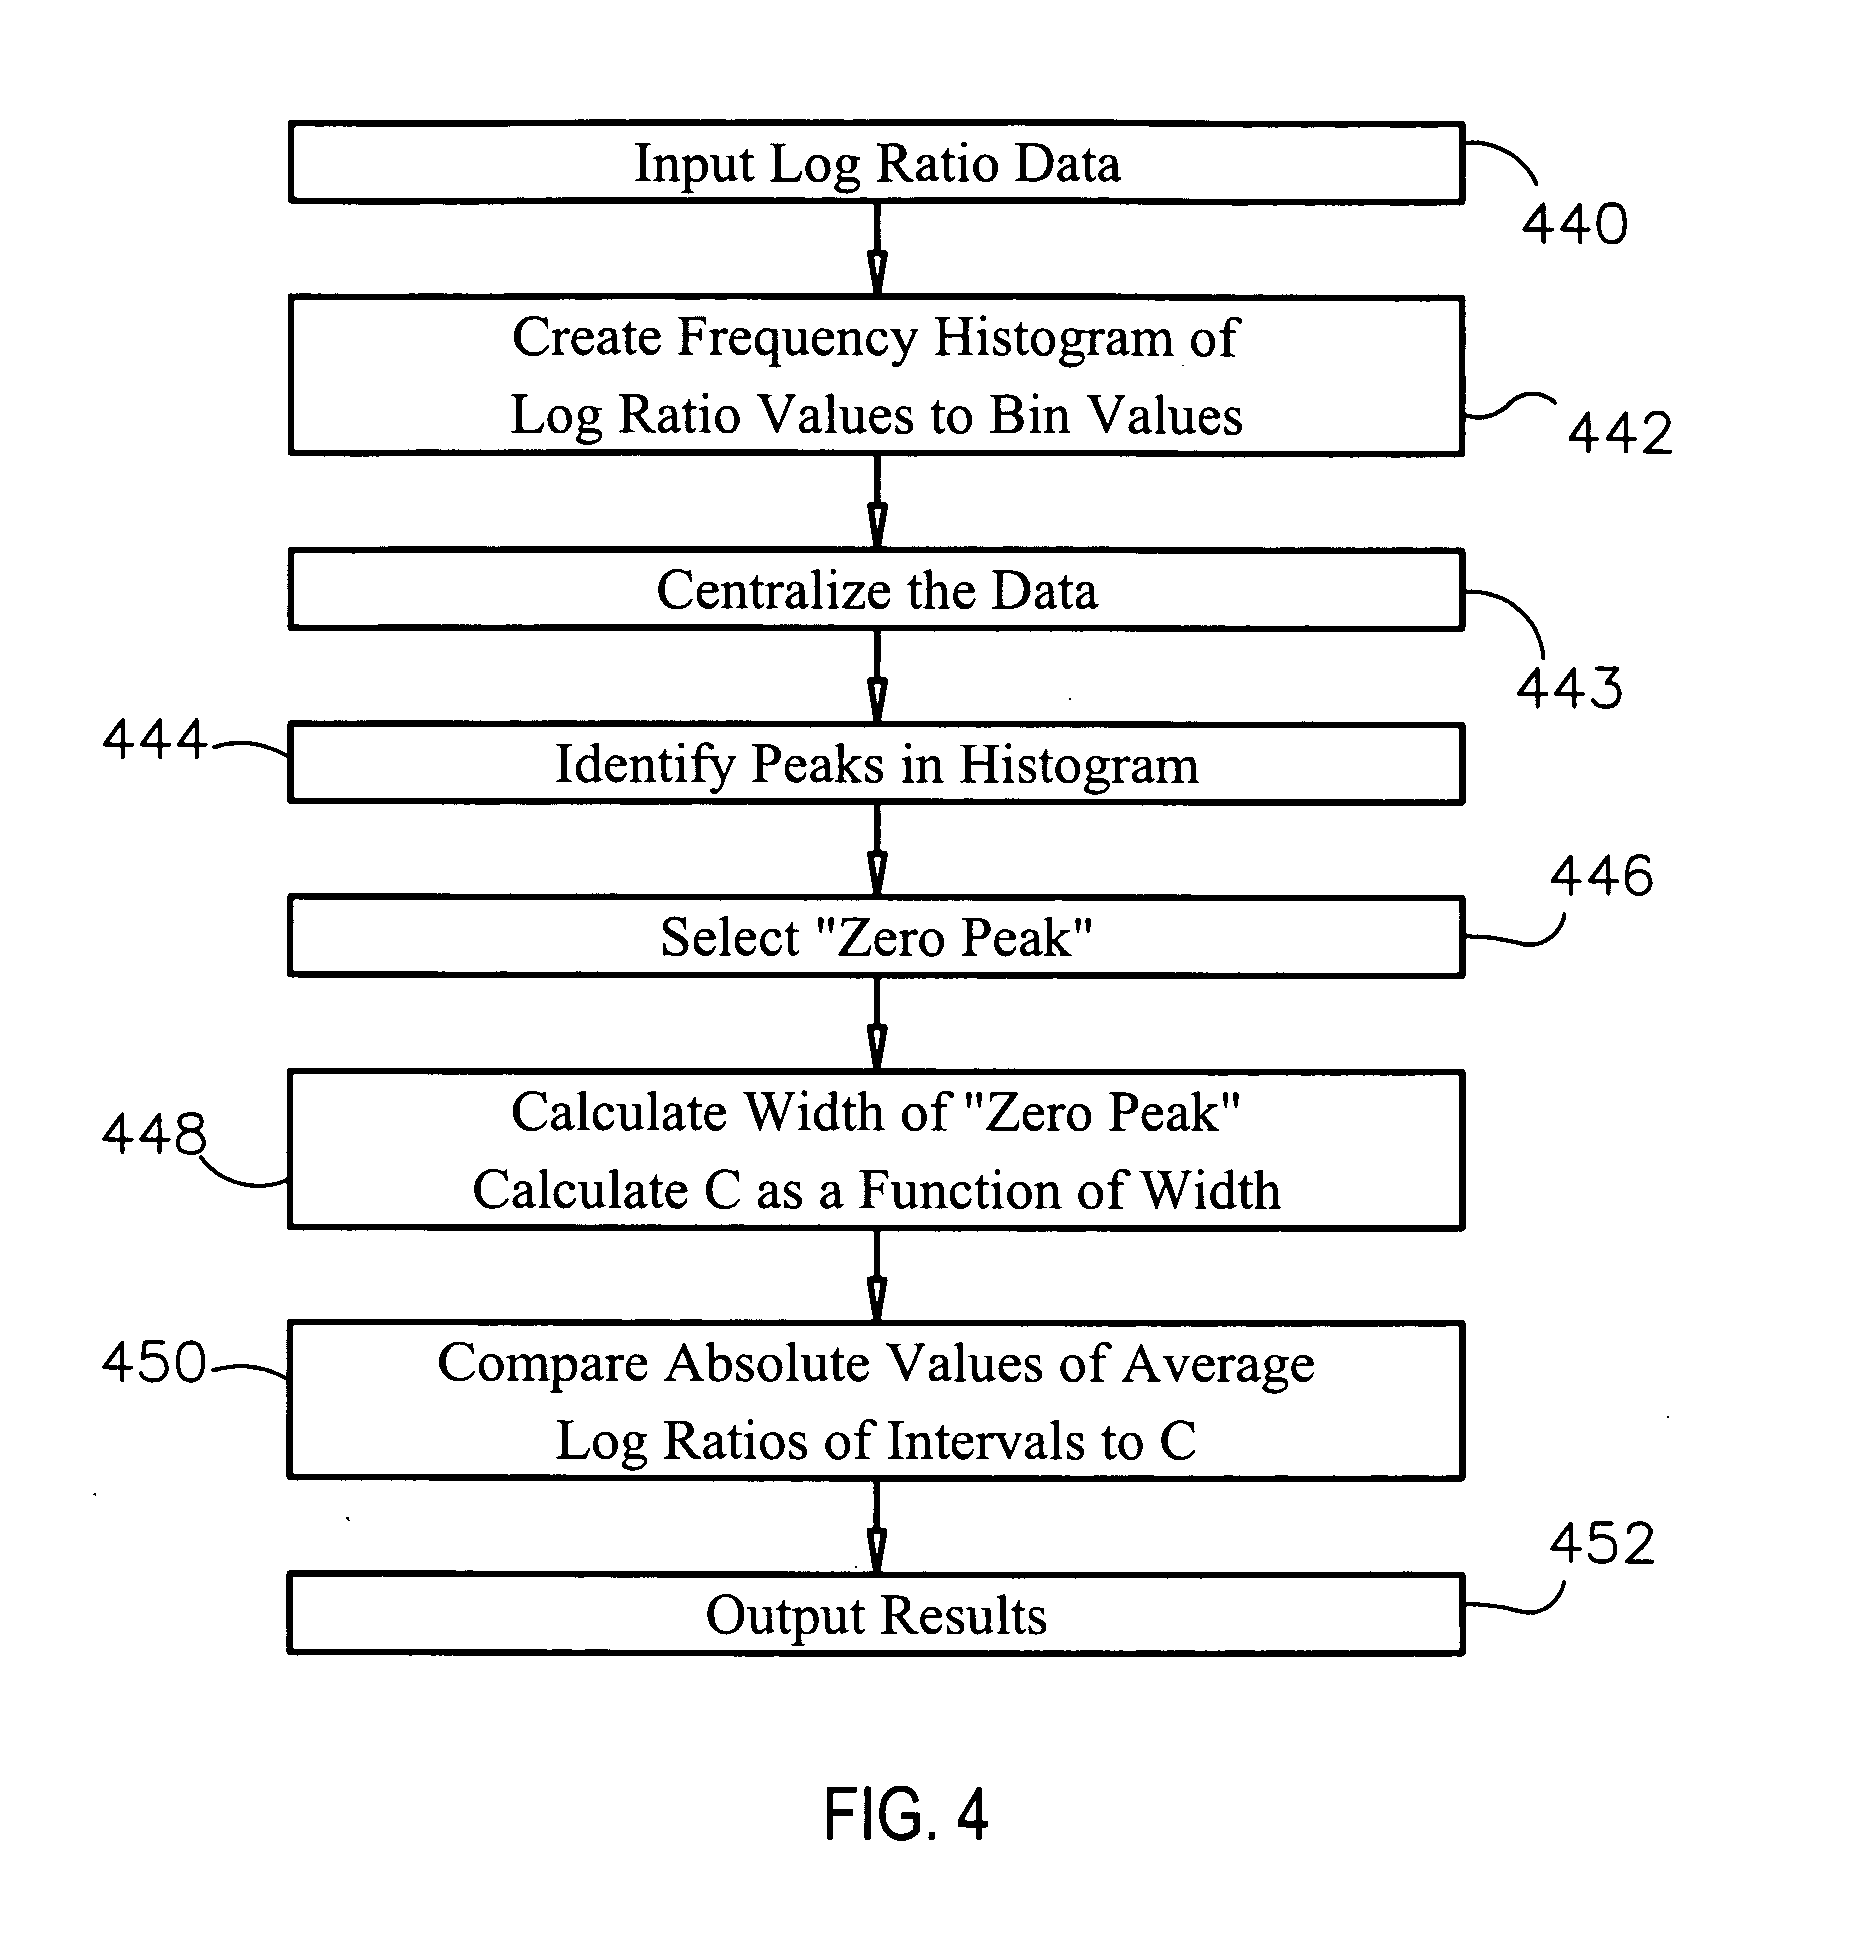
The patent text describes a method for analyzing comparative genomic hybridization data. The method involves creating a centralization curve from log ratio data values of a genome of a test sample relative to a genome of a reference sample. The test sample has a same copy number as the reference sample in normal, non-aberrant genomic regions. The method also involves identifying peaks in the centralization curve and assigning copy numbers to the peaks. The expected ratios of the peaks are then calculated and a linear regression analysis is performed to determine if the data is abnormal. The technical effect of this method is to provide a reliable and accurate way to analyze genomic data and detect abnormalities.

Problems solved by technology

In addition, perinatal genetic problems frequently result from loss or gain of chromosome segments such as trisomy 21 or the micro deletion syndromes.

Method used


Image

  • Methods and systems and analysis of CGH data
  • Methods and systems and analysis of CGH data
  • Methods and systems and analysis of CGH data

Examples


Embodiment Construction

[0036]Before the present systems, methods and computer readable media are described, it is to be understood that this invention is not limited to particular arrays, datasets, software or hardware described, as such may, of course, vary. It is also to be understood that the terminology used herein is for the purpose of describing particular embodiments only, and is not intended to be limiting, since the scope of the present invention will be limited only by the appended claims.

[0037]Where a range of values is provided, it is understood that each intervening value, to the tenth of the unit of the lower limit unless the context clearly dictates otherwise, between the upper and lower limits of that range is also specifically disclosed. Each smaller range between any stated value or intervening value in a stated range and any other stated or intervening value in that stated range is encompassed within the invention. The upper and lower limits of these smaller ranges may independently be ...


PUM

PropertyMeasurementUnit
areaaaaaaaaaaa
areaaaaaaaaaaa
diameteraaaaaaaaaa

Abstract

Methods, systems and computer readable media for analysis of comparative genomic hybridization data analysis, including creating a centralization curve from log ratio data values for DNA copy numbers of a genome of a test sample relative to a genome of a reference sample, wherein the reference sample has a known ploidy, and the test sample has a same copy number as the reference sample in normal, non-aberrant genomic regions; identifying a peak corresponding to regions of normal copy number in the centralization curve; centralizing the log ratio data so that the peak corresponding to regions of normal copy number is centered at a log ratio value of zero; calculating a mathematical measurement that is a function of the width of the peak corresponding to regions of normal copy number; calculating a tolerance value as a function of the mathematical measurement; and outputting the tolerance value. Methods, systems and computer readable media are provided to create a centralization curve from log ratio data values for DNA copy numbers of a genome of a test sample relative to a genome of a reference sample, wherein the reference sample has a known ploidy, and the test sample has a same copy number as the reference sample in normal, non-aberrant genomic regions; identify peaks in the centralization curve; assign copy numbers to the identified peaks; plot expected ratios, based on the assigned copy numbers, of the peaks versus observed ratios of the peaks calculated from the log ratio data values; conclude that the assigned copy numbers are correct if the plot of the expected ratios versus the observed ratios is substantially linear; and output at least one of the plot of expected ratios versus observed ratios, and a conclusion as to whether the plot is substantially linear.

Description

BACKGROUND OF THE INVENTION[0001]Many genomic and genetic studies are directed to the identification of differences in gene dosage or expression among cell populations for the study and detection of disease. For example, many malignancies involve the gain or loss of DNA sequences (alterations in copy number), sometimes entire chromosomes, that may result in activation of oncogenes or inactivation of tumor suppressor genes. Identification of the genetic events leading to neoplastic transformation and subsequent progression can facilitate efforts to define the biological basis for disease, improve prognostication of therapeutic response, and permit earlier tumor detection. In addition, perinatal genetic problems frequently result from loss or gain of chromosome segments such as trisomy 21 or the micro deletion syndromes. Trisomy of chromosome 13 results in Patau syndrome. Abnormal numbers of sex chromosomes result in various developmental disorders. Thus, methods of prenatal detection...

Claims


Application Information

Patent Timeline
Patent Type & Authority Applications(United States)
IPC IPC(8): C12Q1/68G06F19/00G16B25/00
CPCG16B25/00
Inventor GHOSH, JAYATICURRY, BO U.
Owner AGILENT TECH INC
Learn More