Method and apparatus for intuitively administering networked computer systems

Inactive Publication Date: 2007-02-08
CA TECH INC
View PDF24 Cites 116 Cited by
  • Summary
  • Abstract
  • Description
  • Claims
  • Application Information

AI Technical Summary

Benefits of technology

[0037] A. Real World Interface. The present invention is a system and apparatus for visualizing the components of a computer network system as a realistic three-dimensional environment for the purposes of systems and network management. The three-dimensional rendering called the “Real World Interface,” by using “Virtual Reality” technology, shows computer systems, printers, network routers and other devices with their network interconnections, in a realistic or stylized environment symbolizing a geographic region like a country, region or city, together with buildings. The user of the system can travel in the environment, using various interaction devices, and directly select devices for manipulation. The useful, practical application of the present invention is to allow the administration of systems comprising 10,000 units or more efficiently, by displaying in virtual reality on a computer monitor the relevant portions of a computer network, thus allowing the use to be intuitive as if physically present at numerous remote locations.
[0038] Further, the present invention allows the user to visualize all the information known to a distributed, multifaceted database, and to provide an overview of all the data, by use of comprehensive, manageable, intuitive views that relate to practical business issues. The present invention also includes a real world interface which uses automatic piloting or alternatively, manual piloting for traversing the networked topography. Fast pathing and color coded alerts allow the user to determine precisely which resource is experiencing a problem. Users can then drill down to any node and access management functions to resolve the problem or administer the system. The present invention exceeds the design goals of prior art systems and interfaces. However, the present invention offers a choice of user interfaces including tree views and two dimensional map views. All of these user interfaces offer a high degree of user defined customization and filtering capabilities including the ability to create business process views.
[0039] Such views and visual aids allow a systems administrator to maximize use of his or her intuitive, communicative, and diagnostic skills in applying such diagnostic and corrective systems to address a malfunction in hardware, firmware, or software. Business interest views filter the views to isolate specific business interests, such as management inventory or payroll, and then to present virtual reality views, allowing an administrator of a networked computer system to review and manage the specific assets that relate to that business interest.

Problems solved by technology

Prior art systems were deficient generally for two reasons: first, limitations inherent in available user interfaces, and second, absence of open-architecture, integrated systems effectively to manage and administer heterogeneous platforms using diverse operating systems for many different applications, including information technology and business management administration and to isolate views of specific business and management interests.
Each of the displayed categories of information works well but with critical limitations.
For example, the use of two dimensional lists is definitely limited by the number of units: as the number increases, the lists become effectively unmanageable by the user.
Further, the hierarchical systems can allow increased navigating ability but are again limited to a few thousand devices and by the fact that the only relationships that can be displayed are those within the hierarchy.
This is limited typically because the tree structure is based on a single hierarchy; for example, it may be organized geographically and this will not allow display of units in multiple geographical locations that are a part of a particular business interest.
Even when using the folders-icon system, although multiple hierarchies can be displayed, the user tends to be confused or is provided incomplete information by the limited amount of data that can be provided.
Although through certain enhancements, the tree diagram / map system can improve on its effectiveness, such as by showing a transmission line as green if it is functioning and red if it is not, it and the other prior art interface systems are still limited to several thousand units.
In the case of all of the aforementioned prior art systems discussed above, none can be effectively used in the modern environment in which it is not uncommon to have 10,000 computer devices to more than 100,000 such devices in a networked system.
Further, the prior art systems limit the scope of the responsibility of the systems administrator.
As the number of units within a network system increases, the number of physical and logical relationships between the systems responsible for the various functions increases exponentially so it becomes very difficult, if not impossible, to manage the network system.
Even trained professionals cannot deal with the enormous numbers of relationships that must be monitored and managed in the complex systems.
; plus software distribution tools, desktop asset management tools, help desk and trouble-ticketing tools all had to be separately provided, and their compatibility constantly was problematic.
In such large networks, administration became time-consuming and tedious because the system administration was in the same physical location as the workstation.
Since these workstations are typically spread over a large areas such as a large, multi-story building, multiple cities, and even multiple countries, a significant amount of time and effort was spent in traveling between workstations to perform management tasks.
However, client-server application management was non-existent.
Client-server users could only inefficiently, if at all, account for the assets within the system, determine what applications were on their networks, assess how those applications were performing, identify failures occurring in hardware or software assets, and then diagnose and correct faults.
In part, because of these difficulties, planning for network growth also was a task that was difficult at best.
Unsuccessful attempts have been made to develop an end-to-end solution to provide real time information about application health, administration, service level and performance.
Failures were hard to trace when the application management was not part of a system / network management scheme.
Typically, businesses reported that a significant percentage of client-server trouble reports were attributed to application software.
However, in distributed environments, following the data flow is a complex task, since application and data go through many steps.
However, as systems became larger, more widespread, and more heterogeneous, prior to the present invention, there has been no acceptable method for a manager fully to comprehend either the network system or the assets relevant to a particular malfunctioning subsystem.
Conventional human interfaces, such as “trees” which displayed the structure of the network in text form, or simple icons, which represented parts of the system in two-dimensional form, were inadequate to provide a real-time system overview, or subsystem overview to allow the administrator to envision a system, its malfunction, and the corrective action needed.
However, this common user interface approach has several disadvantages.
It is also psychologically jarring, and interrupts the work flow.
While such systems have several usability advantages, they have not been able to represent the more complex structures that require graph diagrams, with interconnected nodes.
Each of these techniques has advantages, but none is good at handling one particular problem: following a trail of relationships in a very large and bushy graph.
The problem is common, and is characterized by a rapid fan-out of links.
Various prior-art visualization techniques attempt to deal with the problem through nesting, filtering or scrolling, but none is very successful.

Method used


Image

  • Method and apparatus for intuitively administering networked computer systems
  • Method and apparatus for intuitively administering networked computer systems
  • Method and apparatus for intuitively administering networked computer systems

Examples


Embodiment Construction

[0083] A. Constructing the Inventive System

[0084] The invention is accomplished by use of the 3-D graphical user interface, network discovery and monitoring software engines that interact with and enable the interface and a central repository, and a central repository comprising a comprehensive database describing every computer-related asset on a network.

[0085] In the preferred embodiment all of the objectives of the present invention are accomplished.

[0086] Architecture

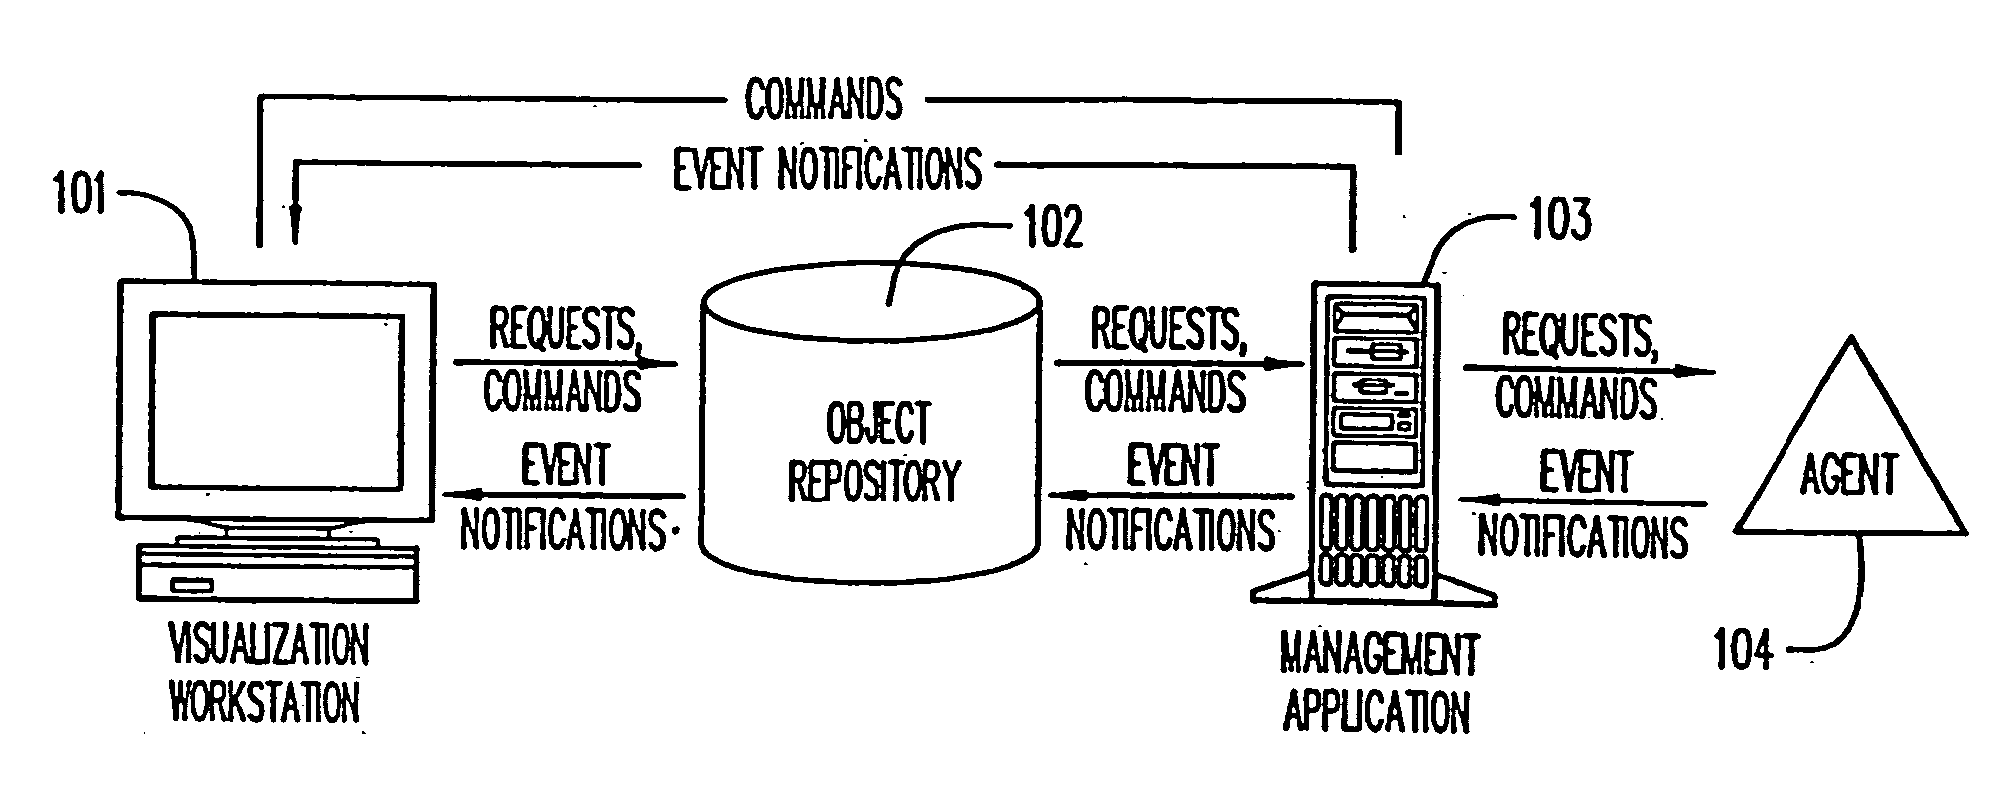
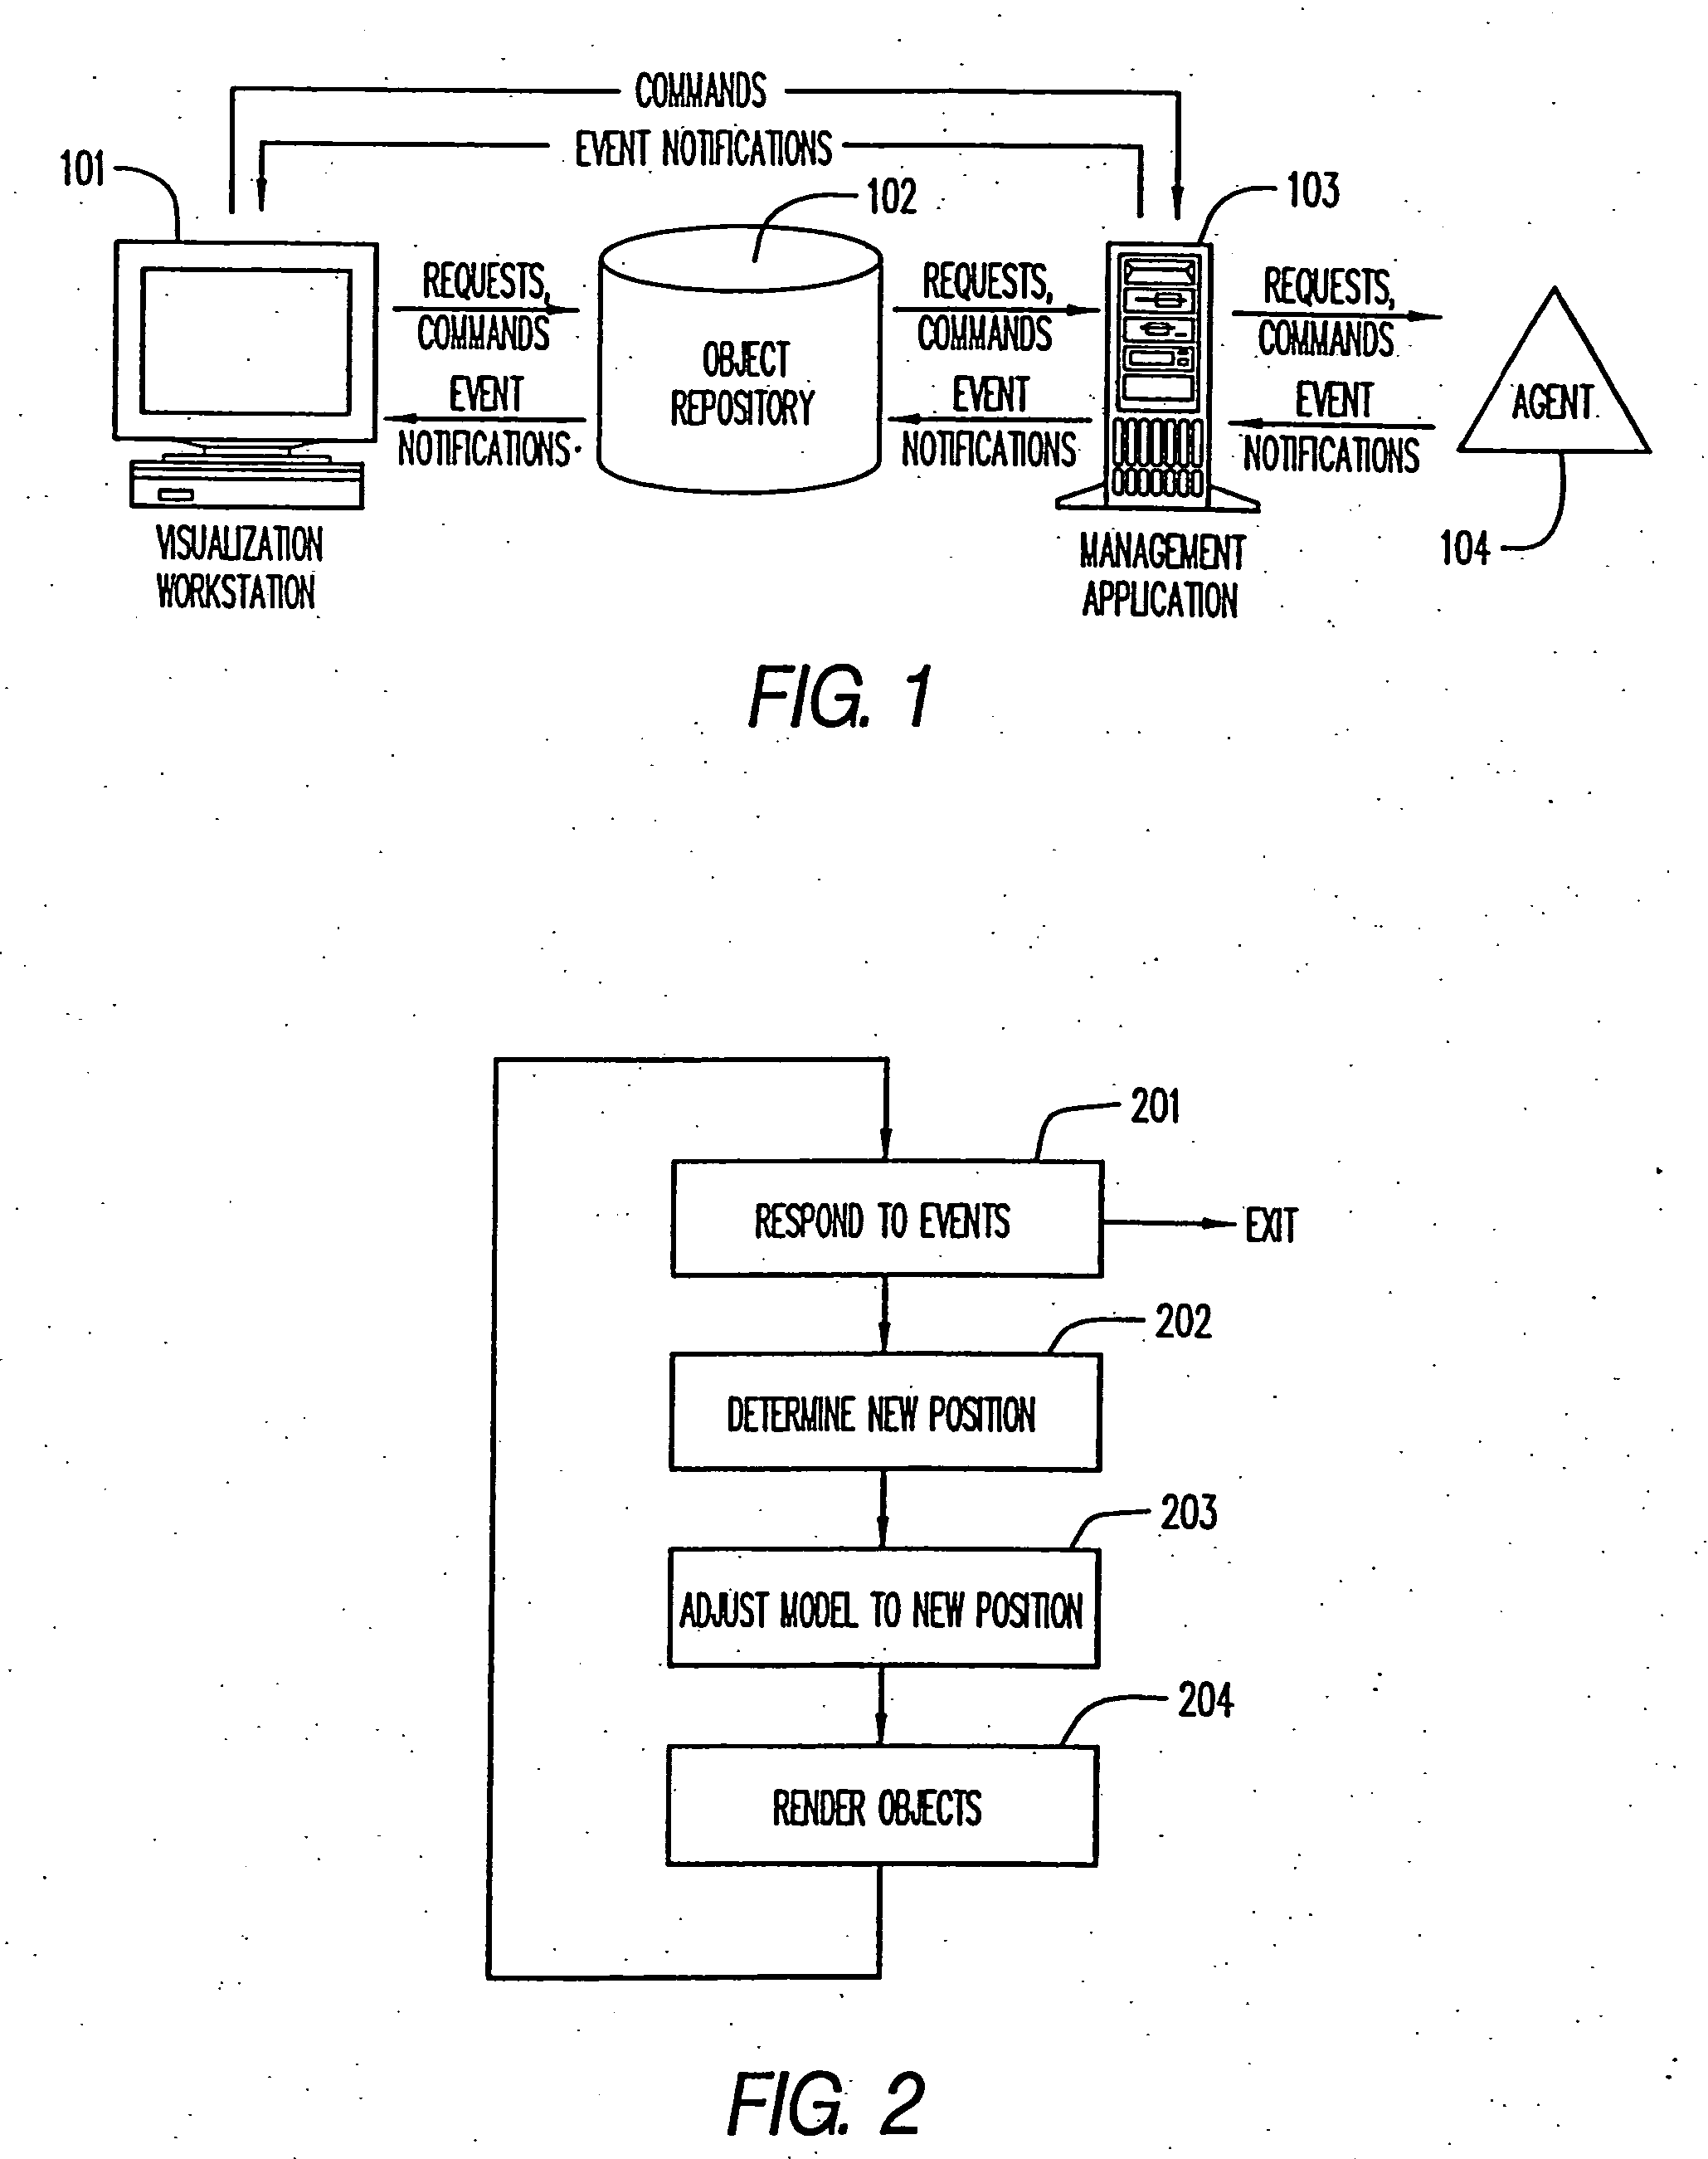
[0087] The various components that comprise the complete network analysis system is shown in FIG. 1, and includes one or more of visualization workstation 101, an object repository 102, one or more management applications 103, and one or more agents 104 on each such management application. The visualization workstation interacts primarily with the object repository 102: it requests information from it, it sends commands to it, and it gets notifications of events such as status changes or object additions from it...


PUM


Abstract

A method and apparatus intuitively to administer all components of a networked computer system by use of real multi-dimensional views of any component or any set of components, including components related to a specific business interest, and with customizable and fully extensible functionality, across heterogenous platforms and applications. Navigation and configuration tools are provided, with an intelligent cursor, to travel to and address any component part thereof, or subset of components, with status and abnormalities identified, monitored and controlled, and by hierarchical filtration, and aggregation correlation with asynchronous notification. Graphical presentation tools are also provided employing an enhanced zooming graphical display.

Description

CROSS-REFERENCES TO RELATED APPLICATIONS, IF ANY [0001] This application is a Continuation-In-Part of U.S. Ser. No. 09 / 408,213 filed Sep. 17, 1999, which is a continuation of U.S. Ser. No. 08 / 829,919 filed Jul. 15, 1997, which is a continuation of U.S. Provisional Application Ser. No. 60 / 021,980 filed Jul. 18, 1996. Each of these related applications are incorporated by reference, herein.STATEMENT AS TO RIGHTS TO INVENTION MADE UNDER FEDERALLY SPONSORED RESEARCH AND DEVELOPMENT, IF ANY [0002] This patent is not based upon any federally sponsored research and development. BACKGROUND OF INVENTION [0003] A. Field of Invention [0004] The present invention is in the field of systems and articles of manufacture to administer complex, heterogeneous networked computer systems. [0005] B. Related Background Art [0006] Prior art systems were deficient generally for two reasons: first, limitations inherent in available user interfaces, and second, absence of open-architecture, integrated system...

Claims


Application Information

Patent Timeline
IPC IPC(8): G06F15/173
CPCH04L12/2602H04L41/0213H04L41/06H04L43/028H04L41/16H04L41/22H04L43/00H04L41/12
Inventor BATTAT, REUVENHERSUNDARESH, CHANDRASEKHARVINBERG, ANDERSWANG, SIDNEY
Owner CA TECH INC
Why Eureka
Try Eureka