
Event analysis system and method

Inactive Publication Date: 2006-05-04
CANADIAN MEDICAL PROTECTIVE ASSOC
View PDF15 Cites 46 Cited by
  • Summary
  • Abstract
  • Description
  • Claims
  • Application Information

AI Technical Summary

Benefits of technology

[0015] The event analysis system is used to bring the following advantages to the analysts who are the target users of the system: more efficient organizing, a more effective quality assessment and continuous quality improvement process, improved error detection, an easier mechanism to transfer knowledge, and a simpler way to present the results of sequencing. Advantageously, the invention allows for the visual organization of event elements in an event that can be used to analyse the event. Moreover, the invention allows for the capture of multiple events by allowing for multiple orders. Patterns can be searched in multiple chains of event elements for more complex analysis. Thus, the event analysis system and method can be used as an educational tool to reduce the chance of negative episodes from re-occurring.

Problems solved by technology

Cause and effect of events can be difficult to determine.
This is problematic since the organization of events for cause-and-effect (or root-cause) analysis can be onerous.
Relationships between events can be complicated such that an analyst cannot simply organize the event elements progressively.
Another disadvantage with manual ordering is that a medical analyst who understands the ICD-10-CA / CCI coding, or whatever classification system is used, is needed in order to be able to perform the ordering.
Another disadvantage is that with a chain of event elements having multiple levels or progressions of care, an analyst can only assume a cause and effect relationship for a first level of event elements.
There is no prior art that can be used by an analyst to analyse a chain of event elements (or events) to visually or graphically determine a root-cause or perform a cause-and-effect analysis.
Without showing inter-dependence of event elements, an analyst is unable to easily determine which event elements may be related to multiple other event elements.
Moreover, graphical programming art described above cannot be used to analyze the cause-and-effect of a chain of event elements.

Method used


Image

  • Event analysis system and method
  • Event analysis system and method
  • Event analysis system and method

Examples


Embodiment Construction

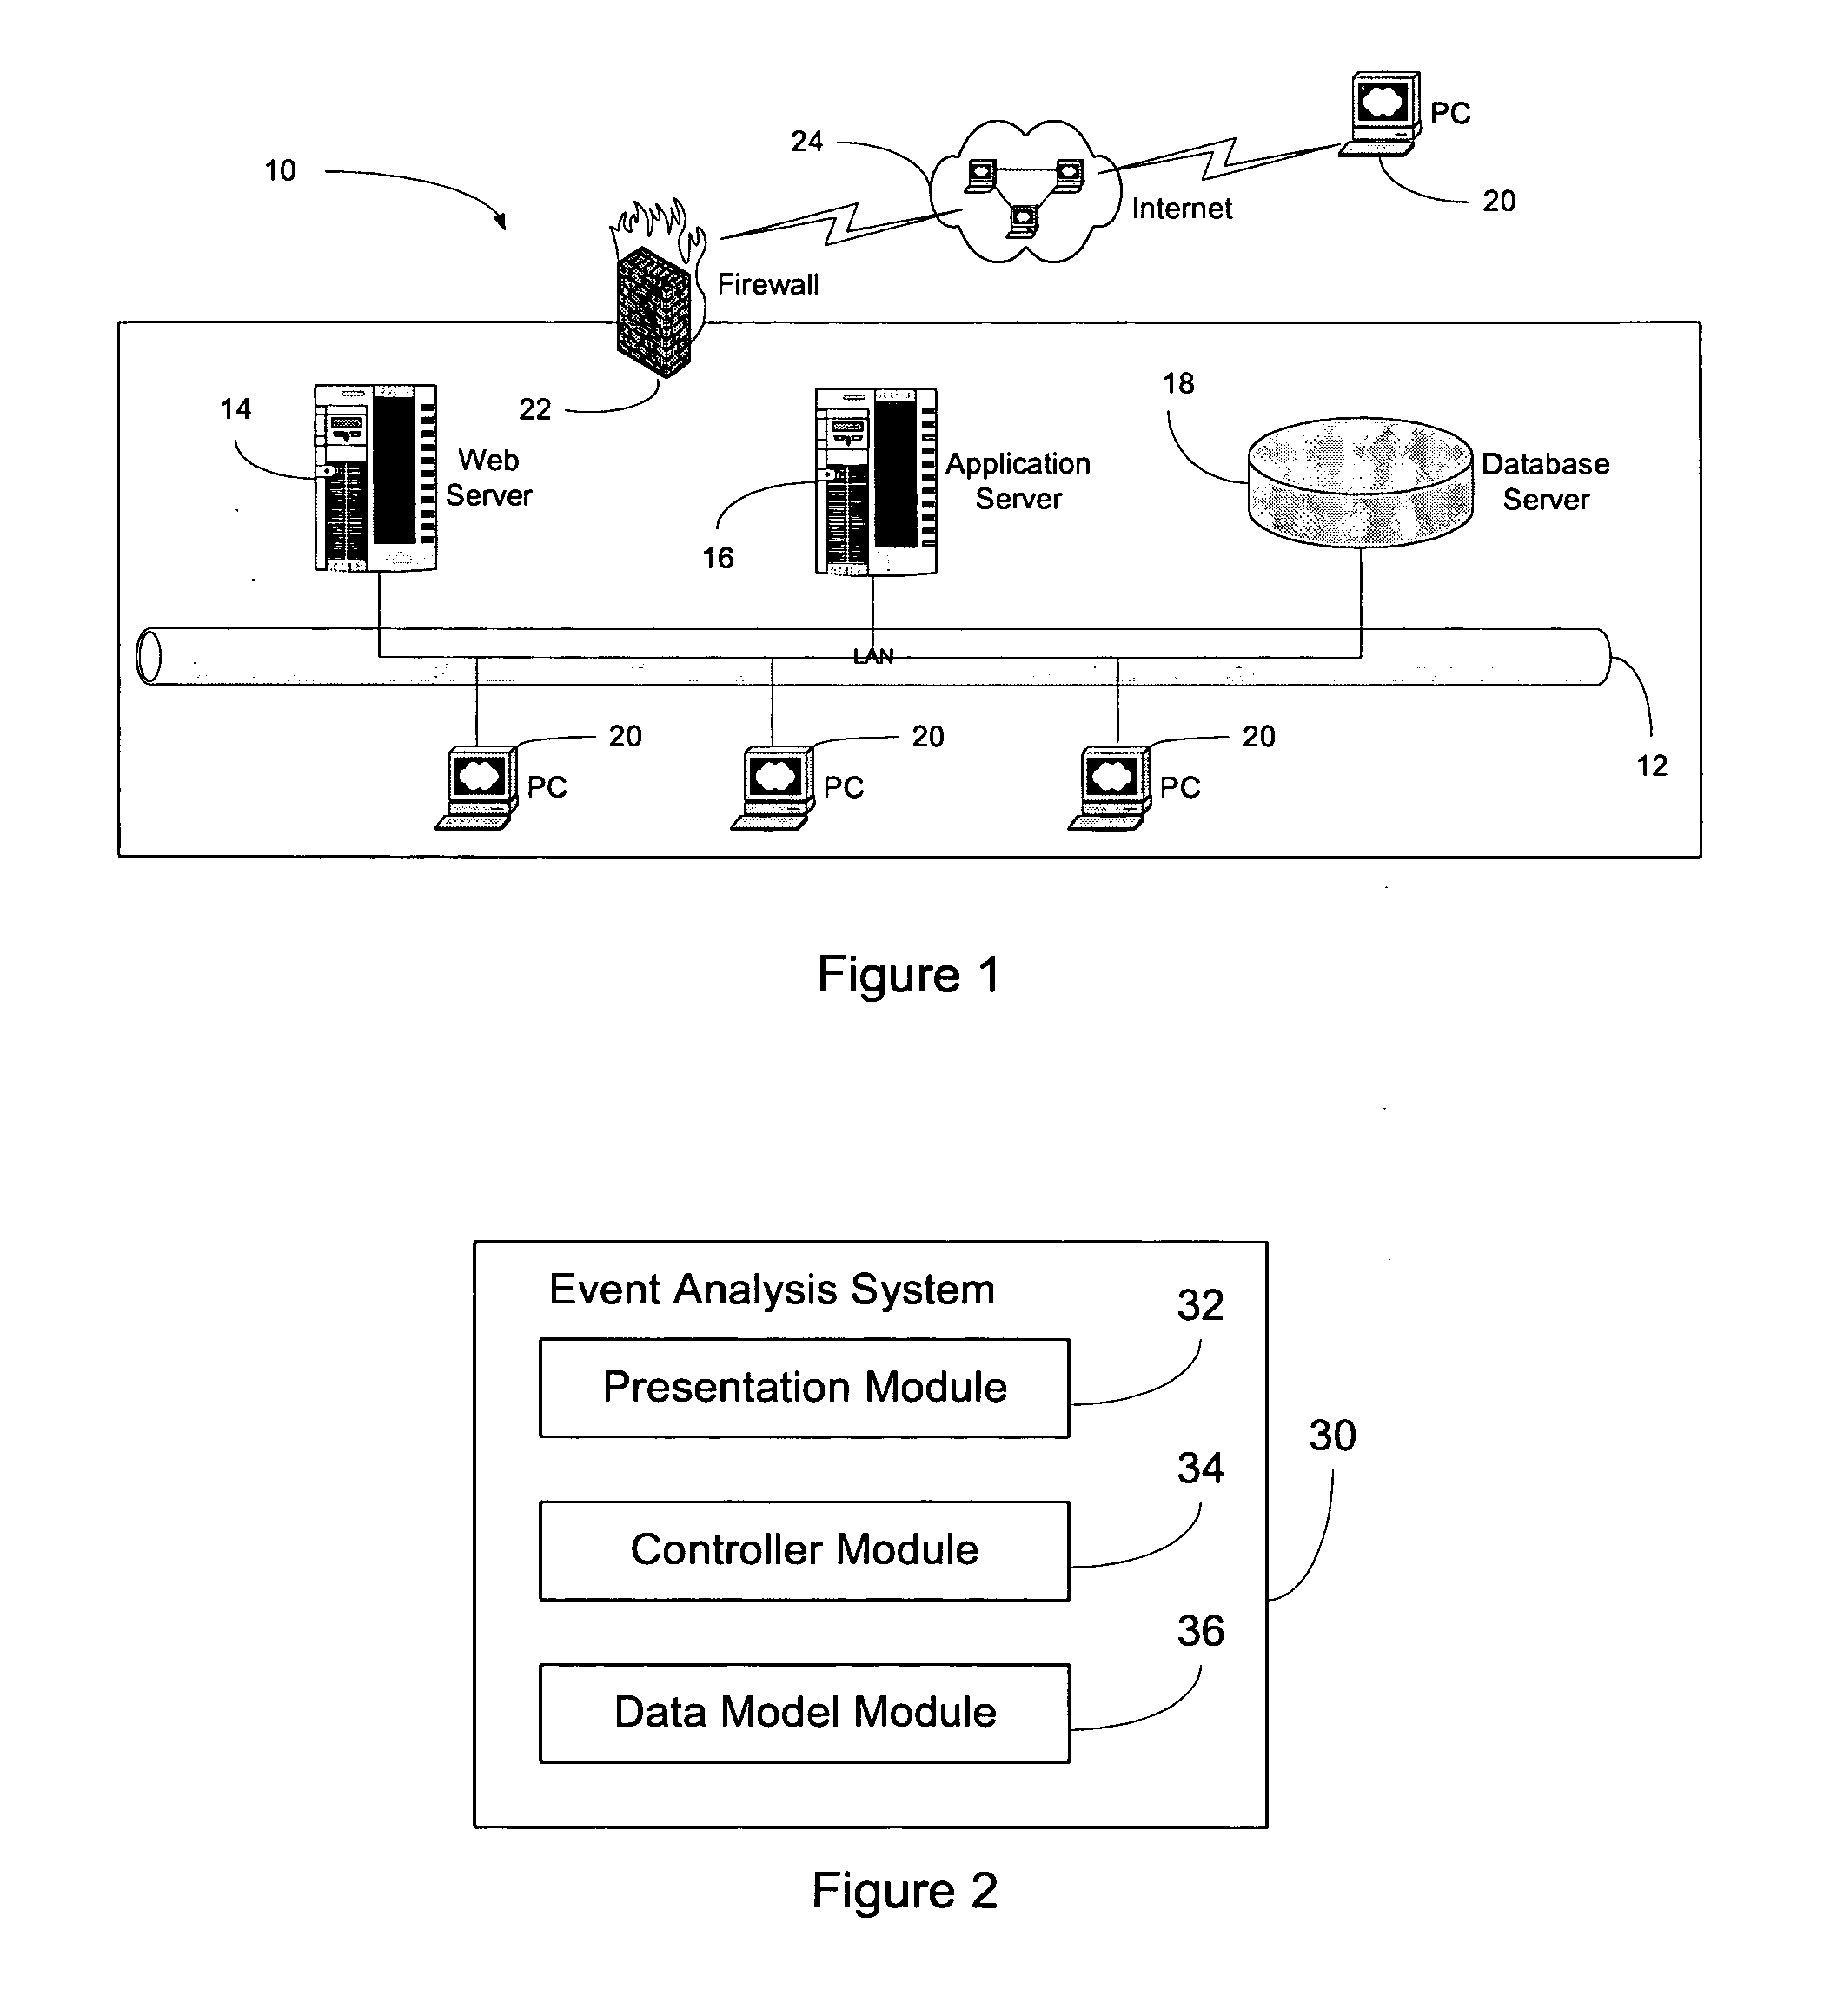
[0033]FIG. 1 shows an example of a typical system architecture 10, used in accordance with an embodiment of the present invention. The system architecture 10 comprises a local area network (LAN) 12, a web server 14, an application server 16, a database server 18, one or more workstations or PCs 20, and a firewall 22. The LAN 12 is also connected to an external network 24, such as the Internet, with protection provided by the firewall 22. The firewall 22 acts as a gatekeeper for all incoming and outgoing traffic. A user may access the web server 14 on the LAN 12 using a PC 20 connected to the LAN 12 or to an external network 24. One skilled in the art will appreciate alternative implementations, including software components implemented without networks on a stand-alone machine.

[0034]FIG. 2 shows an example of an event analysis system 30 for analysing events, in accordance with an embodiment of the present invention. The event analysis system 30 comprises a presentation module 32 fo...


PUM


Abstract

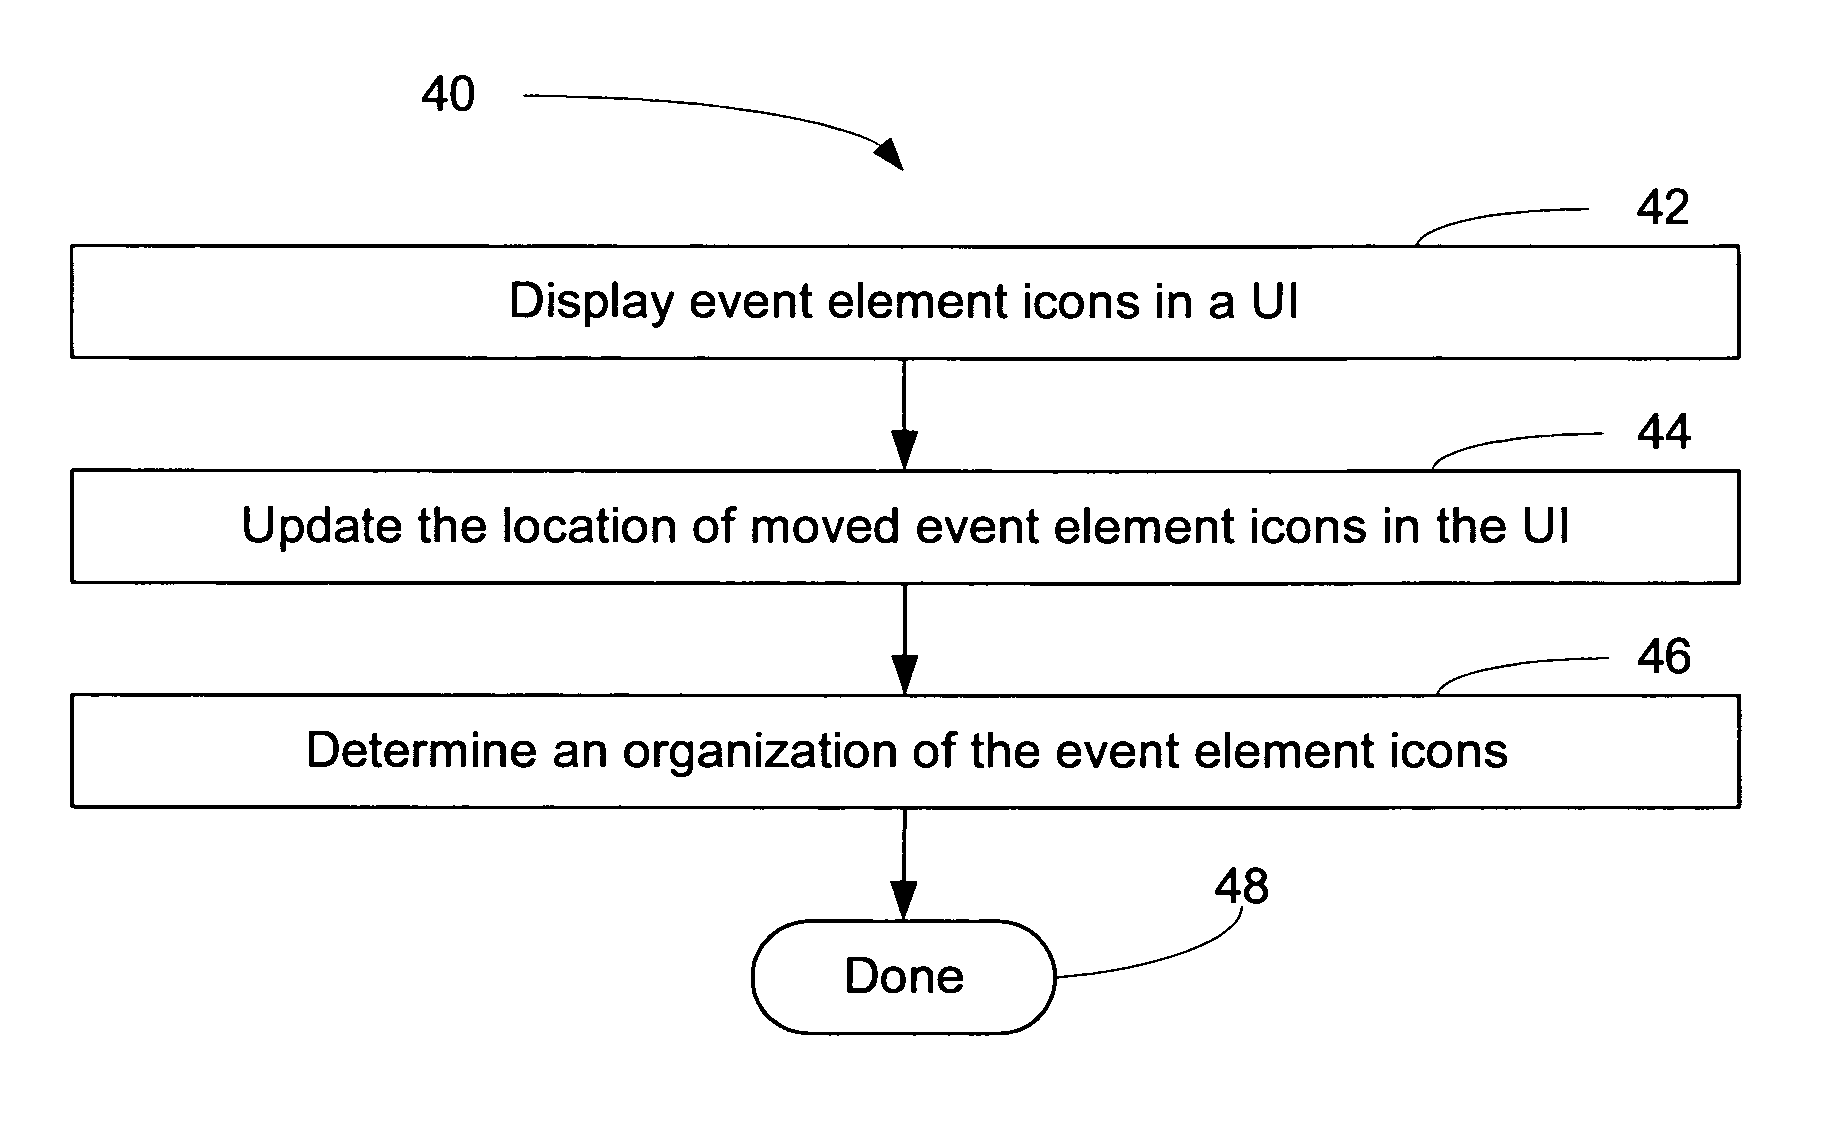
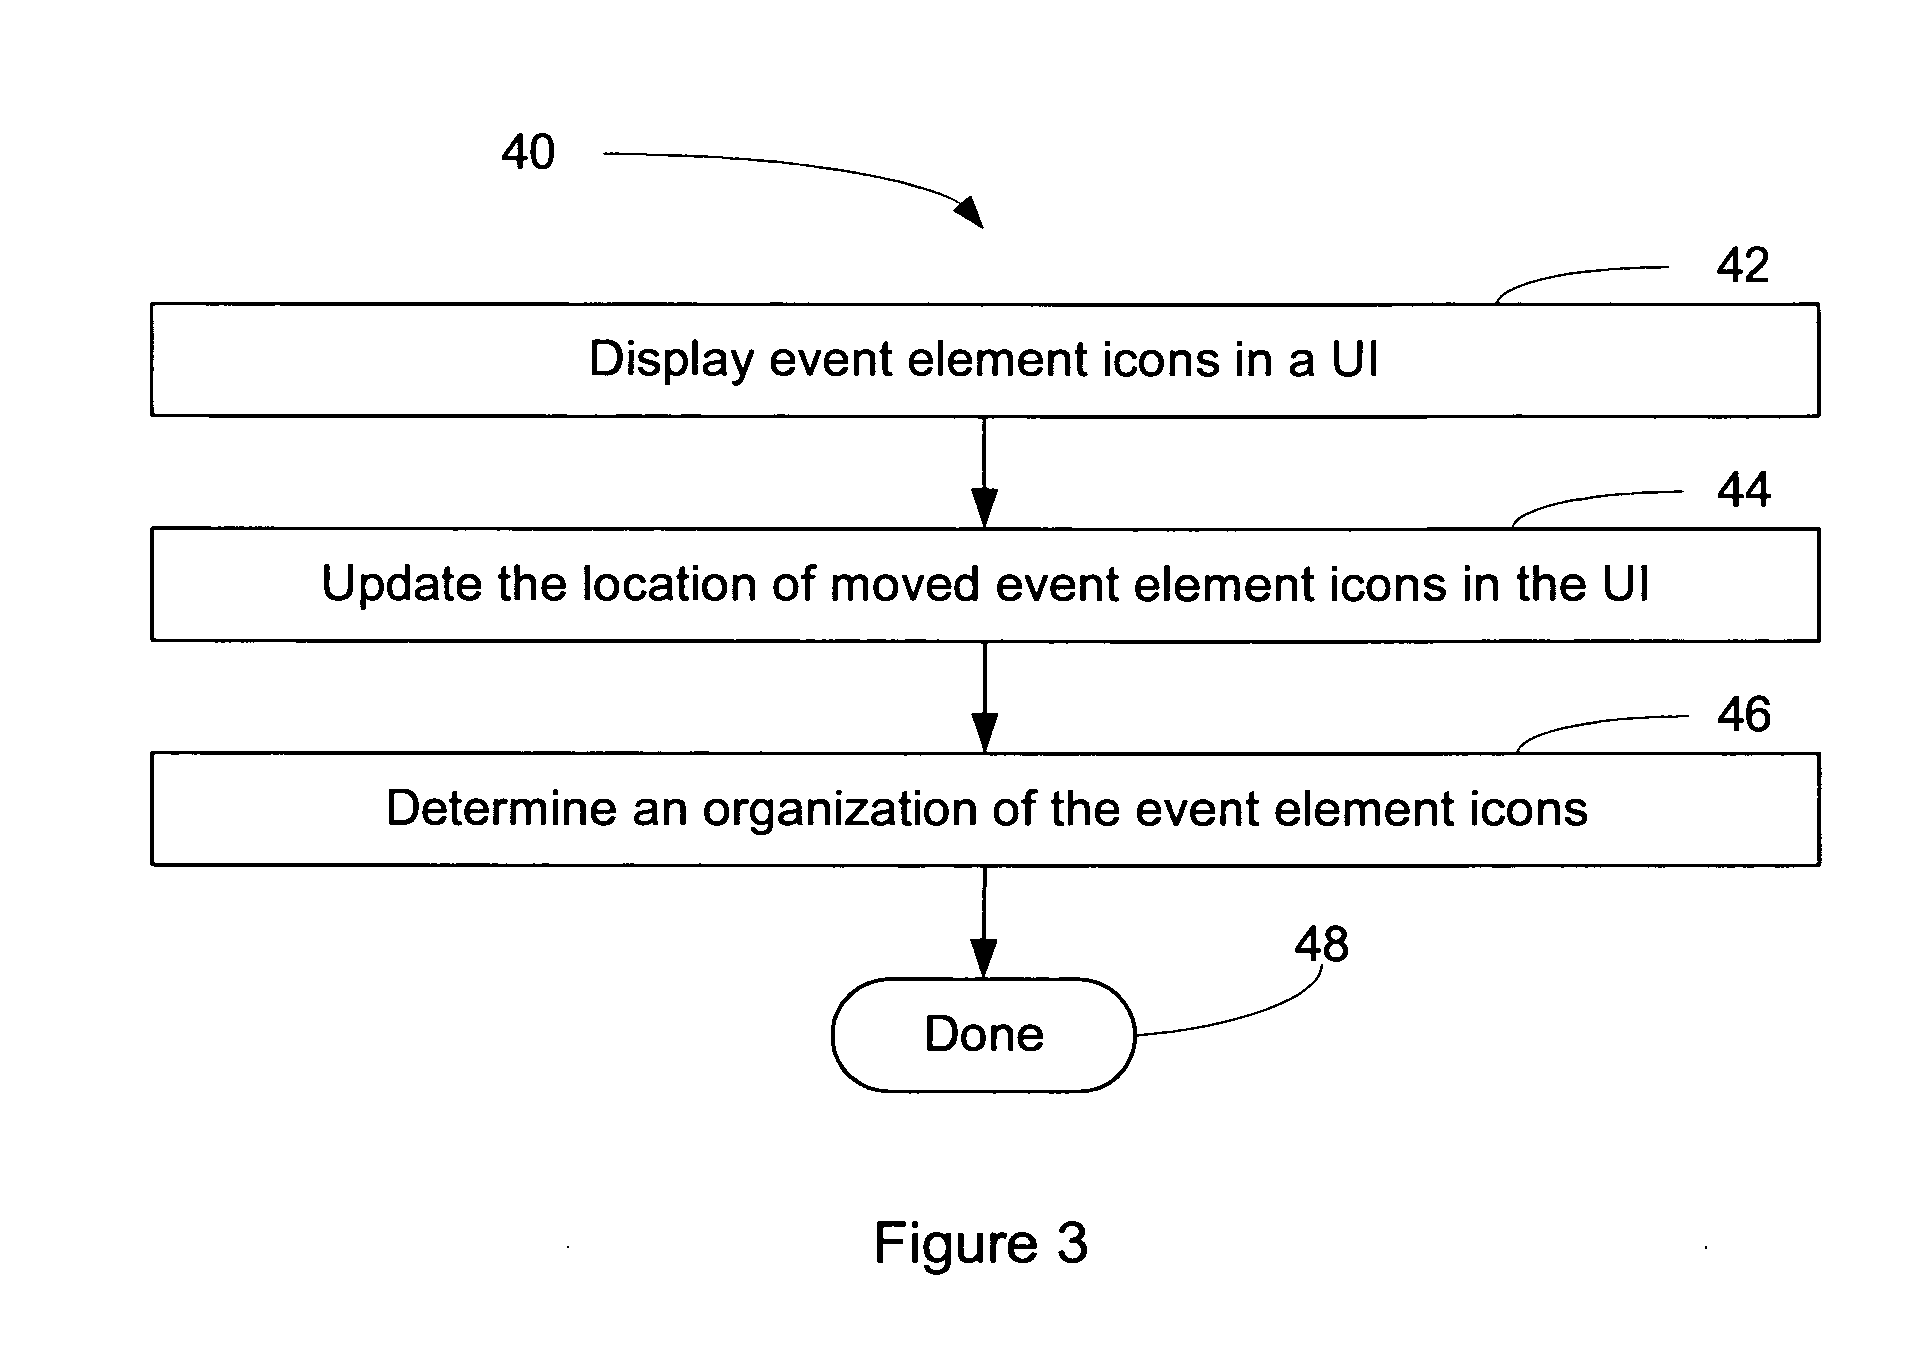
An event analysis system and method of analysing events are provided. The method comprises the steps of displaying event element icons in a user interface, updating the location of moved event element icons in the user interface, and determining an organization of the event elements based upon the location of the event element icons in the user interface. The event element icons represent event elements in an event or chain of event elements. The event element icons are movable in a coding panel of the user interface. The event analysis system comprises a presentation module for generating a user interface and event element icons for the user interface, a controller module for controlling the display of the user interface, and a data model module for holding a data structure representing the event elements and used to generate the event element icons.

Description

FIELD OF THE INVENTION [0001] The invention relates to an event analysis system and method. BACKGROUND OF THE INVENTION [0002] Cause and effect of events can be difficult to determine. Event analysts analyse events elements to try to determine the cause or effect of an event element in a chain of event elements. For example, when tracking a courier package, event elements can include providing a package to a courier company, a courier handling the package, a courier delivering the package to a correct location, a courier delivering the package to an incorrect location, a courier getting into an accident, late delivery, etc. In another example of an event, when attempting to analyse a vehicle or aircraft accident, event elements may include maintenance of the vehicle or aircraft, different operators of the vehicle or aircraft during different legs of a journey, passengers entering or exiting the vehicle or aircraft, vehicle or aircraft component failure, etc. Other examples of events...

Claims


Application Information

Patent Timeline
IPC IPC(8): G06F17/00G06Q10/06G06F3/048G06F3/0481
CPCG06F19/327G06F19/3443G06F19/3487G06Q50/22G16H15/00G16H40/20G16H40/60G16H50/70
Inventor AMYOT, ELISEHO, TUAN
Owner CANADIAN MEDICAL PROTECTIVE ASSOC
Learn More