
Protein mapping

a technology of protein and peptide, applied in the field of protein mapping, can solve the problems of many limitations of traditional 2-d pages, and achieve the effects of low recovery, high-resolution separation, and elimination of problems

Inactive Publication Date: 2004-01-15
RGT UNIV OF MICHIGAN
View PDF11 Cites 30 Cited by
  • Summary
  • Abstract
  • Description
  • Claims
  • Application Information

AI Technical Summary

Benefits of technology

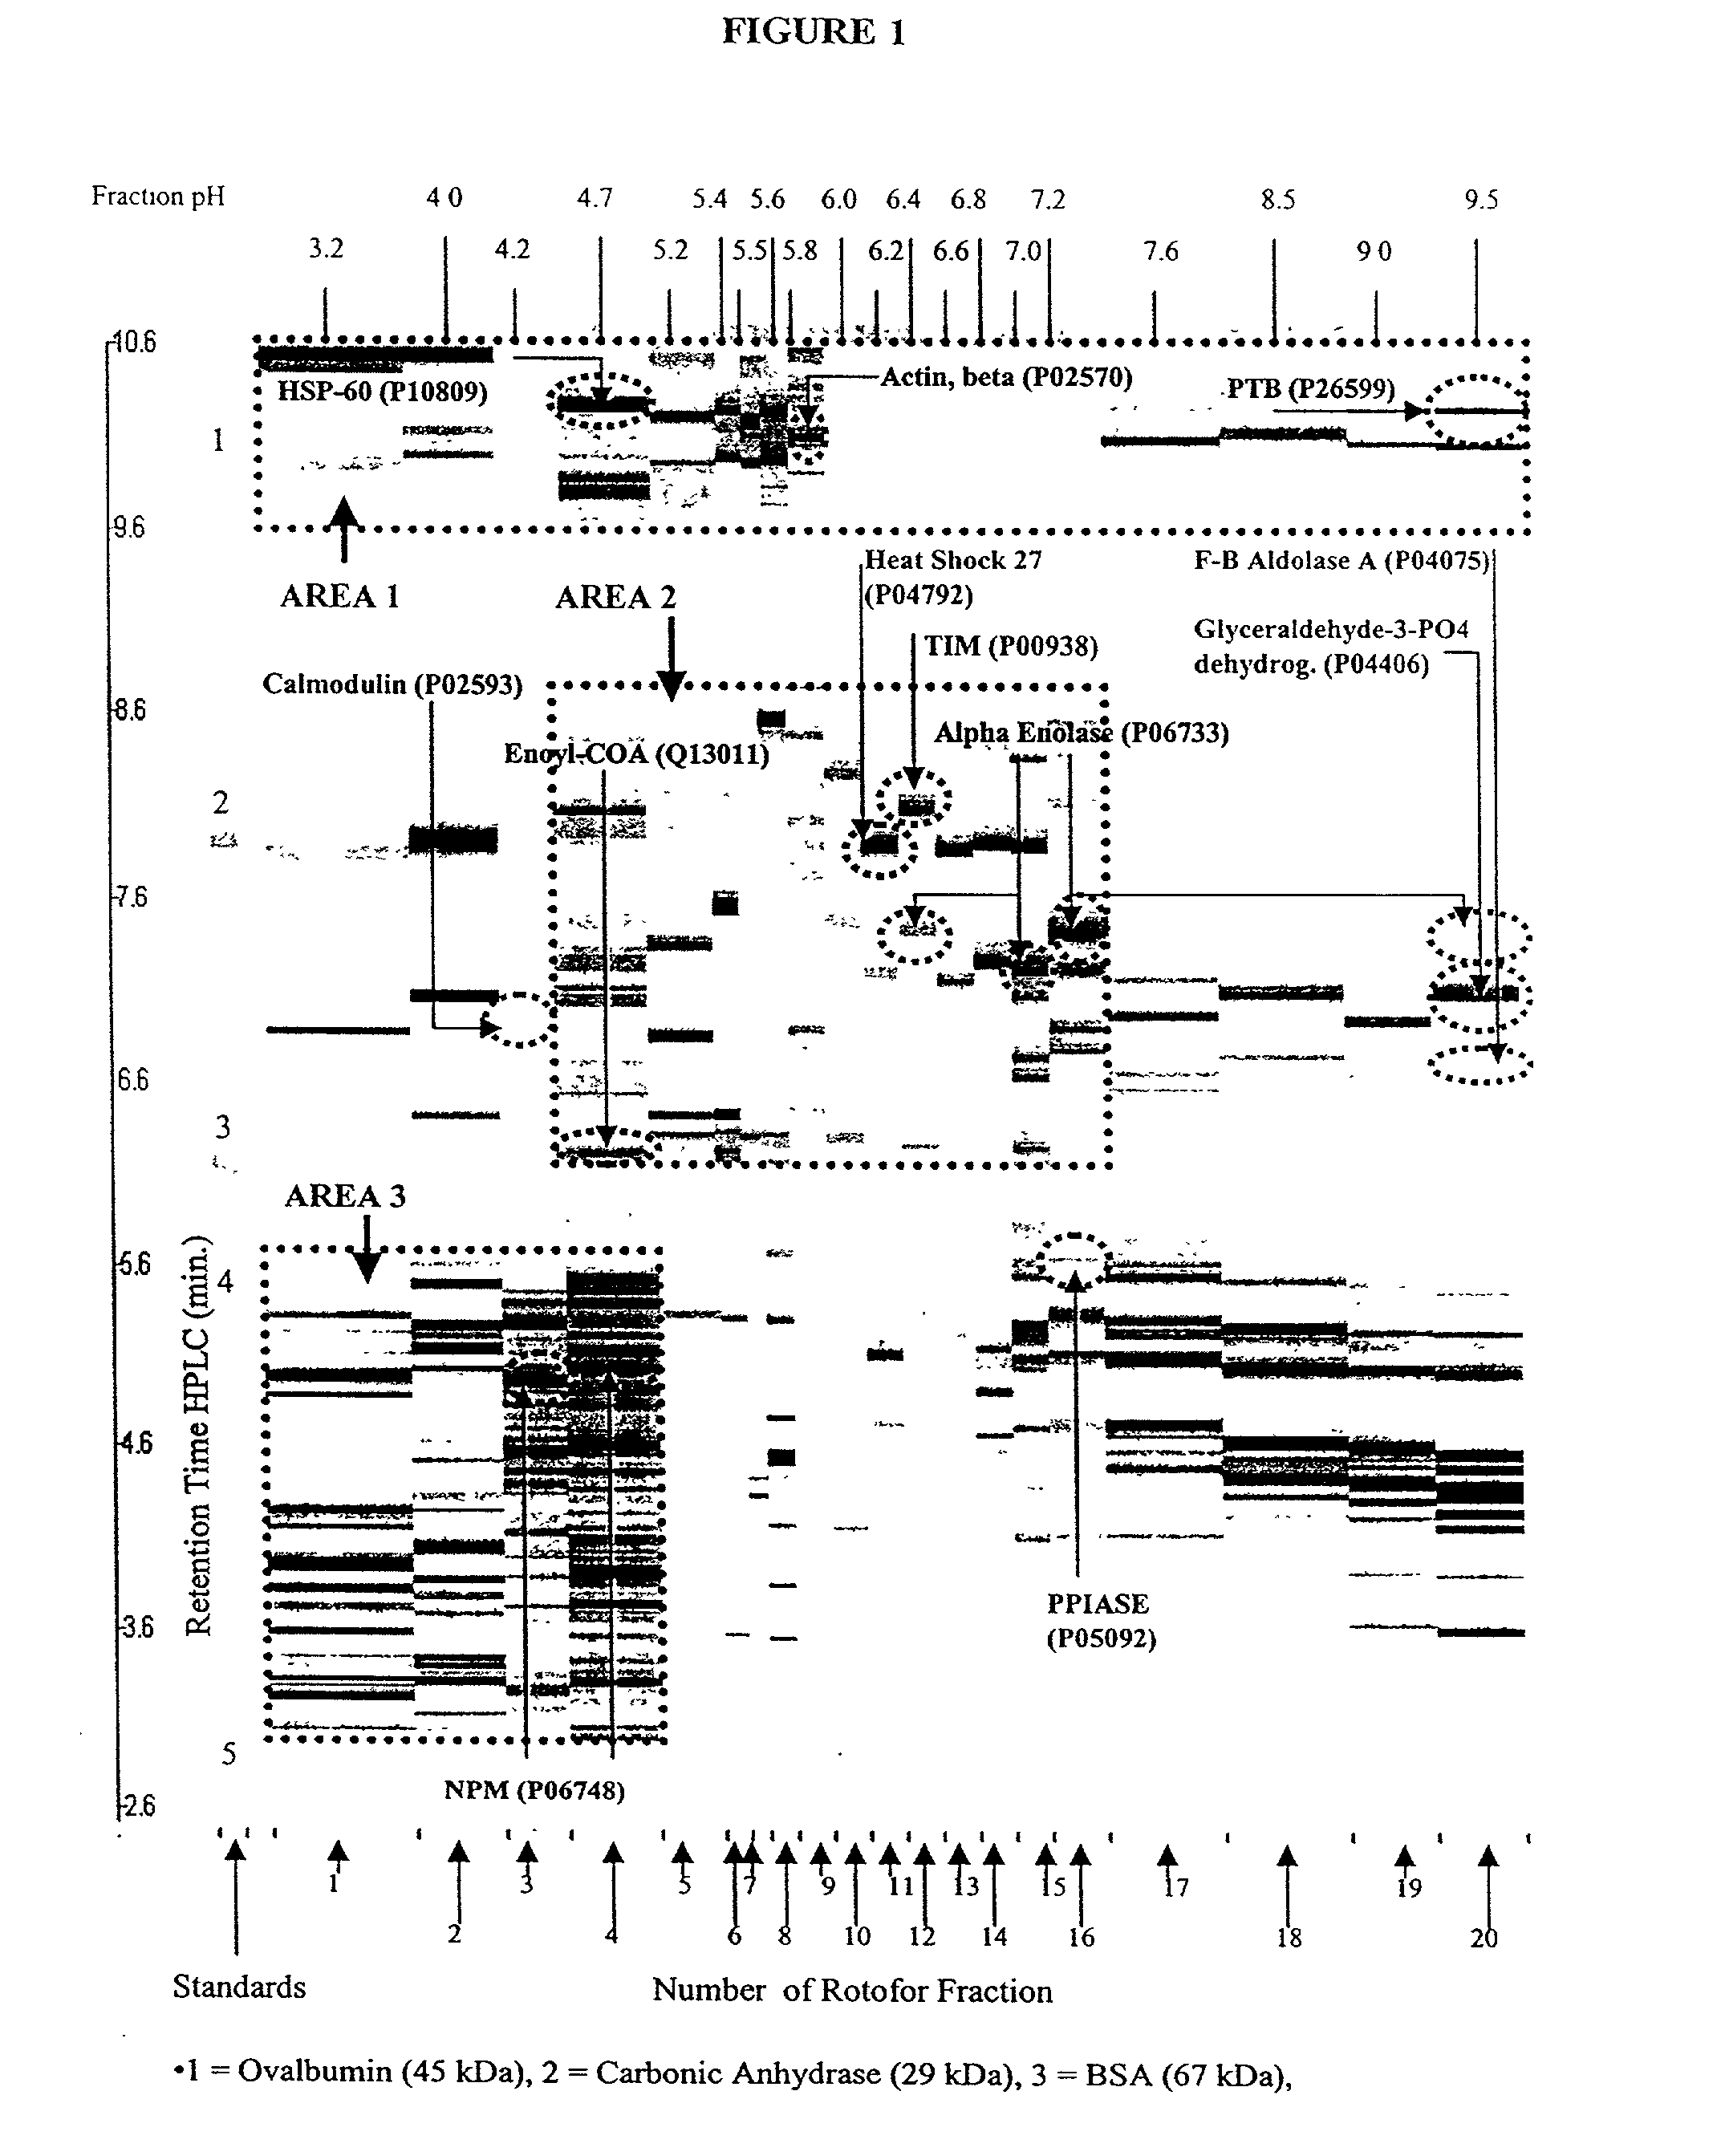
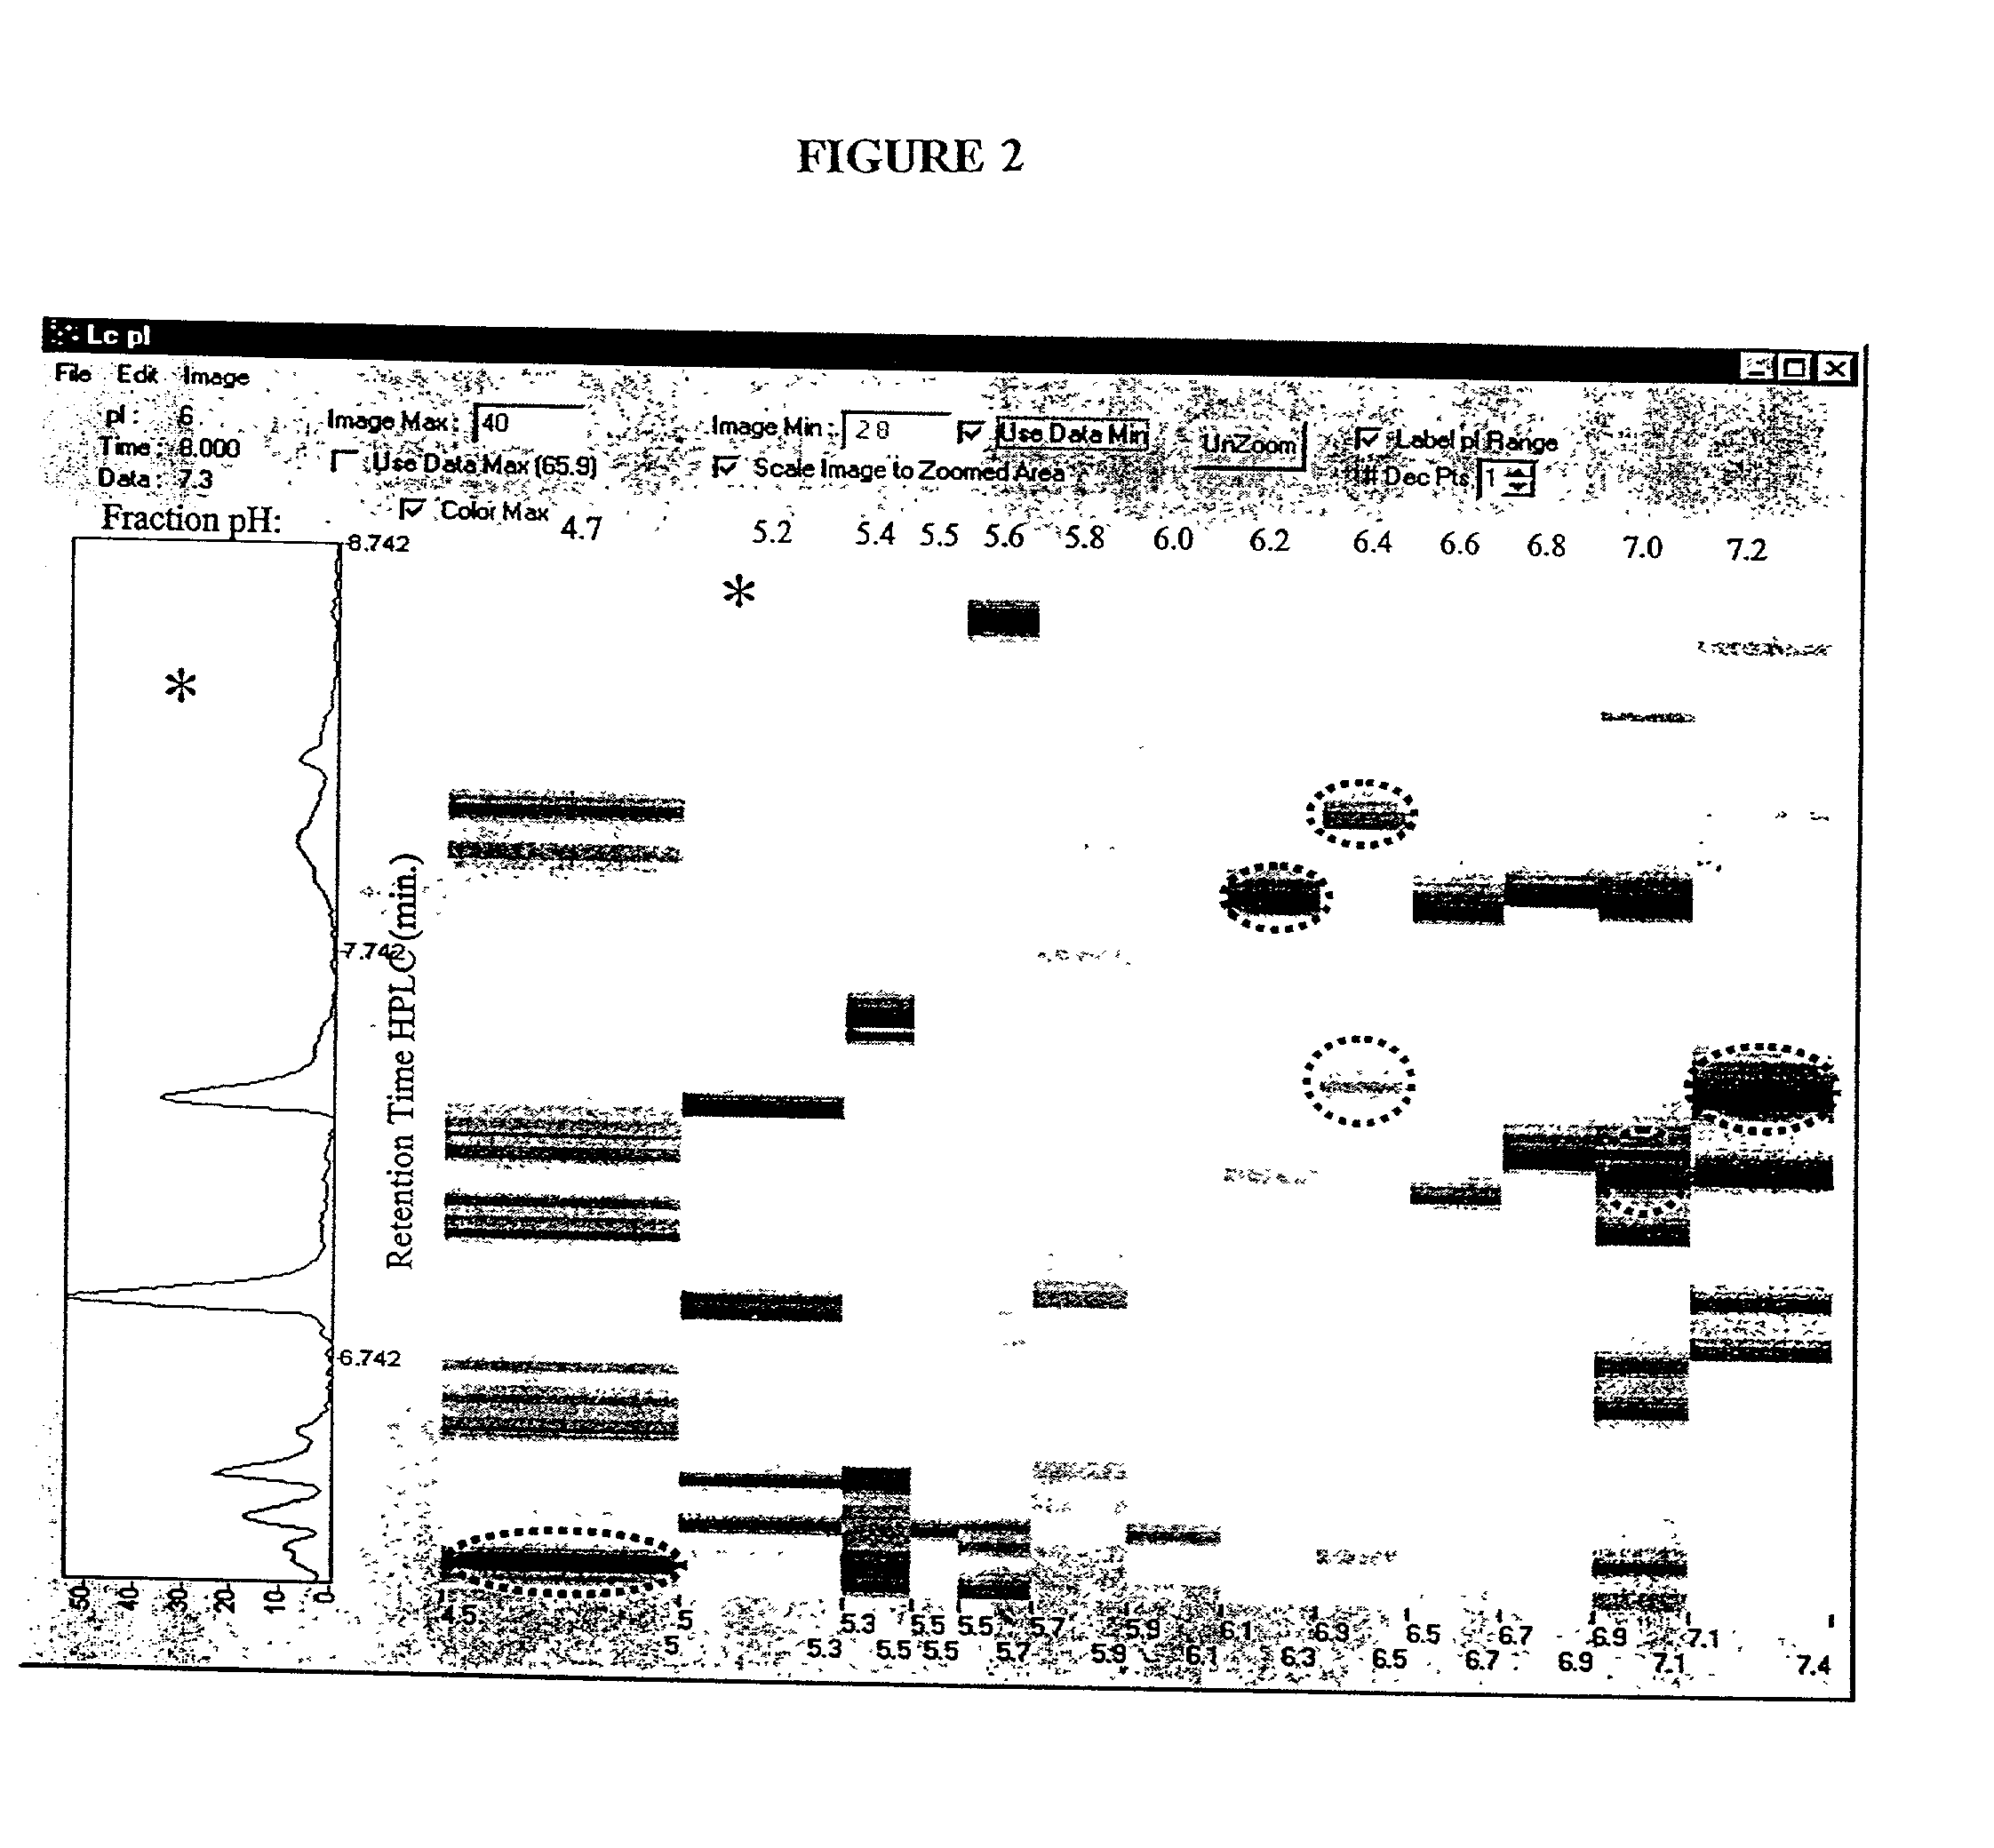
[0028] In one illustrative embodiment of the present invention proteins are separated according to their pI, using isoelectric focusing (IEF) in a Rotofor and according to their hydrophobicity and molecular weight using NP RP HPLC. This combined separation method is abbreviated IEF-NP RP HPLC. When coupled with mass spectrometry (MS) this technique becomes three-dimensional and allows for the creation of a protein map that tells the pI and the molecular weight of the proteins in question. This information can be plotted in an image that also depicts protein abundance. The end result is a high-resolution image showing a complex pattern of proteins separated by pI and molecular weight and indicating relative protein abundances. This image can be used to determine how the proteins in a given cell line or tissue may change due to some disease state, pharmaceutical treatment, natural or induced differentiation, or change in environmental conditions. The image allows the observer to determine changes in pI, molecular weight, and abundance of any protein in the image. When interfaced to MS the identity of any target protein may also be obtained via enzymatic digests and peptide mass map analyses. In addition, this technique has the advantage of very high loadability (e.g., 1 gram) such that the lower abundance proteins may be detected.
[0109] The methods and apparatuses of the present invention also offer an efficient system for combining with other analysis techniques to obtain a thorough characterization of a given cell, tissue, or the like. For example, the methods of the present invention may be used in conjunction with genetic profiling technologies (e.g., gene chip or hybridization based nucleic acid diagnostics) to provide a fuller understanding of the genes present in a sample, the expression level of the genes, and the presence of protein (e.g., active protein) associated with the sample.

Problems solved by technology

Many limitations of traditional 2-D PAGE arise from its use of the gel as the separation media.

Method used


Image

  • Protein mapping
  • Protein mapping
  • Protein mapping

Examples


example 2

[0114] 1-D Gel and SDS PAGE Separation

[0115] HEL cell proteins, resolved by Rotofor separation into discrete pI ranges, were further resolved according to their apparent molecular weight by SDS-PAGE. This procedure takes approximately 14 hours to complete. Samples of rotofor fractions were suspended in an equal volume of sample buffer (125 mM Tris (pH 6.8) containing 1% SDS, 10% glycerol, 1% dithiothreitol and bromophenol blue) and boiled for 5 min. They were then loaded onto 10% acrylamide gels. The samples were electrophoresed at 40 volts until the dye front reached the opposite end of the gel. The resolved proteins were visualized by silver staining. The gels were fixed overnight in 50% ethanol containing 5% glacial acetic acid, then washed successively (for 2 hours each) in 25% ethanol containing 5% glacial acetic acid, 5% glacial acetic acid, and 1% glacial acetic acid. The gels were impregnated with 0.2% silver nitrate for 25 min. and were developed in 3% sodium carbonate cont...

example 3

[0116] 2-D PAGE

[0117] In order to prepare protein extracts from the HEL cells, the harvested cell pellets were lysed by addition of three volumes of solubilization buffer consisting of 8 M urea, 2% NP-40, 2% carrier ampholytes (pH 3.5 to 10), 2% .beta.-mercaptoethanol and 10 mM PMSF, after which the buffer containing the cell extracts was transferred into microcentrifuge tubes and stored at -80.degree. C. until use.

[0118] Extracts of the cultured HEL cells were separated in two dimensions as previously described by Chen et al. (Chen et al., Rap. Comm. Mass Spec. 13:1907 [1999]) with some modifications as described below. Subsequent to cellular lysis in solubilization buffer, the cell lysates from approximately 2.5.times.10.sup.6 cells were applied to isoelectric focusing gels. Isoelectric focusing was conducted using pH 3.5 to 10 carrier ampholytes (Biorad) at 700 V for 16 h, followed by 1000 V for an additional 2 hours. The first dimension tube gel was soaked in a solution of 2 mg / ...

example 4

[0119] Rotofor Isoelectric Focusing

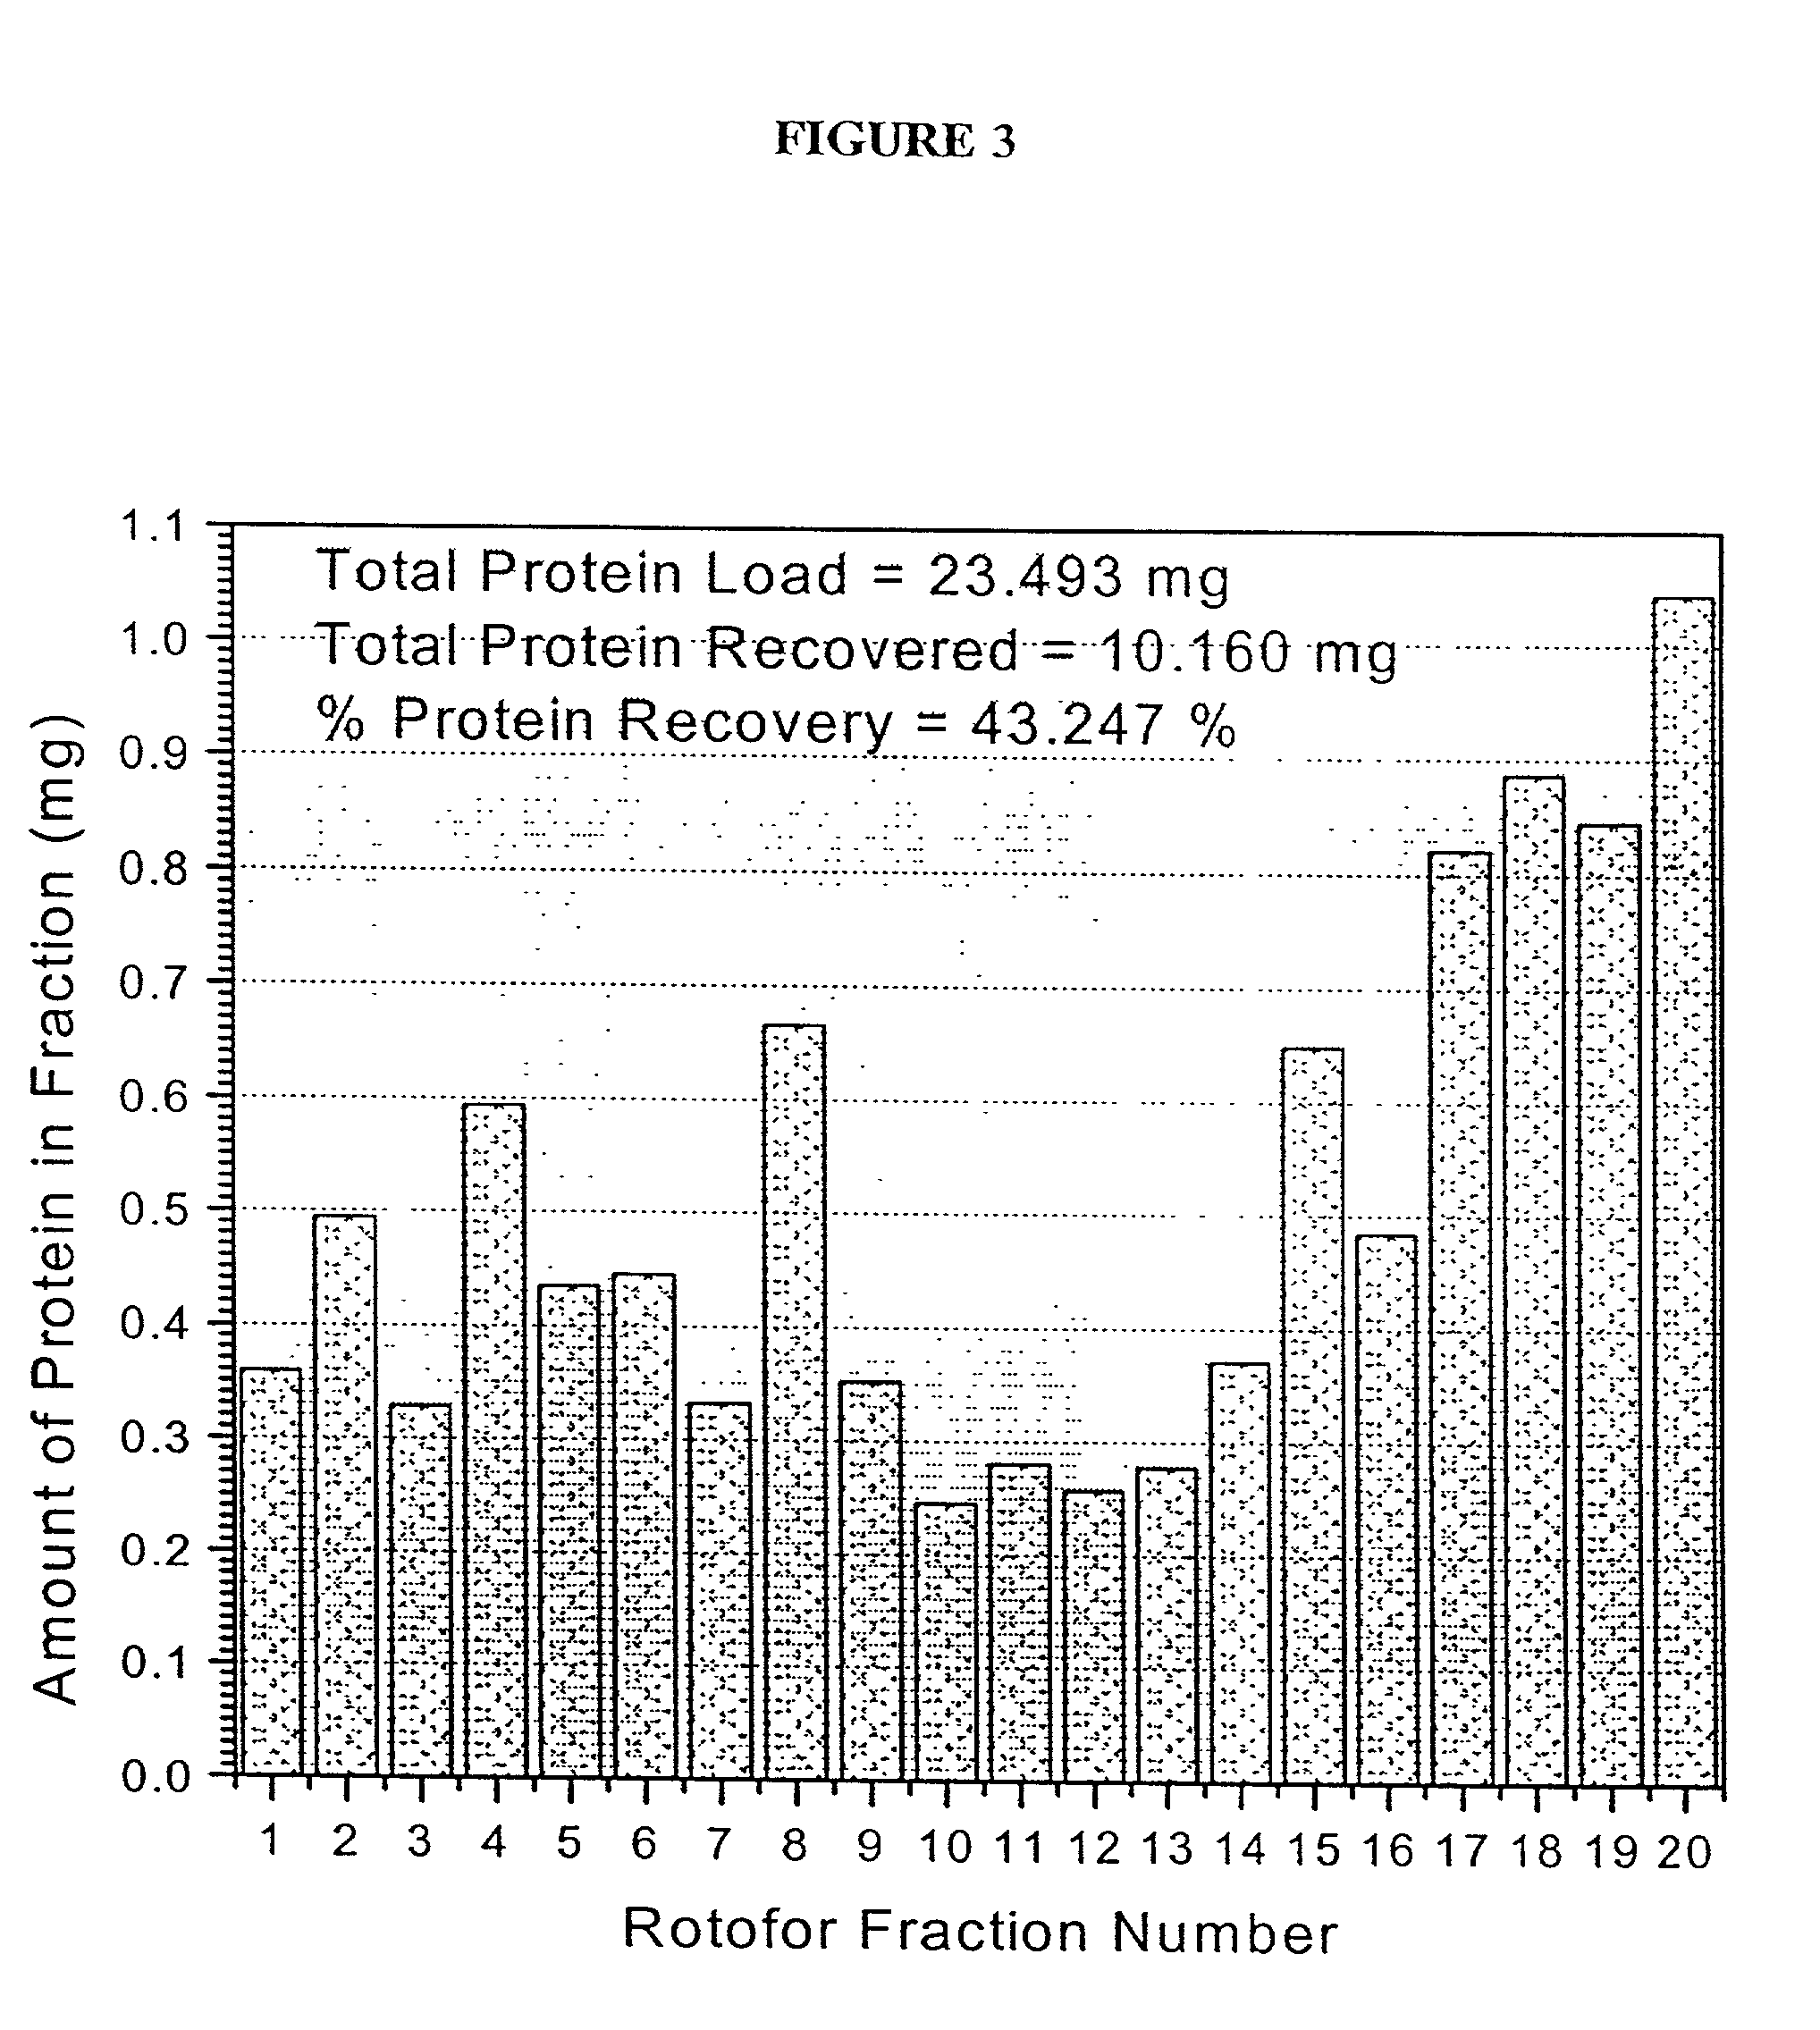
[0120] A preparative scale Rotofor (Biorad) was used in the first dimension separation. This device separated the proteins in liquid phase according to their pI, and is capable of being loaded with up to a gram of protein, with the total buffer volume being 55 mL. Alternatively, for analysis of smaller quantities of protein, a mini-Rotofor with a reduced volume can be used. These proteins were separated by isoelectric focusing over a 5 hour period where the separation temperature was 10.degree. C. and the separation buffer contained 0.1% n-octyl .beta.-D-galactopyranosi-de (OG) (Sigma), 8 M urea (ICN), 2% .beta.-mercaptoethanol (Biorad) and 2.5% Biolyte ampholytes, pH 3.5-10 (Biorad). The procedure used for running the Rotofor (Rotofor Purification System, Biorad) was of the standard procedure described in the manual from Biorad as modified herein. The 20 fractions contained in the Rotofor were collected simultaneously, into separate vials using a ...


PUM

PropertyMeasurementUnit
Massaaaaaaaaaa
Lengthaaaaaaaaaa
Lengthaaaaaaaaaa

Abstract

The present invention relates to multiphase protein separation methods capable of resolving large numbers of cellular proteins. The methods of the present invention provide protein profile maps for imaging and comparing protein expression patterns. The present invention provides alternatives to traditional 2-D gel separation methods for the screening of protein profiles.

Description

[0001] This application claims priority benefit of U.S. Provisional Appln. Ser. No. 60 / 180,911, filed Feb. 08, 2000, herein incorporated by reference in its entirety.[0003] The present invention relates to multiphase protein separation methods capable of resolving large numbers of cellular proteins. The methods of the present invention provide protein profile maps for imaging and comparing protein expression patterns. The present invention provides alternatives to traditional 2-D gel separation methods for the screening of protein profiles.[0004] As the nucleic acid sequence of a number of genomes, including the human genome, becomes available, there is an increasing need to interpret this wealth of information. While the availability of nucleic acid sequence allows for the prediction and identification of genes, it does not explain the expression patterns of the proteins produced from these genes. The genome does not describe the dynamic processes on the protein level. For example,...

Claims


Application Information

Patent Timeline
IPC IPC(8): C07K1/36G01N30/02G01N30/46G01N30/52G01N30/72G01N30/82G01N30/86G01N30/88G01N33/68
CPCC07K1/36G01N27/44773G01N30/02G01N30/461G01N30/7233G01N30/82G01N30/8651G01N2030/8831G01N33/6803G01N2030/027G01N2030/524G01N2030/8813B01D15/325
Inventor LUBMAN, DAVID M.BARDER, TIMOTHY J.WALL, DANIEL B.PARUS, STEPHEN J.KACHMAN, MAUREEN T.CHONG, BATHSHEBA E.HANASH, SAMIR M.MISEK, DAVID E.HINDERER, ROBERT
Owner RGT UNIV OF MICHIGAN
Learn More