A system and method for chemical ionization mass spectrometry analysis of ammonia in atmospheres with different humidity
A chemical ionization and mass spectrometry analysis technology, applied in the field of atmospheric pressure chemical ionization mass spectrometry analysis system, can solve the problems of background signal increase, sensitivity decrease, ammonia signal intensity instability, etc., to eliminate quantitative influence and improve sensitivity
- Summary
- Abstract
- Description
- Claims
- Application Information
AI Technical Summary
Problems solved by technology
Method used
Image
Examples
Embodiment 1
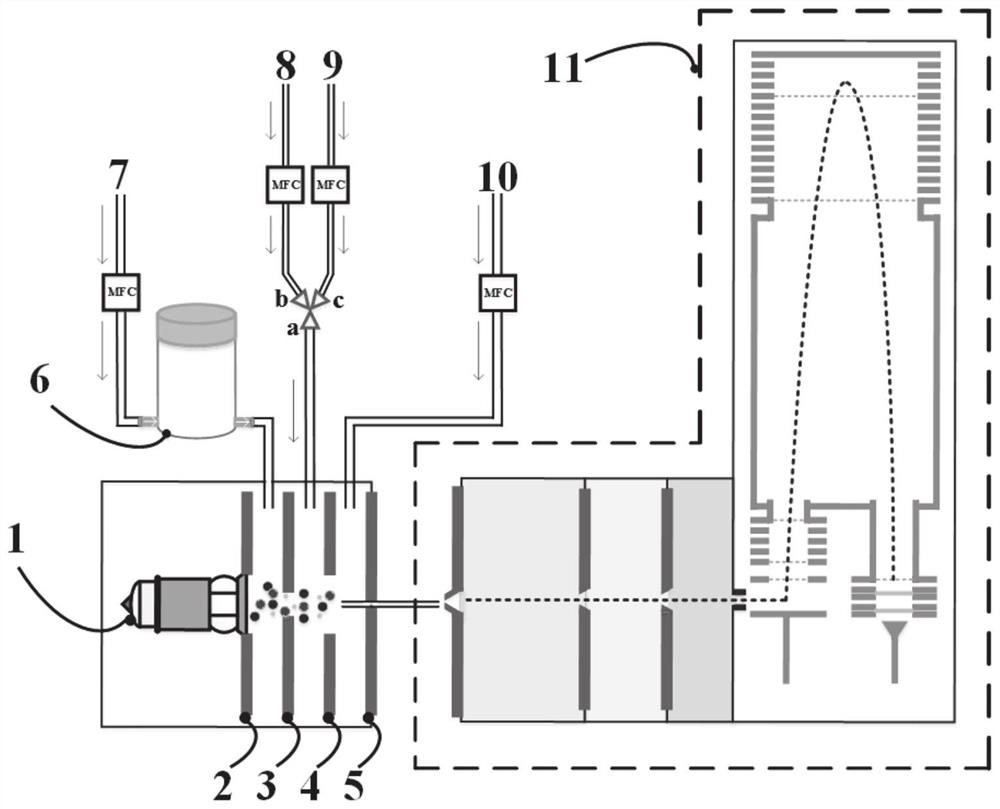
[0052] like figure 1 As shown, the method involves an atmospheric pressure chemical ionization mass spectrometer for the detection of atmospheric ammonia of varying humidity. In the background / atmospheric ammonia sample detection, it is introduced into the chemical ionization zone between the curtain electrode and the transmission electrode at a flow rate of 400mL / min under the condition of known humidity, and the acetone reagent is purged with high-purity nitrogen at a flow rate of 100mL / min. Enter the acetone protonation zone between the repelling electrode and the curtain electrode, where the acetone is irradiated by a vacuum ultraviolet lamp to generate photoionization, and the dry nitrogen gas enters the dilution zone between the transfer electrode and the capillary electrode at a flow rate of 1200 mL / min for dilution. Finally, it enters the mass spectrometer for detection. Each background / sample detection was performed three times, and each detection time was 60s. The a...
Embodiment 2
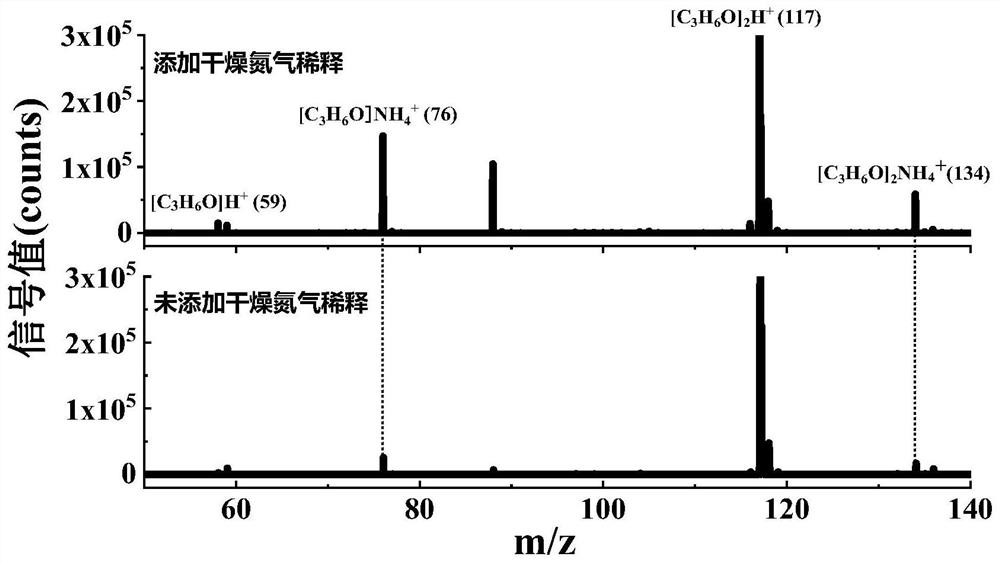
[0054] The 50ppb ammonia sample under 90% humidity was tested without adding dry nitrogen for dilution and adding dry nitrogen for dilution. After adding dry nitrogen for dilution, the peak signal of the characteristic peak m / z 76 of ammonia gas increased by 3.75 times.
Embodiment 3
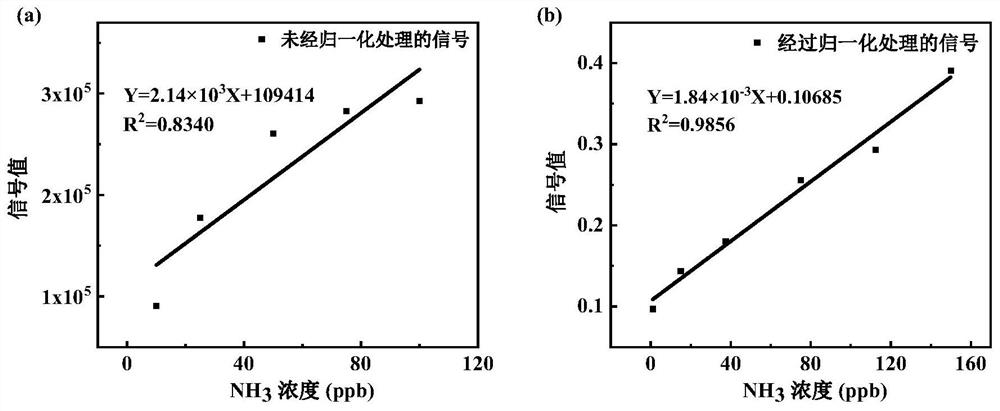
[0056] A concentration gradient of 1–150 ppb was prepared using a 5 ppm ammonia standard gas at zero humidity for standard curve drawing, and the signal was normalized to m / z 76 peak signal detected with ammonia sample minus m / z when background detected 76 peak signal, the difference is then divided by the acetone reagent ion m / z 117 peak signal, the obtained signal value is the final normalized signal, and the standard curve is drawn with this signal as the final signal, and normalized with the unprocessed signal The normalized standard curve was compared, and the linear fitting degree of the standard curve after signal normalization (R 2 = 0.9856) is significantly better than the standard curve fit without signal normalization (R 2 =0.8340).
PUM
 Abstract
Description
Claims
Application Information
 - R&D
- Intellectual Property
- Life Sciences
- Materials
- Tech Scout
- Unparalleled Data Quality
- Higher Quality Content
- 60% Fewer Hallucinations
Browse by: Latest US Patents, China's latest patents, Technical Efficacy Thesaurus, Application Domain, Technology Topic, Popular Technical Reports.
© 2025 PatSnap. All rights reserved.Legal|Privacy policy|Modern Slavery Act Transparency Statement|Sitemap|About US| Contact US: help@patsnap.com


