
Method for measuring similarity of multivariate meteorological data in phenological period of rice based on form and mixed gradient dynamic time warping

A technology of dynamic time warping and meteorological data, applied in the field of agro-meteorological data analysis, it can solve the problems of sudden change in rainfall, mismatch of similarity matching "peak-valley", single meteorological index, etc.

Pending Publication Date: 2019-11-26
NANJING AGRICULTURAL UNIVERSITY
View PDF0 Cites 1 Cited by
  • Summary
  • Abstract
  • Description
  • Claims
  • Application Information

AI Technical Summary

Problems solved by technology

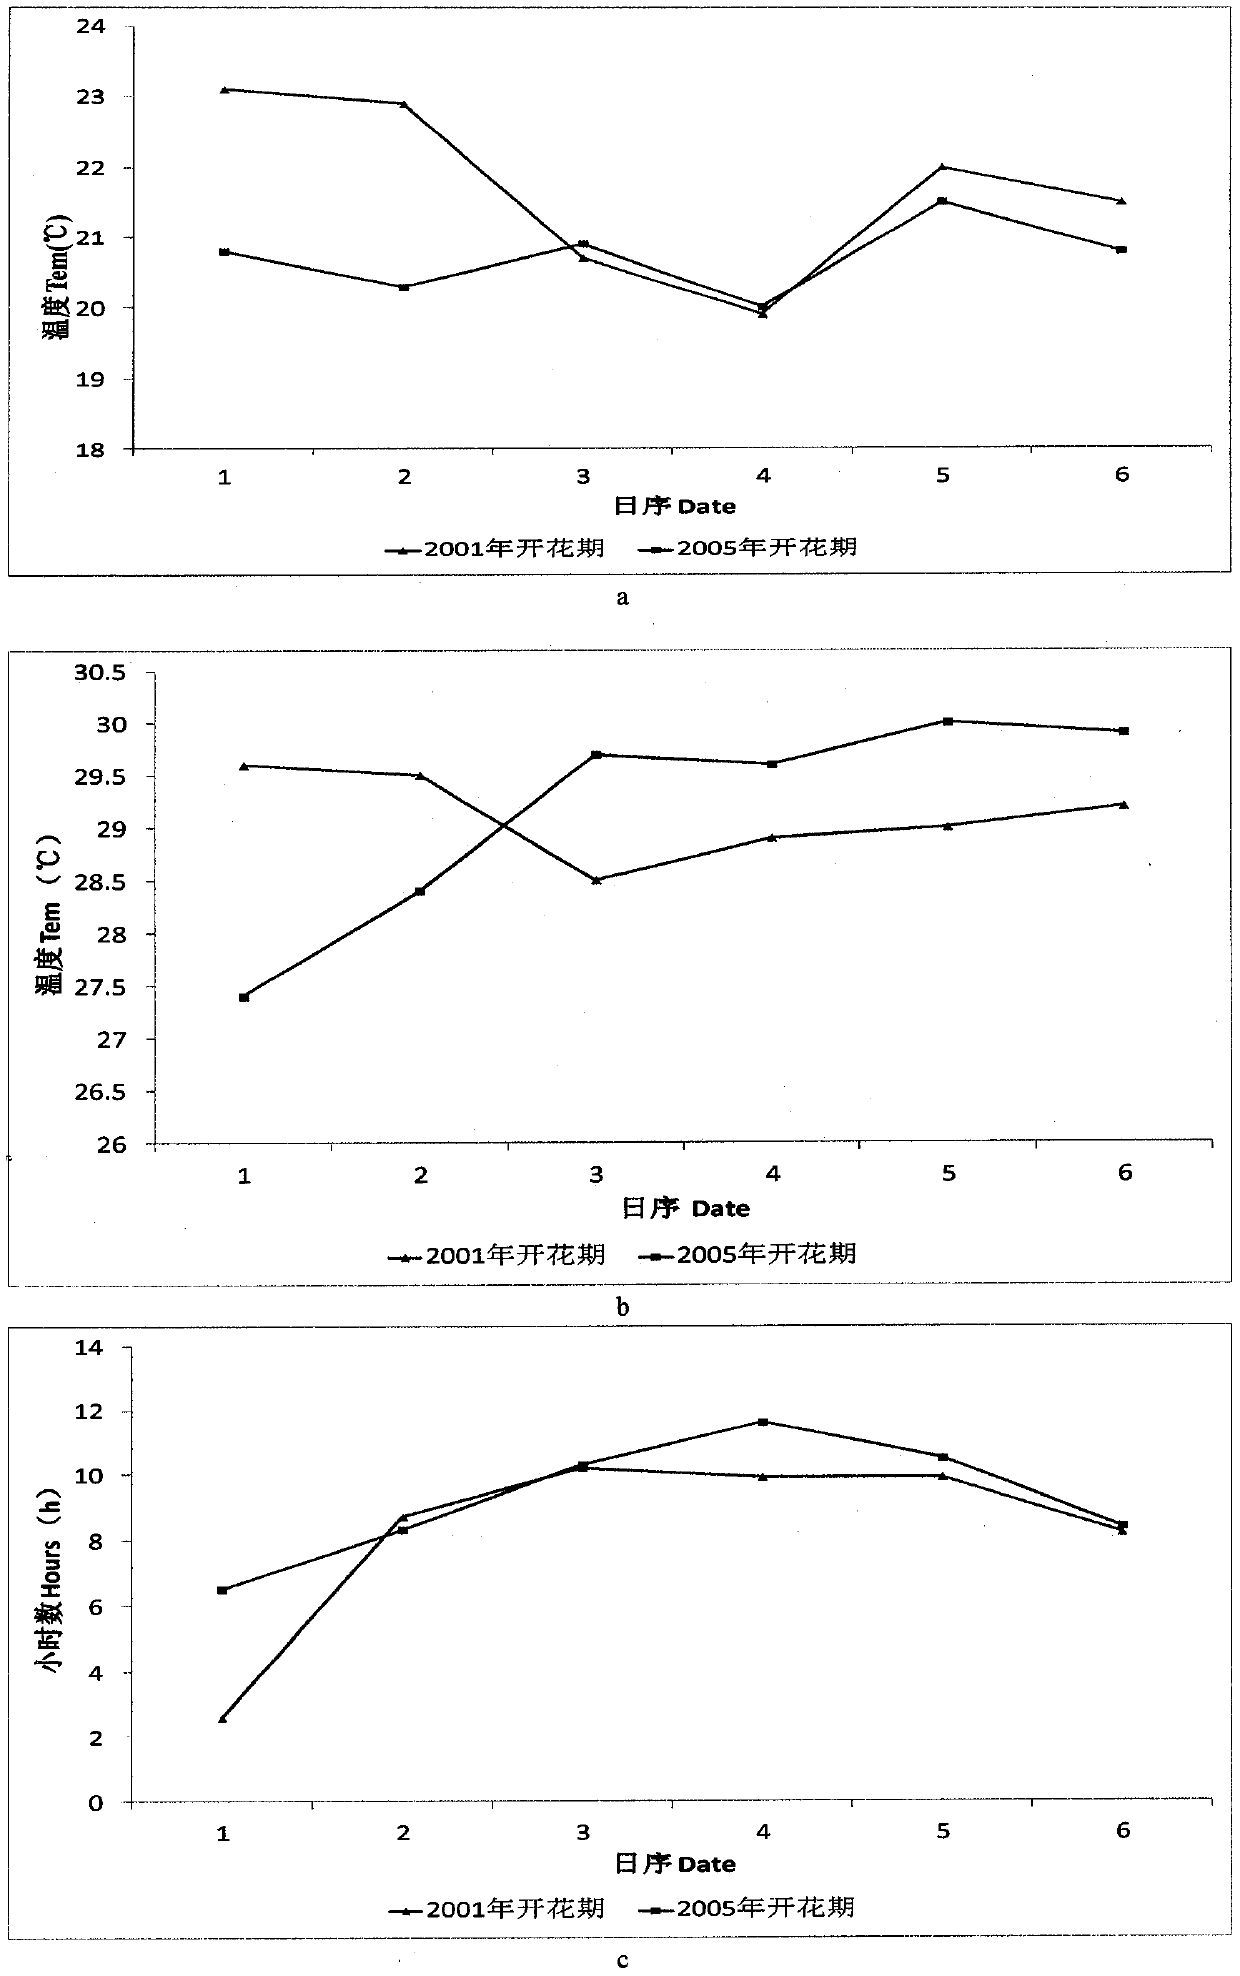
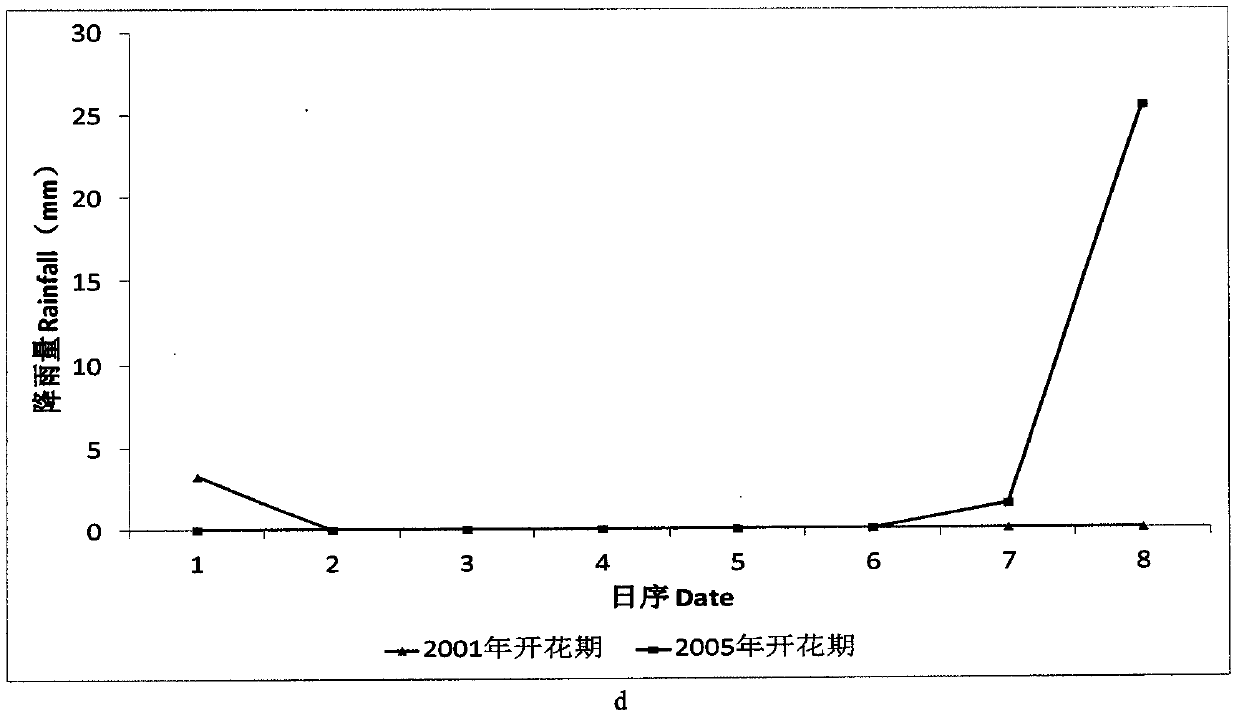
However, for the problem of similarity measurement of agricultural meteorological data, this method often ignores the problem of abnormal sequence data fluctuations caused by outliers in meteorological data, such as extreme high temperature, extreme low temperature and cumulative sudden change in rainfall, etc., making the process of similarity matching There is a "peak-to-valley" mismatch
[0007] Due to the abnormality of the sequence shape fluctuation curve caused by extreme high temperature, extreme low temperature, sudden change in rainfall, etc. in agricultural meteorological data, such as the dislocation of peaks and valleys, the usual Euclidean distance cannot solve the data distance measurement with similar phenomena.
To this end, the dynamic time warping measurement algorithm is introduced. The dynamic time warping algorithm is a method that solves the problem that the original similar sample sequence data cannot be similarly matched due to the linear drift on the time scale through uneven distortion or bending. However, Dynamic time warping can usually only solve the measurement of a single meteorological index. As analyzed above, in the real world, meteorological data are all multi-index data, and there are local obvious mutation values ​​in different variable dimensions.

Method used


Image

  • Method for measuring similarity of multivariate meteorological data in phenological period of rice based on form and mixed gradient dynamic time warping
  • Method for measuring similarity of multivariate meteorological data in phenological period of rice based on form and mixed gradient dynamic time warping
  • Method for measuring similarity of multivariate meteorological data in phenological period of rice based on form and mixed gradient dynamic time warping

Examples


Embodiment approach

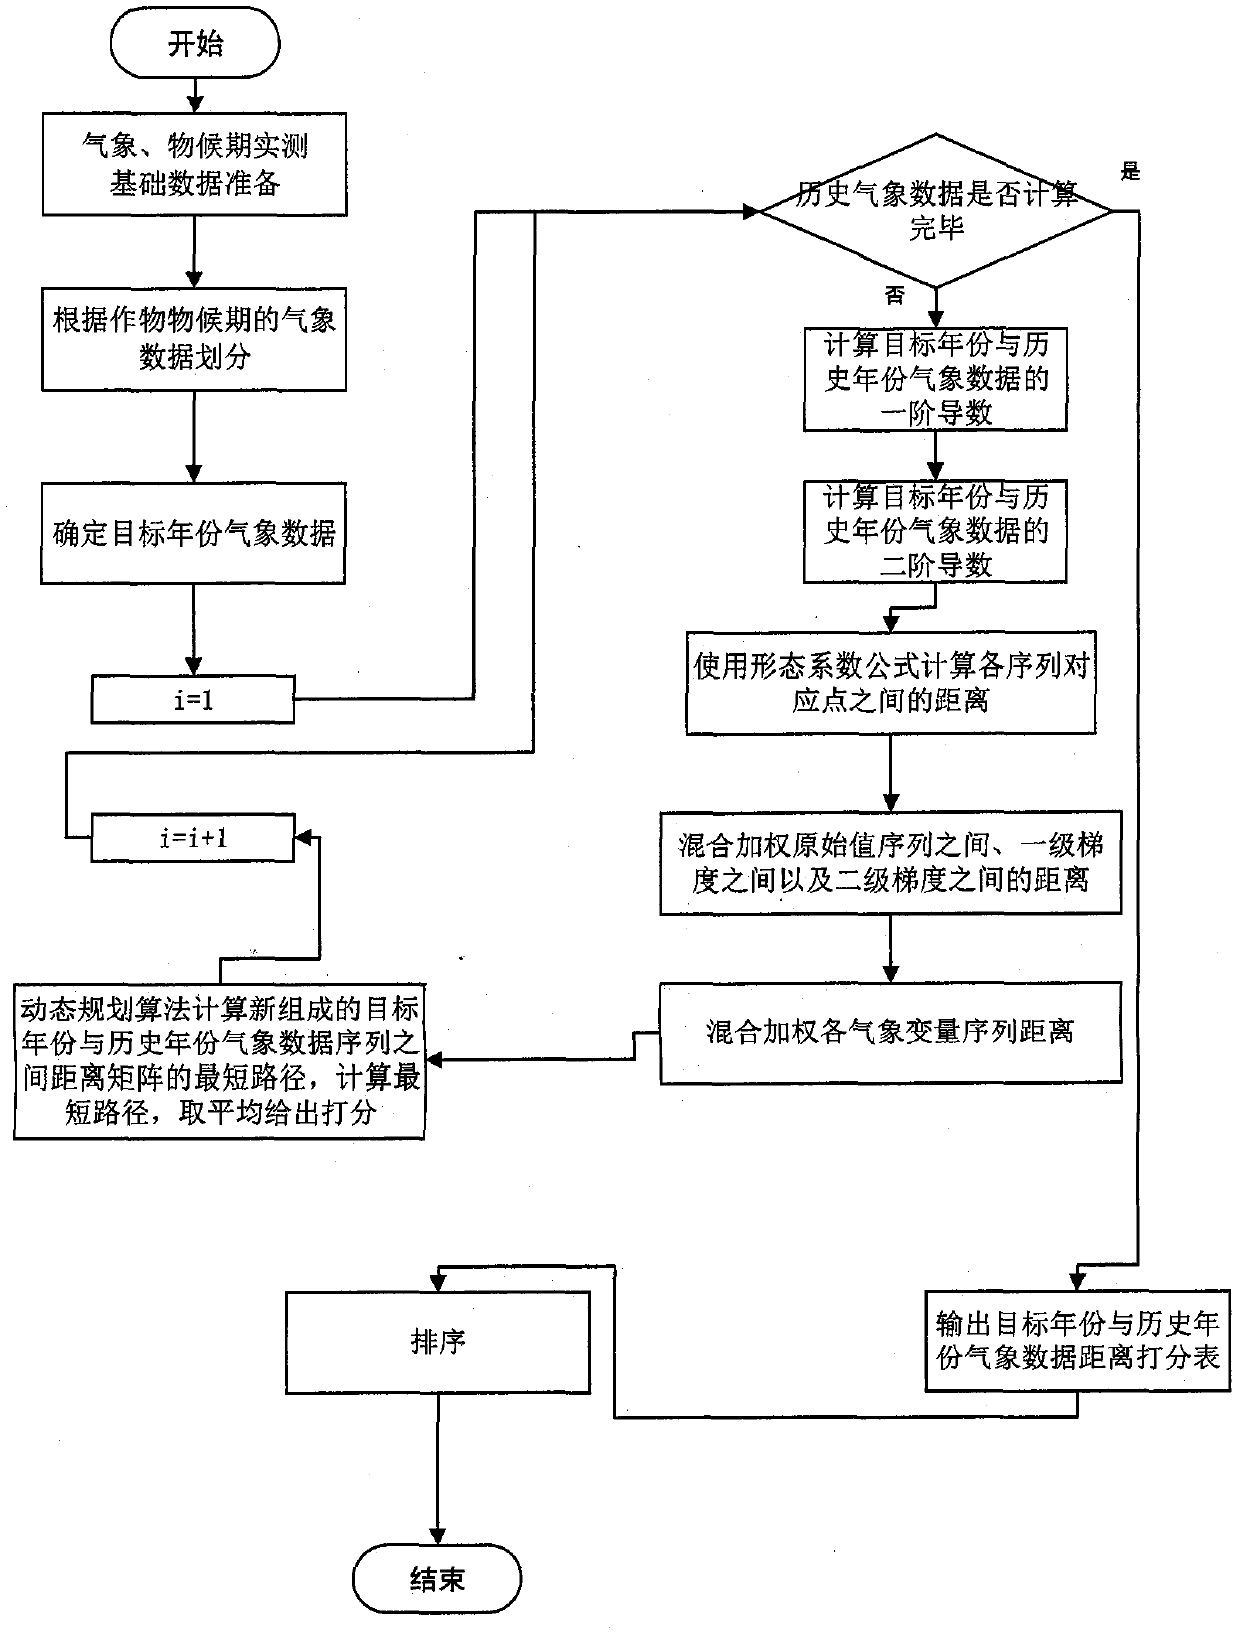
[0074] Step 1: Drive Data Preparation

[0075] Select historical meteorological data provided by the National Meteorological Data Sharing Center, including daily maximum temperature (°C), daily minimum temperature (°C), rainfall (mm), sunshine hours (h), and historical phenological periods of designated varieties in corresponding regions The date records the data, and the description of the data used in the test is shown in Table 1 and Table 2.

[0076] Table 1 Detailed table of experimental meteorological data

[0077]

[0078] Table 2 Data table of recording date of heading stage of Wuyu japonica

[0079]

[0080] Step 2: Division according to meteorological data of crop phenology


PUM


Abstract

The invention provides a method for similarity analysis of multivariable rice meteorological sequences in a key phenological period, and belongs to the field of agricultural meteorological data mining. The method aims at solving the problem of wrong matching of sequence wave crests and wave troughs caused by temperature maximum and minimum abnormal values, sudden rainfall and the like in meteorological sequences and the problem of linear drift caused by inconsistent phenological periods. A dynamic time warping algorithm is introduced, and the design of the form and the mixed gradient is added,so that the measurement accuracy and convenience are improved, and meanwhile, the influence of the meteorological data change trend and abnormal values on crops is emphasized. The method comprises the following specific steps: segmenting a meteorological sequence according to phenological period data of rice; calculating a meteorological sequence first-order derivative and a meteorological sequence second-order derivative; scoring based on the original sequence of the morphological constant factor and the dynamic morphological penalty function and the distance of each grade of gradient sequence; weighting and mixing the distances between the original sequence and the gradients; weighting the distances of the meteorological variable sequences to form distances among the multivariate meteorological sequences; and sorting according to the distance metric scores.

Description

[0001] 1. Technical field [0002] The invention belongs to the field of agricultural meteorological data analysis, and is a cross field in which knowledge in the field of agricultural meteorology is combined with multivariate time series similarity matching analysis algorithms. It involves similarity analysis of non-linear, continuous and multivariate agricultural meteorological time series data in key phenological periods, and can be used for similarity analysis of meteorological data in different phenological periods during the whole growth period of rice. [0003] 2. Background technology [0004] Meteorological indicators, such as maximum temperature, minimum temperature, rainfall, sunshine hours, and irradiance, have a great impact on the growth of agricultural crops, and historical meteorological data containing these indicators can usually reflect the climate and climate of a certain area for a period of time. For the meteorological environment conditions of crops, the ...

Claims


Application Information

Patent Timeline
Patent Type & Authority Applications(China)
IPC IPC(8): G06Q10/06G06Q50/02
CPCG06Q10/06393G06Q50/02
Inventor 姜海燕杨乐
Owner NANJING AGRICULTURAL UNIVERSITY
Learn More