Chemical abnormal causality analysis and graphic display method based on time sequence fluctuation association
A causal analysis and graphic display technology, applied in the direction of instruments, electrical digital data processing, hardware monitoring, etc., can solve the problems of alarm flooding, low accuracy rate, and large calculation amount, and achieve high accuracy rate, less calculation amount, and calculation amount small effect
- Summary
- Abstract
- Description
- Claims
- Application Information
AI Technical Summary
Problems solved by technology
Method used
Image
Examples
Embodiment 1
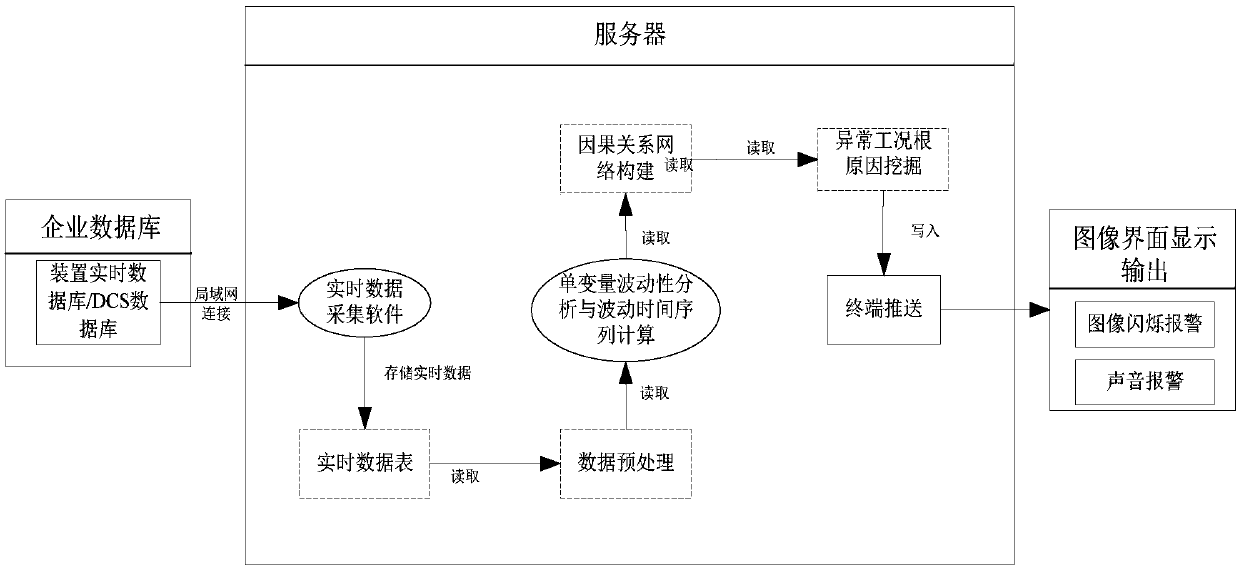
[0020] Depend on figure 1 As shown, a chemical abnormality causal analysis and graphic display method based on time series fluctuation correlation, including real-time collection platform construction of device data, data preprocessing, univariate volatility analysis and fluctuation time series calculation, causality based on fluctuation correlation degree Links such as network construction, root cause mining of abnormal working conditions, and image interface display and output.
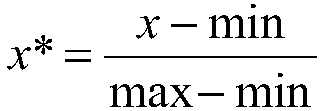
[0021] Real-time data acquisition platform construction: According to the data acquisition interface provided by the enterprise (the sampling frequency in the real-time database can reach 1 time / minute or 2 times / minute, and the data frequency collected from the DCS system using the OPC DA specification can reach 1 time / second ), using VC++ programming to implement an OPC DA server framework, collect real-time data from the control system of the device or enterprise real-time database, refresh the r...
Embodiment 2
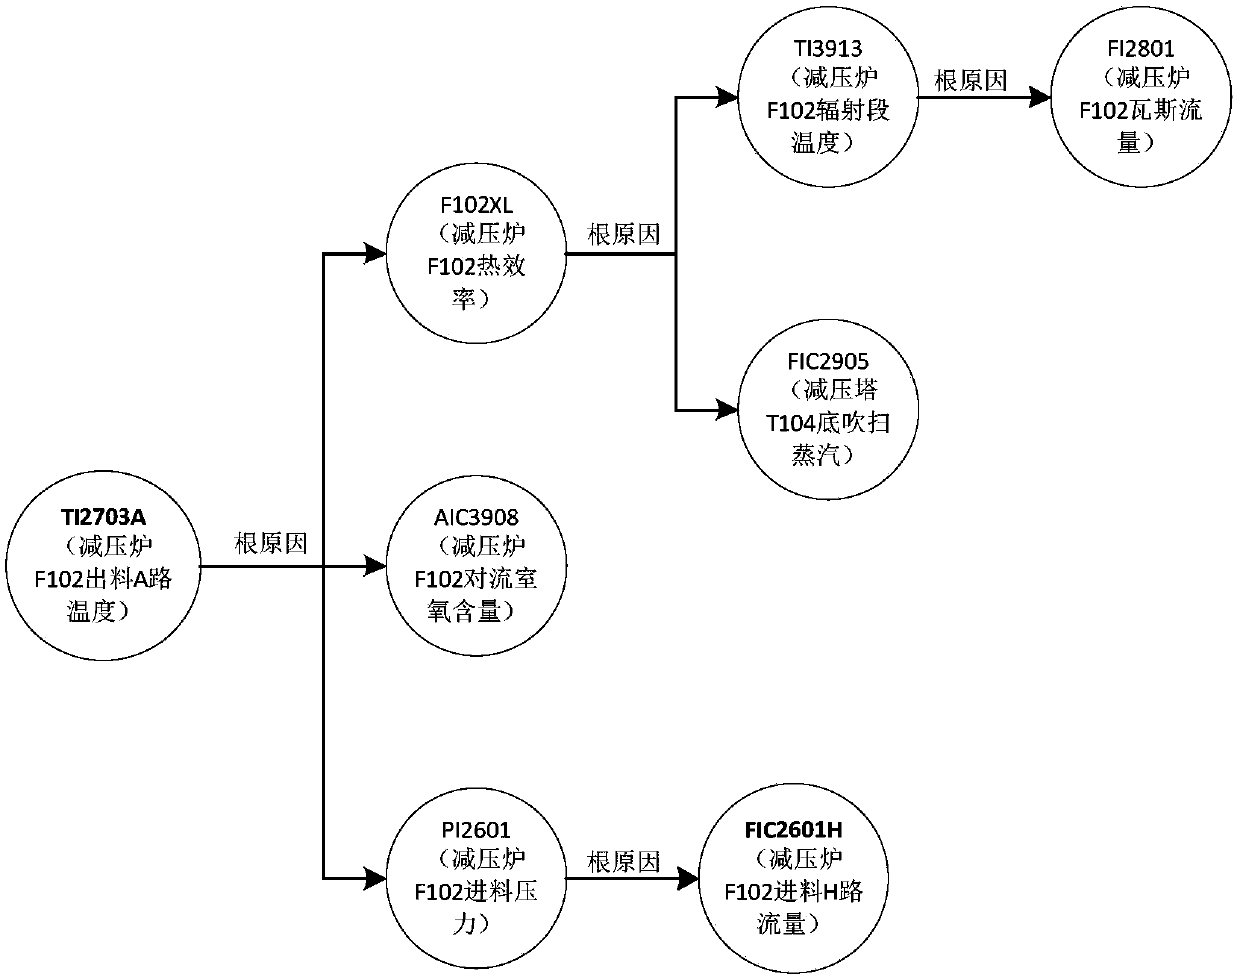
[0028]Graphical interface display output: Alarm points are displayed in the form of nodes, and their root cause paths are also displayed, fluctuation variables are displayed in the form of nodes, and causal relationships are displayed in the form of arrows. If there are multiple fluctuations in the root cause of an alarm in the current period node, then merge different root cause paths at this alarm node, and finally form a tree structure display.
[0029] exist figure 2 Among them, after the variable TI2703A (the temperature of the discharge path A of the vacuum furnace F102 in an atmospheric and vacuum device) alarmed, according to the correlation analysis of time series fluctuations, there are three causes of this variable: F102XL (thermal efficiency of the vacuum furnace F102), AIC3908 ( Oxygen content in convection chamber of decompression furnace F102), PI2601 (feed pressure of decompression furnace F102); there are two root causes of variable F102XL: TI3913 (temperatur...
Embodiment 3
[0031] By analyzing the actual device operation data, the root cause alarm results are obtained (see Table 1). The source of the data is the operation data of the atmospheric and vacuum equipment of a refining and chemical company from November 1 to November 4, 2016, and the sampling frequency is 2 times / minute. For example, in the first alarm bit number "FIC2601A" in Table 1, the variable generates a high alarm at time 4714, that is, its operating value exceeds the high alarm line, and then record its alarm time. In order to find the root cause of the alarm, according to the method introduced in this patent, find the fluctuation moments of all variables in the device, take "FIC2601A" as the result variable, and other variables as the cause variable, and calculate the membership of "FIC2601A" and other variables When both the membership degree and the confidence degree exceed the threshold, it is considered that the variable has a causal relationship with "FIC2601A", so two ro...
PUM
 Abstract
Description
Claims
Application Information
 - R&D Engineer
- R&D Manager
- IP Professional
- Industry Leading Data Capabilities
- Powerful AI technology
- Patent DNA Extraction
Browse by: Latest US Patents, China's latest patents, Technical Efficacy Thesaurus, Application Domain, Technology Topic, Popular Technical Reports.
© 2024 PatSnap. All rights reserved.Legal|Privacy policy|Modern Slavery Act Transparency Statement|Sitemap|About US| Contact US: help@patsnap.com


