
PM2.5 deep learning inversion method combining remote sensing data and social perception data

A technology of perception data and remote sensing data, applied in the field of remote sensing image processing and information application, can solve the problems of complex realization, insufficient influencing factors, single satellite remote sensing data social perception data, etc., achieve the effect of simplifying operation and overcoming difficult matching problems

Inactive Publication Date: 2019-09-27
WUHAN UNIV
View PDF3 Cites 5 Cited by
  • Summary
  • Abstract
  • Description
  • Claims
  • Application Information

AI Technical Summary

Problems solved by technology

[0003] At present, PM2.5 concentration inversion methods mainly include physical and chemical model simulation method and statistical model method. The former relies on the input of many model parameters and is complicated to realize; while the technology of statistical model method to estimate PM2.5 concentration relies on its high precision and easy implementation. The advantages are widely used
There are two main deficiencies in the existing related technical methods: on the one hand, insufficient consideration of influencing factors, relatively simple use of satellite remote sensing data or only social perception data, and few applications combining the two; Insufficient relationship interpretation, especially in the face of the combination of multi-source heterogeneous big data, the feature extraction and information mining capabilities of shallow models are insufficient

Method used


Image

  • PM2.5 deep learning inversion method combining remote sensing data and social perception data
  • PM2.5 deep learning inversion method combining remote sensing data and social perception data
  • PM2.5 deep learning inversion method combining remote sensing data and social perception data

Examples


Embodiment Construction

[0029] In order to facilitate those of ordinary skill in the art to understand and implement the present invention, the present invention will be described in further detail below in conjunction with the accompanying drawings and embodiments. It should be understood that the implementation examples described here are only used to illustrate and explain the present invention, and are not intended to limit this invention.

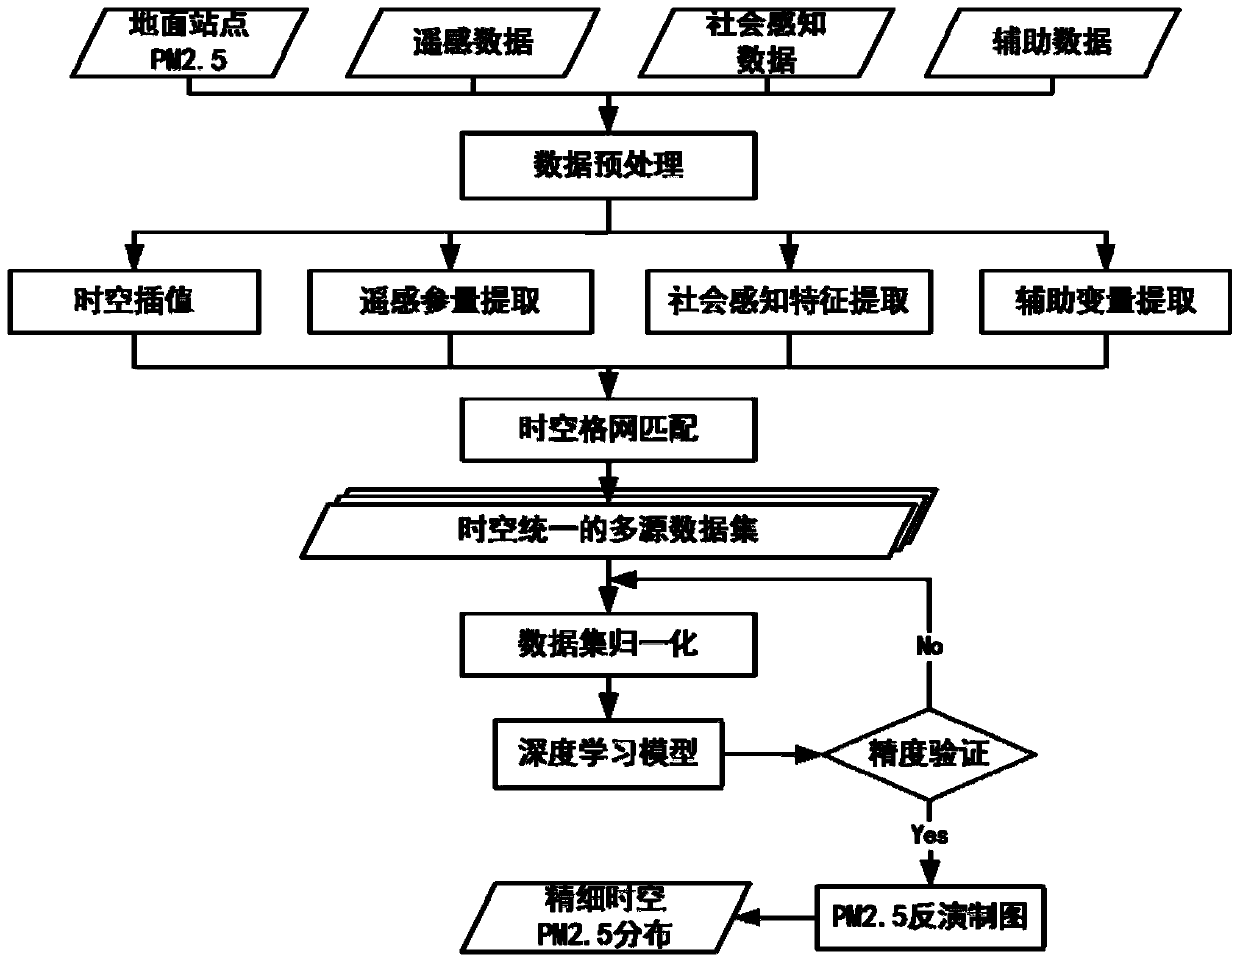
[0030] There are many factors that affect the concentration of PM2.5 and the relationship is complex, which leads to the challenge of inverting the fine temporal and spatial distribution of PM2.5. The natural characteristics of remote sensing data and the socioeconomic attributes of social perception data can be used to fully mine useful information based on deep learning, so as to realize the inversion of fine spatiotemporal PM2.5 distribution.

[0031] please see figure 1 A method for inversion of PM2.5 deep learning combining remote sensing data and socia...


PUM


Abstract

The invention discloses a PM2.5 deep learning inversion method combining the remote sensing data and the social perception data. The PM2.5 deep learning inversion method comprises the steps of preprocessing the PM2.5 data of a ground station point, the remote sensing data, the social perception data and the auxiliary data; performing feature variable extraction and calculation on the multi-source data by using a geoscience space statistics and analysis method and a remote sensing information processing means; carrying out space-time matching on the multi-source data in a gridding mode, taking a grid with a ground station point true value as a training sample, and generating a multi-source data set with uniform space and time; normalizing the grid data set with the site PM2.5 true value, then inputting the grid data set into a deep learning model for training, and inverting the unknown grid PM2.5 concentration through the model after the grid data set passes the verification; and carrying out fine PM2.5 space-time distribution mapping on an inversion result. According to the method, the multi-source information can be effectively mined by using a deep learning technology, the defect of a traditional statistical model in a nonlinear problem is overcome, and the higher inversion precision and the finer space-time PM2.5 distribution are obtained.

Description

technical field [0001] The invention belongs to the field of remote sensing image processing and information application, and relates to a method for obtaining PM2.5 concentration, in particular to a method for retrieving fine spatiotemporal PM2.5 concentration based on deep learning combined with remote sensing data and social perception data. Background technique [0002] Fine spatio-temporal PM2.5 concentration distribution plays an important role in environmental monitoring and health assessment applications. The distribution of existing stations is sparse and uneven, and station observations cannot meet the application requirements. Obtaining PM2.5 temporal and spatial continuous distribution data has attracted wide attention. The causes of PM2.5 are complex and change rapidly, and its concentration is affected by natural and human factors at the same time, and there is a complex nonlinear relationship between each factor and PM2.5. Therefore, how to effectively combin...

Claims


Application Information

Patent Timeline
IPC IPC(8): G06F17/18G01N15/06
CPCG01N15/06G06F17/18
Inventor 沈焕锋周曼李同文袁强强
Owner WUHAN UNIV
Learn More