A high-dimensional vector data visualization method and system based on double-layer anchor graph projection optimization

An anchor point and vector technology, applied in the field of big data visualization, can solve problems such as different optimization methods, wrong visual layout structure, poor parallelism, etc.

Active Publication Date: 2021-02-19
ZHEJIANG UNIV
View PDF8 Cites 0 Cited by
  • Summary
  • Abstract
  • Description
  • Claims
  • Application Information

AI Technical Summary

Problems solved by technology

In 2014, Tang Jian et al. proposed the LargeVis algorithm in the article "Visualizing Large-scale and High-dimensional Data" published at the International conference on world wide web conference, which uses data modeling similar to t-SNE The idea is to use the student t-distribution in low-dimensional space to fit the Gaussian distribution in high-dimensional space, but a different optimization method is adopted, that is, only the neighbor relationship between the data point to be investigated and its nearest neighbors is kept at a low In dimensional space, this kind of neighbor relationship is represented by an approximate nearest neighbor graph
However, none of these three algorithms can be implemented directly on the GPU
The reason is that its algorithmic logic is complex and its parallelism is poor, so it cannot support the visualization of large-scale data
In addition, neither BH-t-SNE nor LargeVis can well retain the global layout structure information of the data, so they often show wrong visual layout structures, which makes people misunderstand the structural information in the data
UMAP can only efficiently project data that satisfies the assumption of a uniform distribution in a low-dimensional manifold space and preserve global information

Method used


Image

  • A high-dimensional vector data visualization method and system based on double-layer anchor graph projection optimization
  • A high-dimensional vector data visualization method and system based on double-layer anchor graph projection optimization
  • A high-dimensional vector data visualization method and system based on double-layer anchor graph projection optimization

Examples


Embodiment Construction

[0064] The present invention will be further described in detail below with reference to the accompanying drawings and embodiments. It should be noted that the following embodiments are intended to facilitate the understanding of the present invention, but do not limit it in any way.

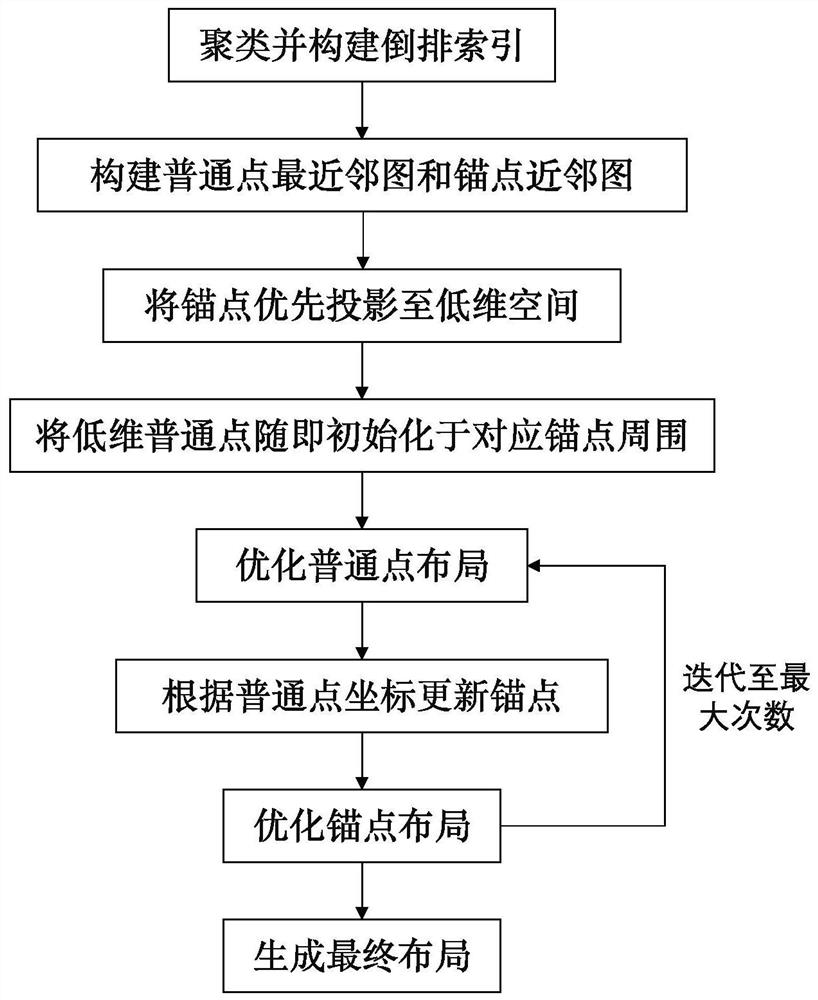
[0065] Such as figure 1 As shown, a high-dimensional vector data visualization method based on two-layer anchor graph projection optimization, the specific process is as follows:

[0066] (1) Carry out K-means clustering on the original high-dimensional spatial data set D, and use the obtained cluster center as the anchor point set A, and the number of clusters is k c In practical applications, we set it to the default value of 1000; assign a unique number within 0-999 to each anchor point. At the same time, for large-scale data (data sets with more than 5 million data points), we do not cluster on the full set, but sample a subset of no more than 1 million points, and the number of clustering ...


PUM


Abstract

The invention discloses a high-dimensional vector data visualization method and system based on double-layer anchor point graph projection optimization, and the method comprises the steps: (1) carrying out the K-means clustering of an original high-dimensional vector data set D, and an obtained clustering center serving as an anchor point set A; (2) establishing an inverted index of the high-dimensional vector data according to the anchor point set A; (3) establishing an approximate kD neighbor graph GD of the data set D by using the inverted index; (4) for each point d in the data set D, violently searching c anchor points closest to the point d, and updating the c anchor points as neighbors of the point d to a neighbor graph GD; (5) constructing a kA neighbor graph GA on the anchor pointset A in a violent retrieval mode; and (6) based on the high-dimensional spatial data structure information represented by GD and GA, generating a low-dimensional spatial visual projection by using adouble-layer projection optimization algorithm. By means of the method and the system, global macrostructure information and local microstructure information in a high-dimensional space can be reserved together, and high-quality layout information is obtained.

Description

technical field [0001] The present invention relates to the field of big data visualization, in particular to a high-dimensional vector data visualization method and system based on double-layer anchor graph projection optimization. Background technique [0002] In the era of big data, data generated by information systems such as the Internet has grown exponentially. Due to the unprecedentedly large scale of data and the extremely fast update speed, mining the laws and patterns contained in big data has surpassed the scope of manpower. In particular, a large number of current machine learning and data mining algorithms often represent discrete multimodal data as continuous real number vectors in a high-dimensional space, which is more difficult for humans to directly understand. The high-dimensional vector data visualization technology is the key technology to solve this problem, which is the main research content of the present invention. High-dimensional vector data vis...

Claims


Application Information

Patent Timeline
Patent Type & Authority Patents(China)
IPC IPC(8): G06F16/22G06F16/26G06F16/28
CPCG06F16/2228G06F16/26G06F16/285
Inventor 付聪张永辉蔡登
Owner ZHEJIANG UNIV
Why Eureka
Try Eureka