A method to distinguish between changes in emissions in different regions and changes in meteorological conditions on PM 2.5 Method of Concentration Effect

A technology for meteorological conditions and regions, applied in particle suspension analysis, suspension and porous material analysis, measurement devices, etc. Small amount, short time-consuming, good simulation effect

Active Publication Date: 2020-05-19
NANJING UNIV
View PDF6 Cites 0 Cited by
  • Summary
  • Abstract
  • Description
  • Claims
  • Application Information

AI Technical Summary

Problems solved by technology

[0004] However, the limitation of this method is that it is impossible to clearly give the specific area where the emission activities and changes in meteorological conditions occur. Changes in field emissions / meteorological conditions lead to PM 2.5 The concentration changes, which in turn causes a change in the transport contribution to the local

Method used


Image

  • A method to distinguish between changes in emissions in different regions and changes in meteorological conditions on PM  <sub>2.5</sub> Method of Concentration Effect
  • A method to distinguish between changes in emissions in different regions and changes in meteorological conditions on PM  <sub>2.5</sub> Method of Concentration Effect
  • A method to distinguish between changes in emissions in different regions and changes in meteorological conditions on PM  <sub>2.5</sub> Method of Concentration Effect

Examples


Embodiment

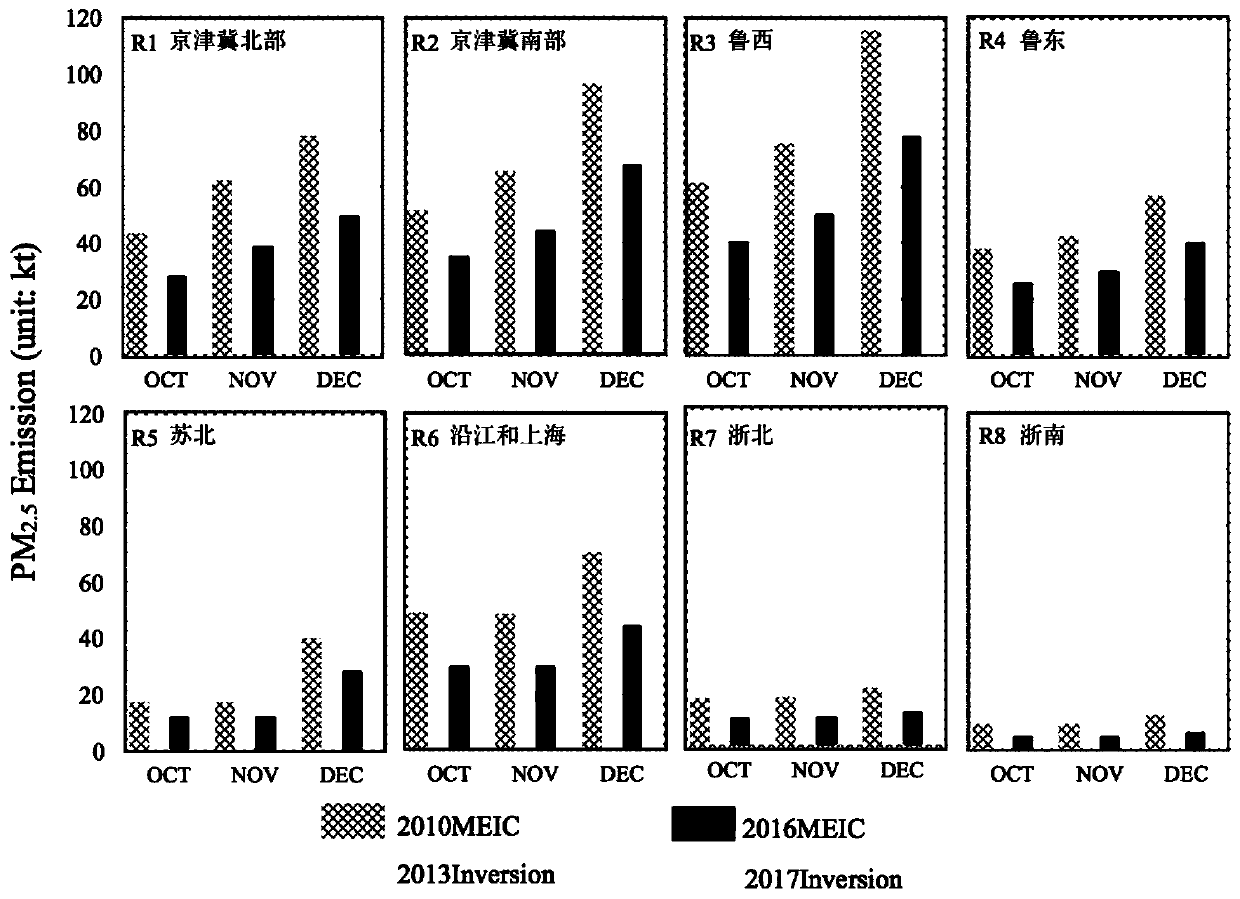
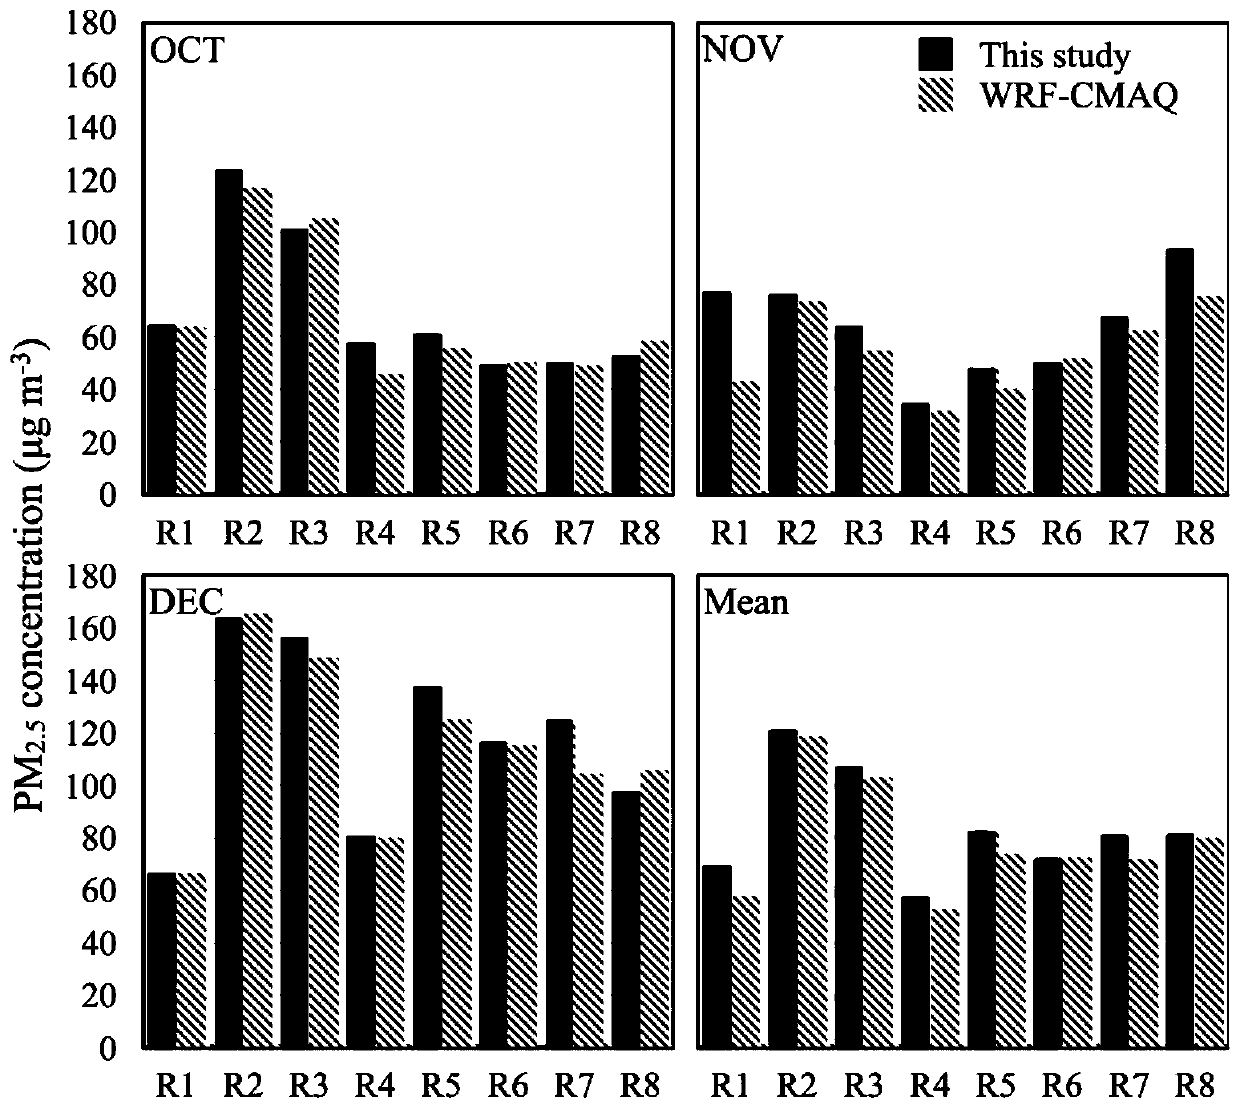
[0049] 1) Research period: October-December in 2013 and October-December in 2017, the research scope is the central and eastern regions of China (18°-54° north latitude, 92°-136° east longitude).

[0050] 2) Research area division:

[0051] First, the Chinese region (without considering Hong Kong, Macao, and Taiwan) is divided into four major regions: key regions, the Northern Region (NOR), the Southern Region (SOU), the Qinghai-Tibet Plateau region, and the Xinjiang Autonomous Region. The northern region and the southern region are divided according to provincial boundaries; the Qinghai-Tibet Plateau region and the Xinjiang Autonomous Region have small anthropogenic emissions and few measuring stations, so the contribution of emissions from these regions to other regions of China is not considered.

[0052] For the key regions in China that this study focuses on, it is divided into 8 regions, from north to south: R1, the northern part of Beijing-Tianjin-Hebei, including Zhang...


PUM


Abstract

The invention discloses a method for distinguishing influences of emission changes and meteorological condition changes of different areas on PM2.5 concentration. The method comprises the following steps that WRF simulation meteorological data within preset time are collected; on the basis of the WRF simulated meteorological data and the partition mark information, calculating the air mass footprint through an LPDM model, and establishing a transmission matrix; calculating an inverse matrix of the transmission matrix, and calculating the regional emission according to the observation data within the predetermined time; verifying the accuracy of the regional emission by adopting inverted PM2.5 emission and simulated PM2.5 emission; calculating PM2.5 concentration matrixes at different moments by adopting the verified regional emission matrix and transmission matrix, and calculating the influence quantity of emission change on concentration change and the influence quantity of transmission change on concentration change. According to the method, the influences of emission changes and meteorological condition changes of different areas on PM2.5 concentration changes can be rapidly distinguished, and compared with other methods, the method is small in calculated amount, short in consumed time and good in simulation effect.

Description

technical field [0001] The invention belongs to the environmental protection technology, in particular to an environmental protection monitoring technology. Background technique [0002] With the rapid development of industrialization and urbanization, air pollution, especially the smog in recent years, that is, PM2.5, has an increasing impact on human society, posing a serious threat to people's life and production. As a result, the public is increasingly concerned about ambient air quality. Based on the serious situation of air pollution, the Ministry of Environmental Protection requires all localities to carry out air pollution source analysis, air quality forecasting business and capacity building. At the same time, when heavy pollution occurs, it is urgent to analyze the source of air pollution, analyze and identify the key areas of pollution contribution, and provide a basis for pollution control. At this time, a stable and rapid air quality traceability forecast mod...

Claims


Application Information

Patent Timeline
Patent Type & Authority Patents(China)
IPC IPC(8): G01N15/06
Inventor 江飞蔡哲
Owner NANJING UNIV
Why Eureka
Try Eureka