


Quick Research
Generate reliable direction feasibility study reports for your R&D in just a few steps.

Technical Q&A
Discover and master advanced knowledge NOW. Basics, ideas, possibilities, all at once.

Find Solutions
As an expert in R&D theories, this can generate solutions to your technical problems instantly.

Evaluate Feasibility
Analyze your overall solution with one click, know your potential R&D risks in advance.

Monitor Landscape
Get weekly tech updates, stay abreast of the latest tech innovations and key insights.
A method for quantitative analysis of blue light hazard and rhythmic effect based on light source color temperature
A technology of blue light hazards and quantitative analysis, applied in the direction of testing optical performance, etc., can solve problems such as complex mathematical operations, not given blue light, difficulty, etc.
- Summary
- Abstract
- Description
- Claims
- Application Information
AI Technical Summary
Problems solved by technology
Method used
Image

Examples
Embodiment 1
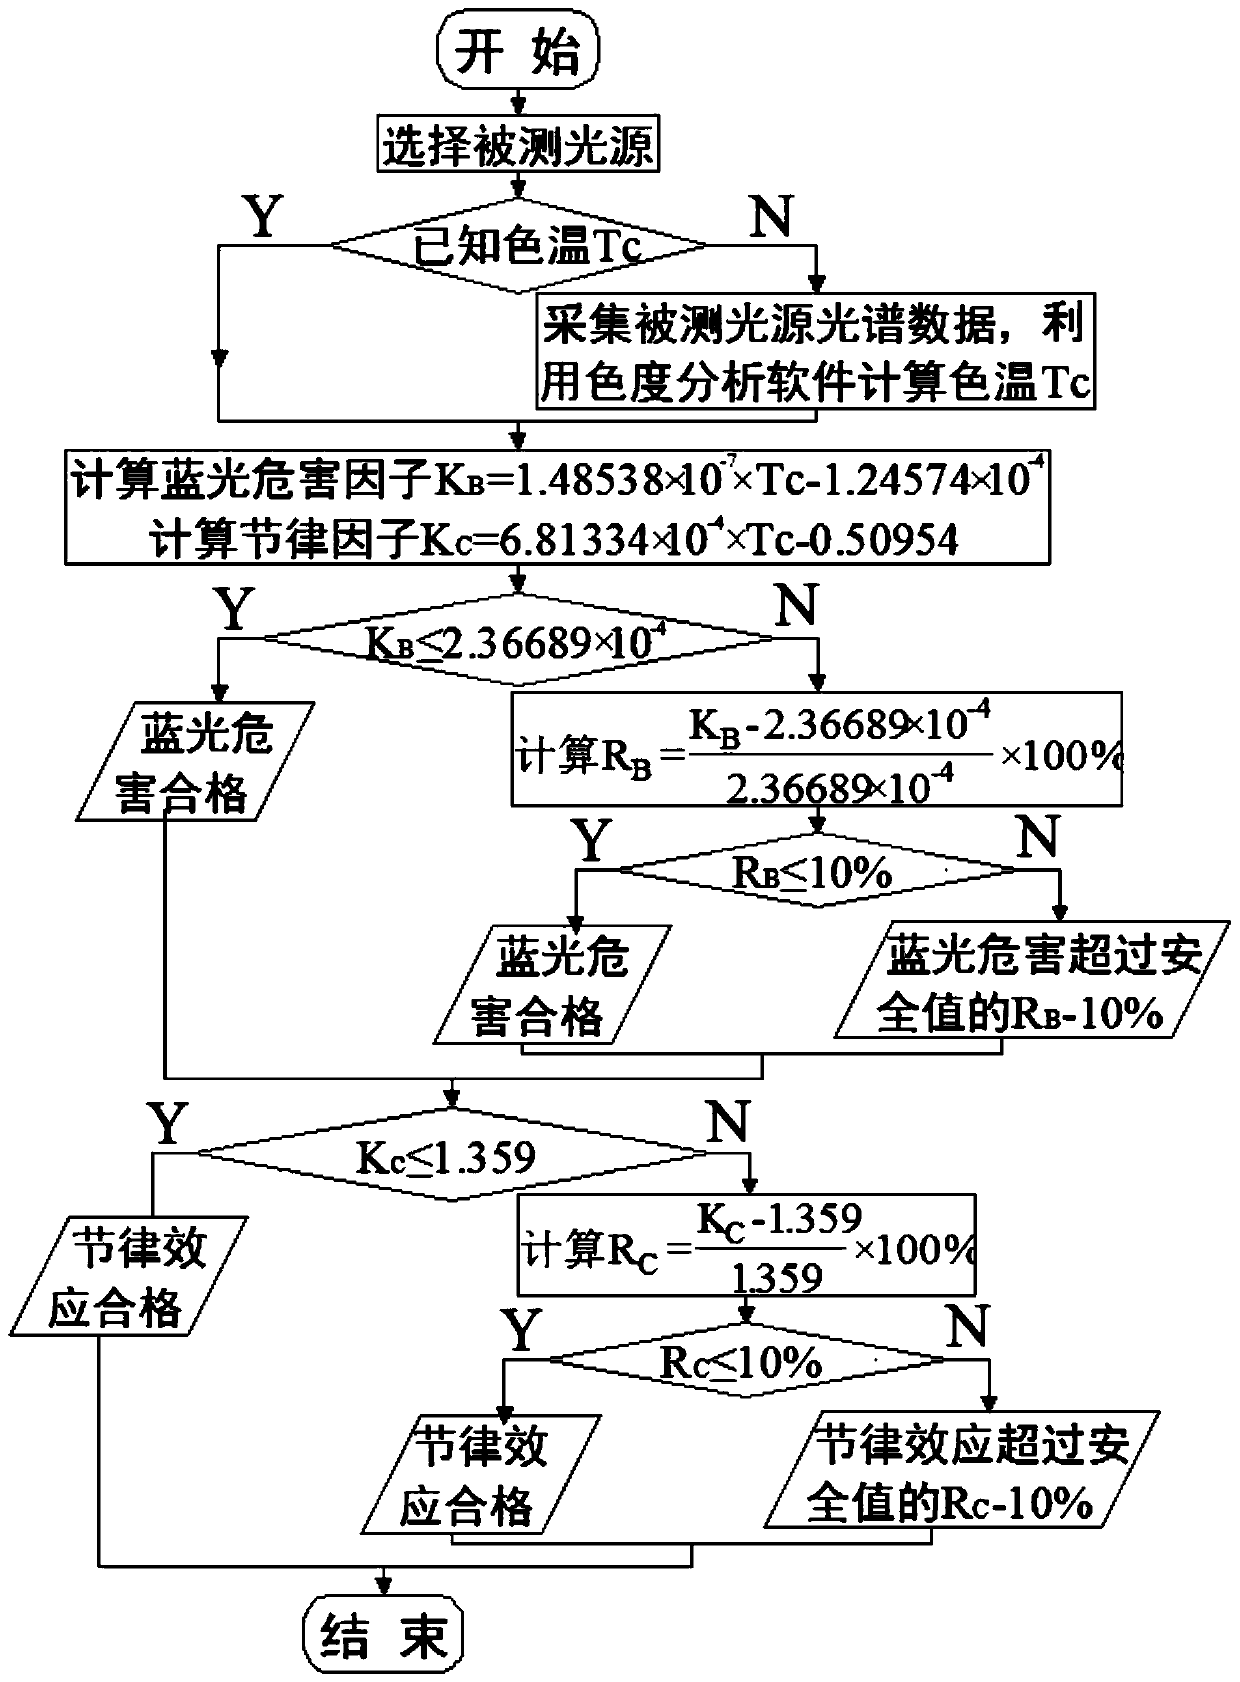
[0060] The steps of the method for quantitatively analyzing the blue light hazard and rhythm effect according to the color temperature of the light source in this embodiment are as follows: figure 1 , figure 2 , image 3 .
[0061] Step 1. Obtain the color temperature Tc of the fluorescent lamp under test:
[0062] The color temperature Tc is found to be 5200K on the manual of the tested fluorescent lamp.
[0063] Step 2. Calculate the blue light hazard factor and rhythm factor:
[0064] 2a) Substitute the color temperature of the fluorescent lamp to be measured Tc=5200K into the value, K B =1.48538×10 -7 ×Tc-1.24574×10 -4 Calculate the blue light hazard factor K of the tested fluorescent lamp B =6.47824×10 -4 W / ml.
[0065] 2b) Substitute the value of the color temperature of the fluorescent lamp to be measured Tc=5200K, K C = 6.81334×10 -4 ×Tc-0.50954 Calculate the rhythm factor K of the fluorescent lamp under test C = 3.03339.
[0066] Step 3. Determine whether the blue light hazard...
Embodiment 2
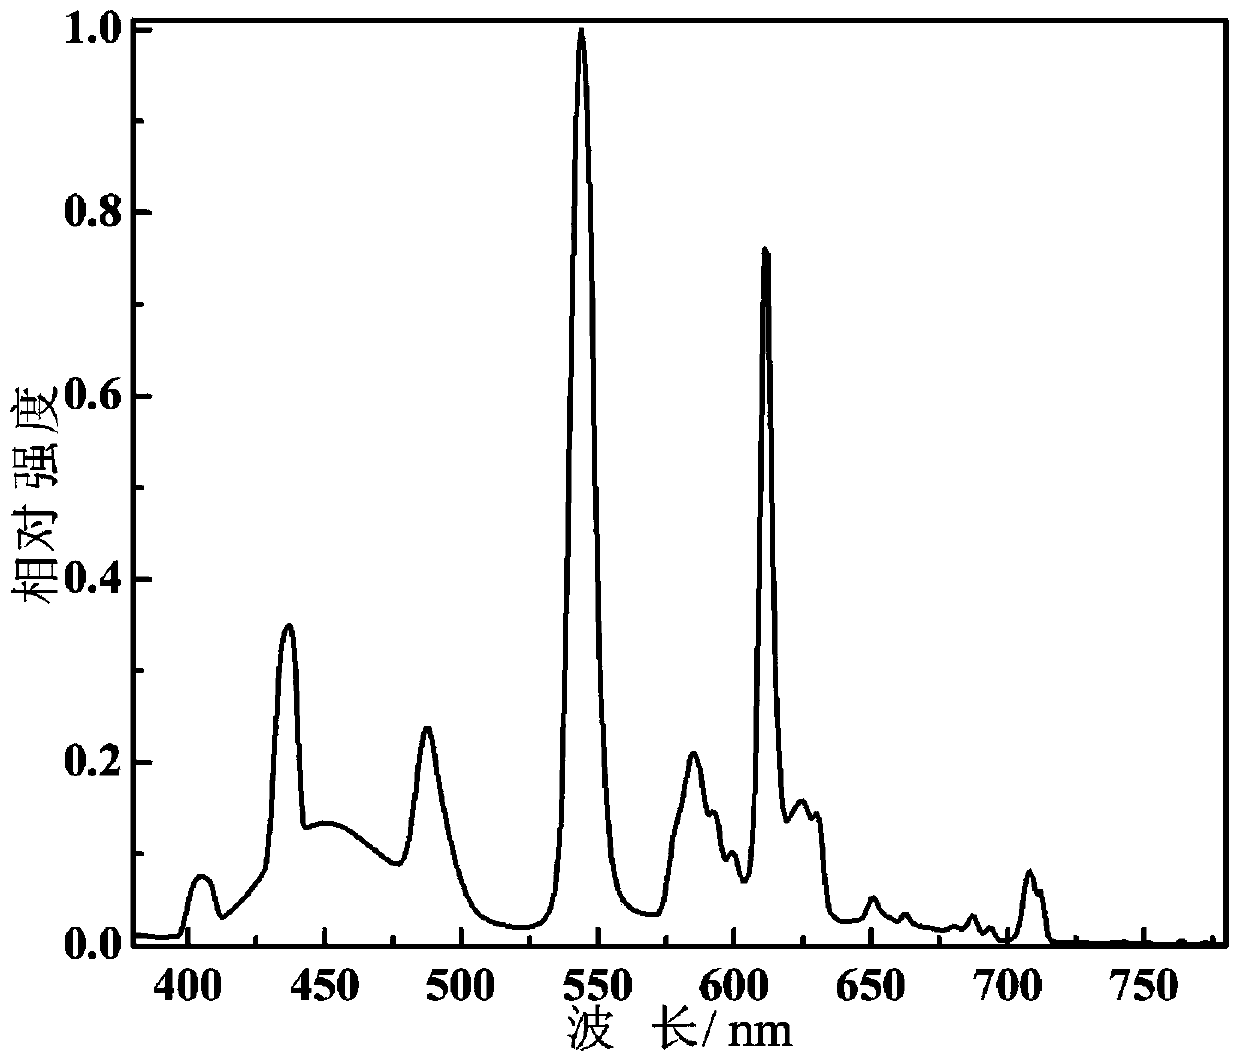
[0079] The steps of the method for quantitatively analyzing the blue light hazard and rhythm effect according to the color temperature of the light source in this embodiment are as follows: figure 1 , figure 2 , Figure 4 .
[0080] Step 1. Obtain the color temperature Tc of the tested high-pressure sodium lamp:
[0081] The color temperature of the tested high-pressure sodium lamp is 2100K.
[0082] Step 2. Calculate the blue light hazard factor and rhythm factor:
[0083] 2a) Substitute the color temperature Tc=2100K of the measured high-pressure sodium lamp into K B =1.48538×10 -7 ×Tc-1.24574×10 -4 Calculate the blue light hazard factor K of the tested high pressure sodium lamp B =1.87256×10 -4 W / ml.
[0084] 2b) Substitute the color temperature Tc of the measured high pressure sodium lamp into the value of 2100K, K C = 6.81334×10 -4 ×Tc-0.50954 Calculate the rhythm factor K of the measured high pressure sodium lamp C = 0.92126.
[0085] Step 3. Determine whether the blue light haza...
Embodiment 3
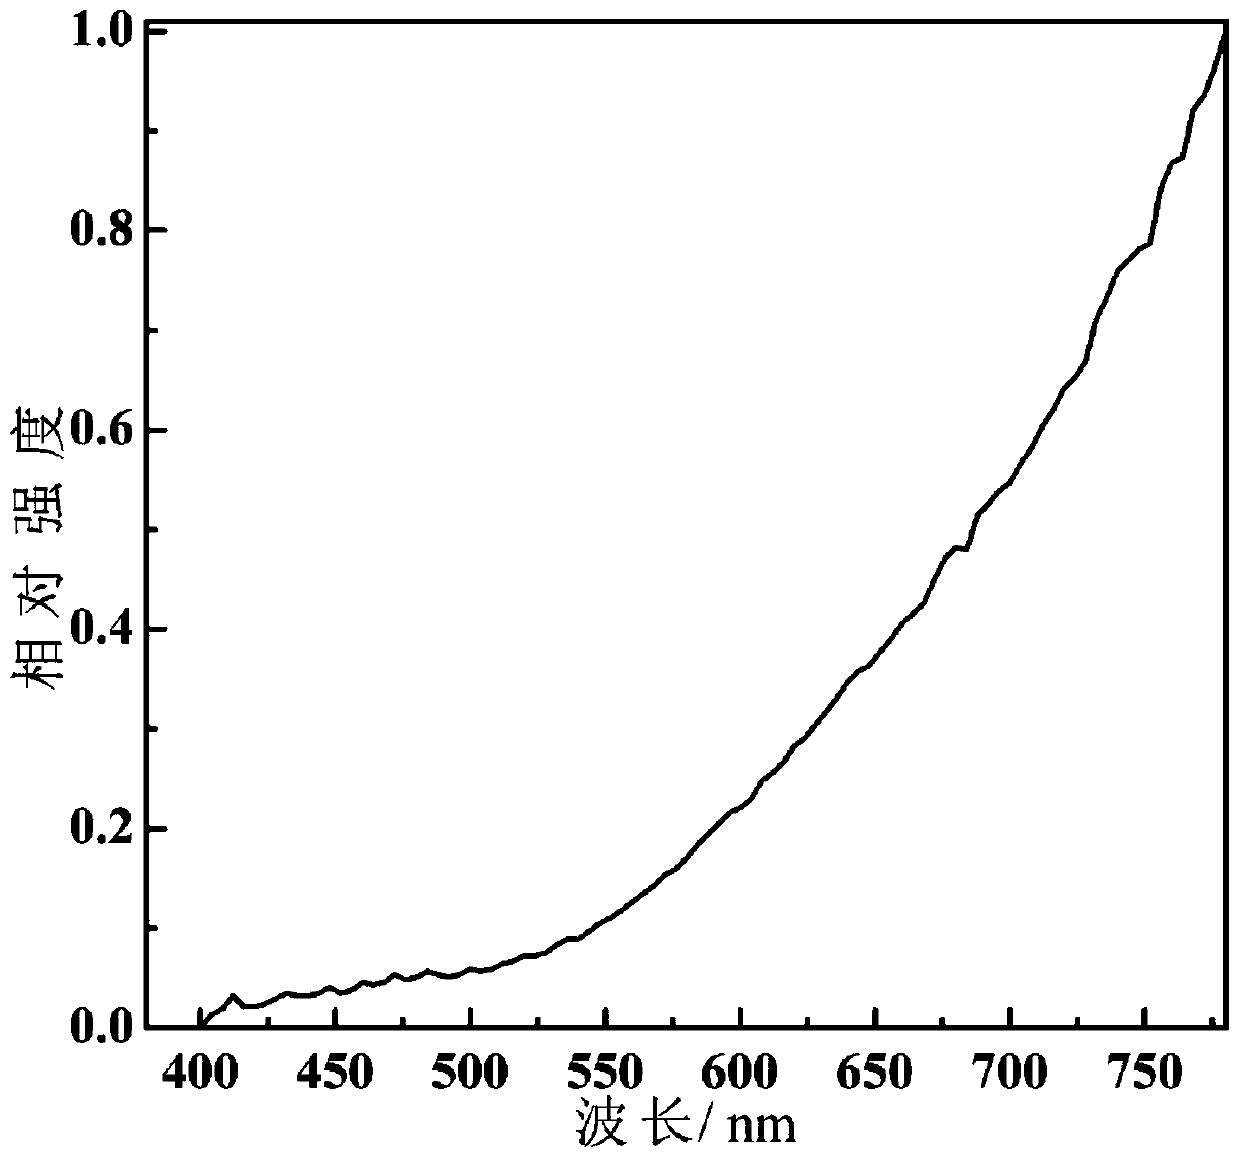
[0092] The steps of the method for quantitatively analyzing the blue light hazard and rhythm effect according to the color temperature of the light source in this embodiment are as follows: figure 1 , figure 2 , Figure 5 .
[0093] Step 1. Obtain the color temperature Tc of the measured incandescent lamp:
[0094] 1a) The color temperature data is not found in the manual of the tested incandescent lamp, and it needs to be measured.
[0095] 1b) Make the incandescent lamp work normally under 220V, 50Hz mains power, collect the 380-780nm visible light waveband spectral distribution in a dark room, and use the chromaticity analysis software to obtain the color temperature Tc of 2550K from the incandescent lamp spectral distribution data.
[0096] Step 2. Calculate the blue light hazard factor and rhythm factor:
[0097] 2a) Substitute the value of the measured color temperature of the incandescent lamp Tc=2550K, K B =1.48538×10 -7 ×Tc-1.24574×10 -4 Calculate the blue light hazard facto...
PUM
 Abstract
Description
Claims
Application Information
 - R&D Engineer
- R&D Manager
- IP Professional
- Industry Leading Data Capabilities
- Powerful AI technology
- Patent DNA Extraction
Browse by: Latest US Patents, China's latest patents, Technical Efficacy Thesaurus, Application Domain, Technology Topic, Popular Technical Reports.
© 2024 PatSnap. All rights reserved.Legal|Privacy policy|Modern Slavery Act Transparency Statement|Sitemap|About US| Contact US: help@patsnap.com