Measurement method for oil-water two-phase interference pressure gradient
A technology of pressure gradient and measurement method, which is applied in pressure difference measurement between multiple valves, measurement device, measurement of fluid pressure, etc. The measurement method is convenient, the experiment period is long, and the operability is strong.
- Summary
- Abstract
- Description
- Claims
- Application Information
AI Technical Summary
Problems solved by technology
Method used
Image
Examples
Embodiment 1
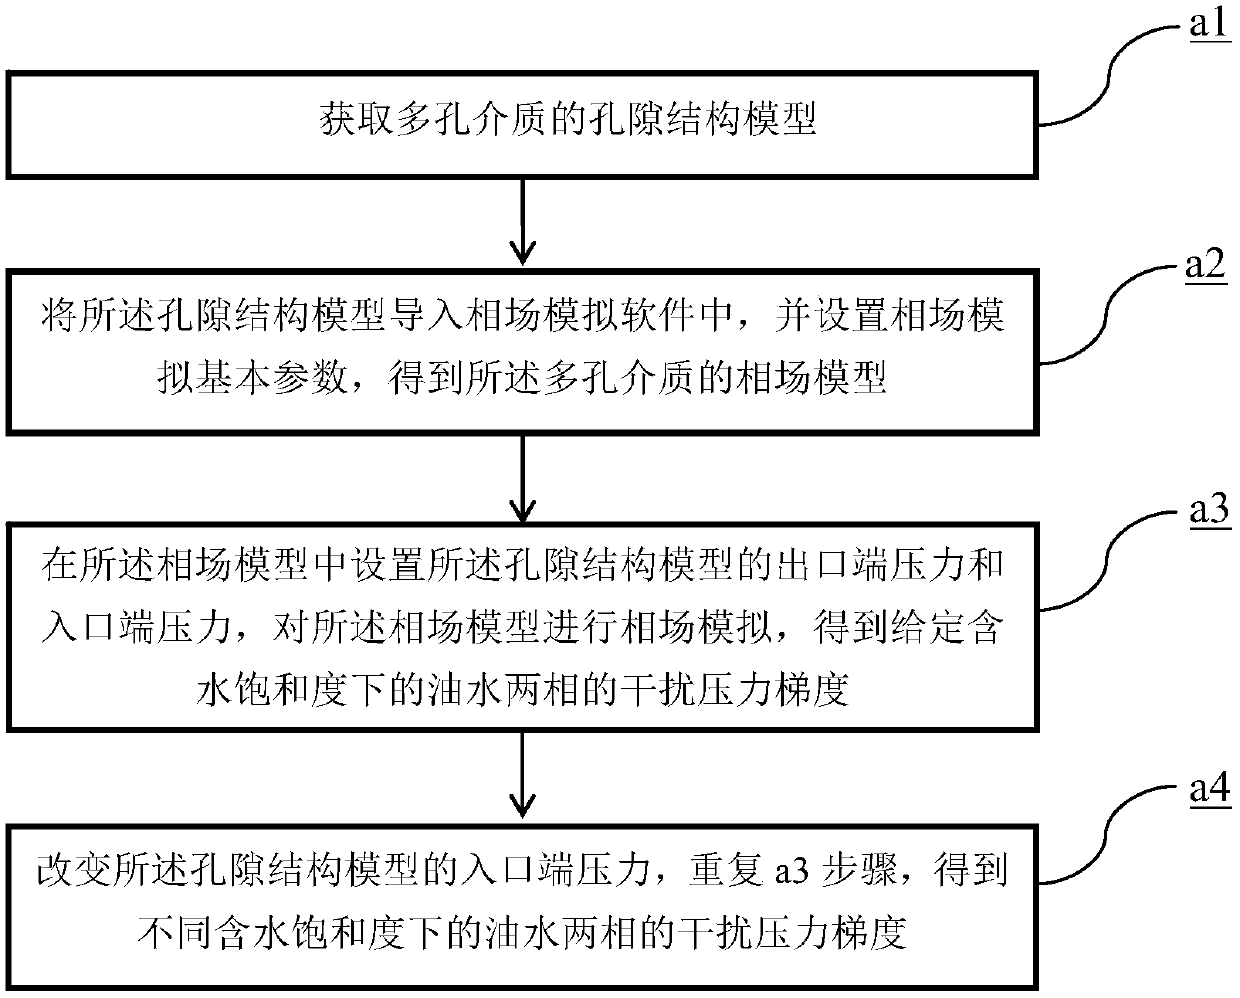
[0078] The following is the implementation effect of the method for measuring the oil-water two-phase interference pressure gradient of the present invention in Well A of Block 3-4, North Pavilion, West Gudao, Shengli Oilfield. There are two sets of development strata in this block. After long-term water injection development, it has entered the period of ultra-high water cut. For well A, the method provided by the invention is used to measure the interference pressure gradient of the oil-water two-phase.
[0079] a1: Obtain the pore structure model of porous media.
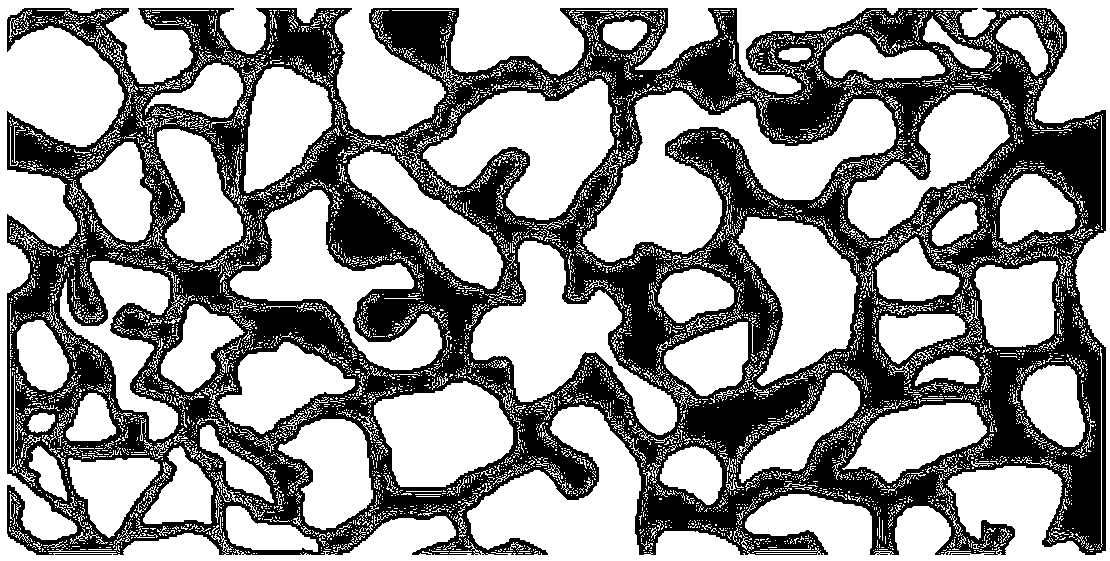
[0080] Typical samples were drilled from the rocks obtained by the sealed coring of the well, and the typical samples were scanned with a scanning electron microscope to obtain the following results: figure 2 As shown in the scanned picture, the length of the model is 600 μm; use AutoCAD software to convert the scanned picture into a DXF file to obtain the pore structure model of the porous medium.
[0081] a2...
Embodiment 2
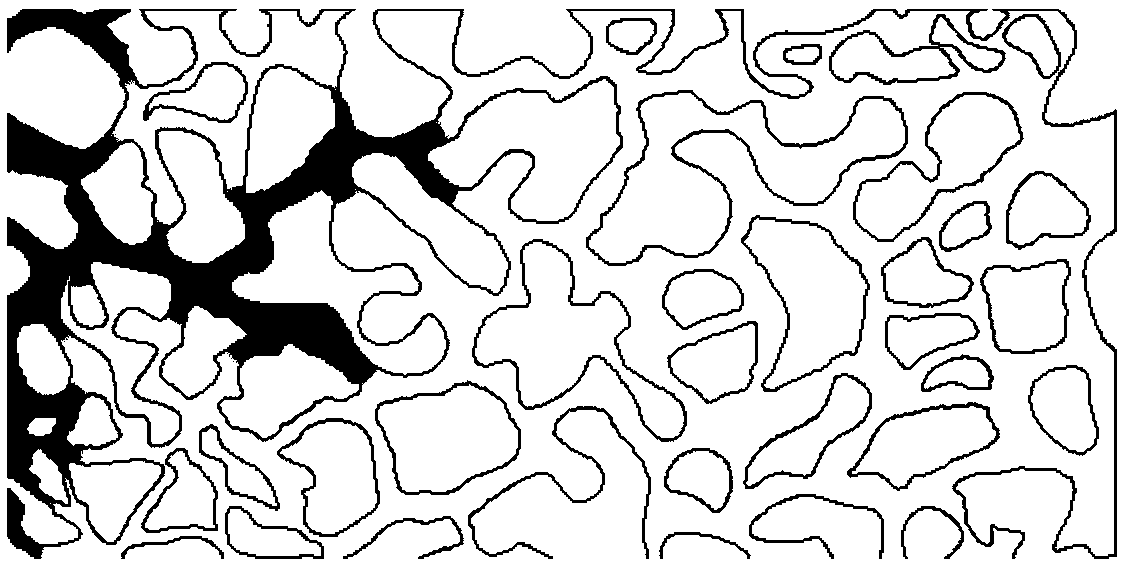
[0099] Measuring method is the same as that of Example 1, and the difference is that in steps a3-b1, the water saturation S w1 Set to 0.145, the water saturation in steps a3-b2 reaches a given value S w1 =0.145, the distribution diagram of oil-water two-phase is as follows image 3 As shown, the phase field simulation is carried out on the phase field model, and the simulation results of oil phase and water phase interference pressure gradient are obtained when the water saturation is 0.145. The simulation results are shown in Table 2.
[0100] Table 2
[0101]
[0102] Table 2: Water Saturation S w1 When the value is 0.145, the oil phase and water phase interfere with the pressure gradient simulation results ("√" in the table indicates that the fluid can flow, and "×" indicates that the fluid does not flow).
[0103] It can be seen from Table 2 that when the pressure at the inlet end is 15.625Pa, neither the oil phase nor the water phase flows anymore. At this time, the...
Embodiment 3
[0107] Measuring method is the same as embodiment 1, and difference is in step a3-b1 water saturation S w1 Set to 0.291, the water saturation in steps a3-b2 reaches a given value S w1 =0.291, the distribution diagram of oil-water two-phase is as follows Figure 4 As shown, the phase field simulation is carried out on the phase field model, and the simulation results of oil phase and water phase interference pressure gradient are obtained when the water saturation is 0.291. The simulation results are shown in Table 3.
[0108] table 3
[0109]
[0110] Table 3: Water Saturation S w1 When the value is 0.291, the oil phase and water phase interfere with the pressure gradient simulation results ("√" in the table indicates that the fluid can flow, and "×" indicates that the fluid does not flow).
[0111] It can be seen from Table 3 that when the pressure at the inlet end is 11.7188Pa, both the oil phase and the water phase no longer flow, and the interference pressure gradien...
PUM
 Abstract
Description
Claims
Application Information
 - R&D
- Intellectual Property
- Life Sciences
- Materials
- Tech Scout
- Unparalleled Data Quality
- Higher Quality Content
- 60% Fewer Hallucinations
Browse by: Latest US Patents, China's latest patents, Technical Efficacy Thesaurus, Application Domain, Technology Topic, Popular Technical Reports.
© 2025 PatSnap. All rights reserved.Legal|Privacy policy|Modern Slavery Act Transparency Statement|Sitemap|About US| Contact US: help@patsnap.com


