A Statistical Method for Screening Composite Inclusions in Steel
A technology of composite inclusion and statistical method, applied in computing, image analysis, instrumentation, etc.
- Summary
- Abstract
- Description
- Claims
- Application Information
AI Technical Summary
Problems solved by technology
Method used
Image

Examples
Embodiment 1
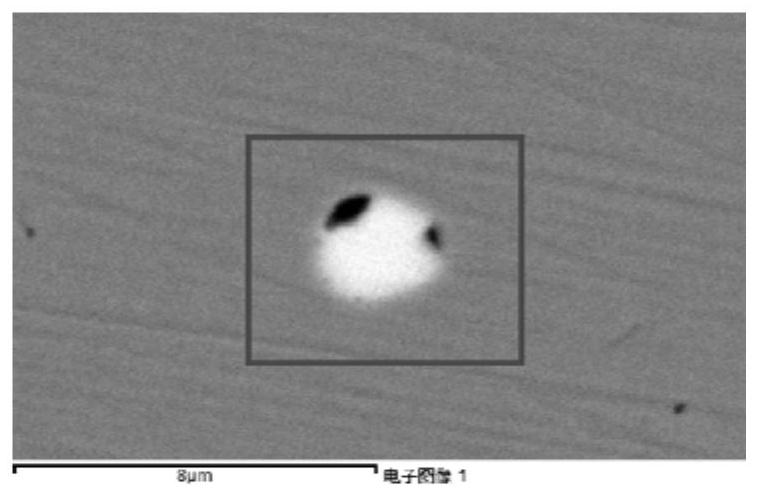
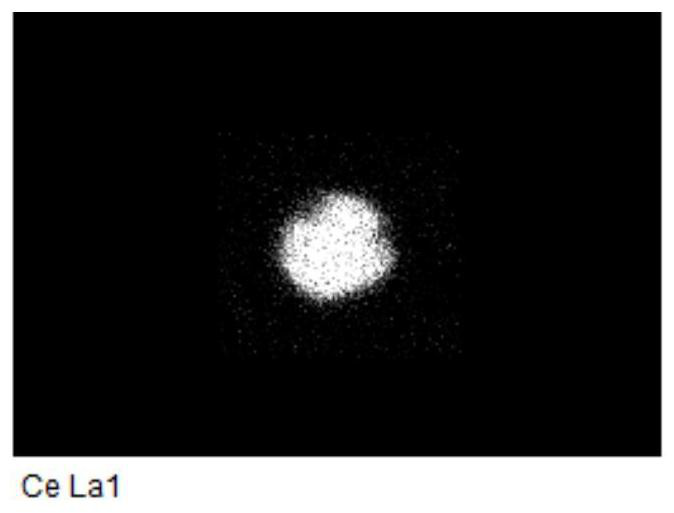
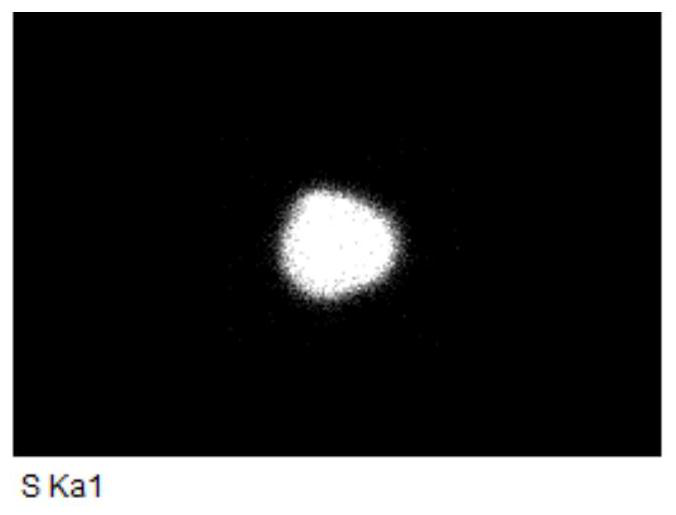
[0030] In the 380CL wheel steel with La and Ce rare earth elements, there are rare earth inclusions and Al / Mg inclusions, such as Figure 1 to Figure 6 shown. Polish the sample according to GB / T 30843 and keep the polished surface strictly level and fix it on the sample stage of Hitachi S3400 scanning electron microscope equipped with Oxford characteristic X-ray energy spectrometer. Inclusions were statistically analyzed, and the gray value of the digital image ranged from 0 to 255. Adjust the grayscale of the image so that the grayscale of the iron matrix is around 150, set two threshold ranges: the lower threshold range is 5-69, and the upper threshold range is 180-249 for statistical analysis of inclusions, and a total of 3395 inclusions are obtained. The sequence is numbered 1, 2, ..., 3395. Among them, there are 2883 effective inclusions belonging to rare earth inclusions or light element inclusions. The output statistical results are subjected to multiple screening....
Embodiment 2
[0041] The free-cutting steel is added with elements such as Bi and Pb, and the inclusions include MnS inclusions and particles containing Bi and Pb, and the MnS inclusions are long strips. The sample was polished according to GB / T 30843 and the polished surface was kept strictly level and fixed on the sample stage of a Hitachi S3400 scanning electron microscope equipped with an Oxford characteristic X-ray energy spectrometer. The inclusion automatic analysis program Aztex Steel was used to analyze the non- Metal inclusions were statistically analyzed, and the gray value of the digital image ranged from 0 to 32767. Adjust the grayscale of the image so that the grayscale of the iron matrix is around 25700, and the distribution of various inclusions is as follows Figure 7 shown. Two threshold ranges are set: the lower threshold range is 0-21466, and the upper threshold range is 28000-32767 for statistical analysis of inclusions, and a total of 1930 inclusions are obtained, n...
PUM
| Property | Measurement | Unit |
|---|---|---|
| greyscale | aaaaa | aaaaa |
| greyscale | aaaaa | aaaaa |
| greyscale | aaaaa | aaaaa |
Abstract
Description
Claims
Application Information
 - Generate Ideas
- Intellectual Property
- Life Sciences
- Materials
- Tech Scout
- Unparalleled Data Quality
- Higher Quality Content
- 60% Fewer Hallucinations
Browse by: Latest US Patents, China's latest patents, Technical Efficacy Thesaurus, Application Domain, Technology Topic, Popular Technical Reports.
© 2025 PatSnap. All rights reserved.Legal|Privacy policy|Modern Slavery Act Transparency Statement|Sitemap|About US| Contact US: help@patsnap.com