
A power quality assessment method based on cloud graph visualization output

A technology of power quality and graphics, applied in data processing applications, instruments, calculations, etc., can solve the problems of lack of unified standards for power quality evaluation, evaluation results cannot be displayed intuitively, and power users cannot intuitively grasp the power quality status, etc., to achieve convenient quality Horizontal, intuitive reading, and easy-to-operate effects

Active Publication Date: 2022-02-08
STATE GRID HUBEI ELECTRIC POWER RES INST +1
View PDF10 Cites 0 Cited by
  • Summary
  • Abstract
  • Description
  • Claims
  • Application Information

AI Technical Summary

Problems solved by technology

[0004] The invention provides a power quality evaluation method based on cloud graphic visualization to solve the problems that the current power quality evaluation lacks a unified standard, the evaluation results cannot be displayed intuitively, and power users cannot intuitively grasp the power quality status of their own power consumption

Method used


Image

  • A power quality assessment method based on cloud graph visualization output
  • A power quality assessment method based on cloud graph visualization output
  • A power quality assessment method based on cloud graph visualization output

Examples


Embodiment 1

[0082] A power quality assessment method based on cloud graphic visualization output, such as figure 1 shown, including the following steps:

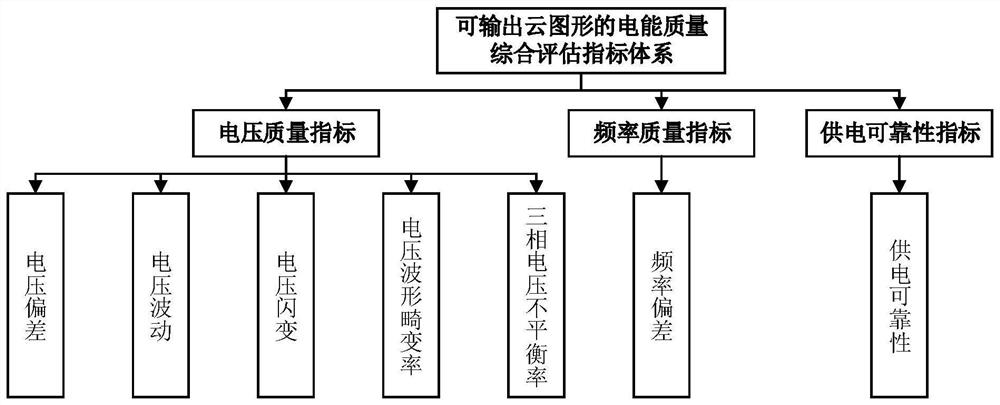
[0083] A. Determine the power quality evaluation indicators that need to be visualized graphically to form a comprehensive power quality evaluation index system. The index system covers: (1) voltage quality index: voltage deviation, voltage fluctuation, voltage flicker, voltage waveform distortion rate, three-phase voltage unbalance rate; (2) frequency quality index: frequency deviation; (3) reliability index : power supply reliability. There are 3 categories and 7 indicators in total.

[0084] B. Use the formula (1'-6') to calculate and determine the impact of each indicator in the indicator system on the final evaluation result, that is, the weight of the indicator.

[0085] C. Use formula (7') to calculate and determine the normalized value of each evaluation index.

[0086] D. Calculating the visualized output parameters of the ...

Embodiment 2

[0089] I. Determine the power quality evaluation indicators that need to be visualized graphically to form a comprehensive power quality evaluation index system, including: (1) Voltage quality indicators: voltage deviation, voltage fluctuation, voltage flicker, voltage waveform distortion rate, three-phase voltage unbalance (2) frequency quality index: frequency deviation; (3) reliability index: power supply reliability. Index system such as figure 2 shown.

[0090] II. Use the formula (1'-6') to calculate and determine the impact of each indicator in the indicator system on the final evaluation result, that is, the weight of the indicator. The weights are shown in Table 1.

[0091] Table 1 Index weight of power quality evaluation index system

[0092]

[0093]

[0094] III. Utilize formula (7') to calculate and determine the normalized value of each evaluation index, and the calculation results are shown in Table 2.

[0095] Table 2 Index normalized value of power ...


PUM


Abstract

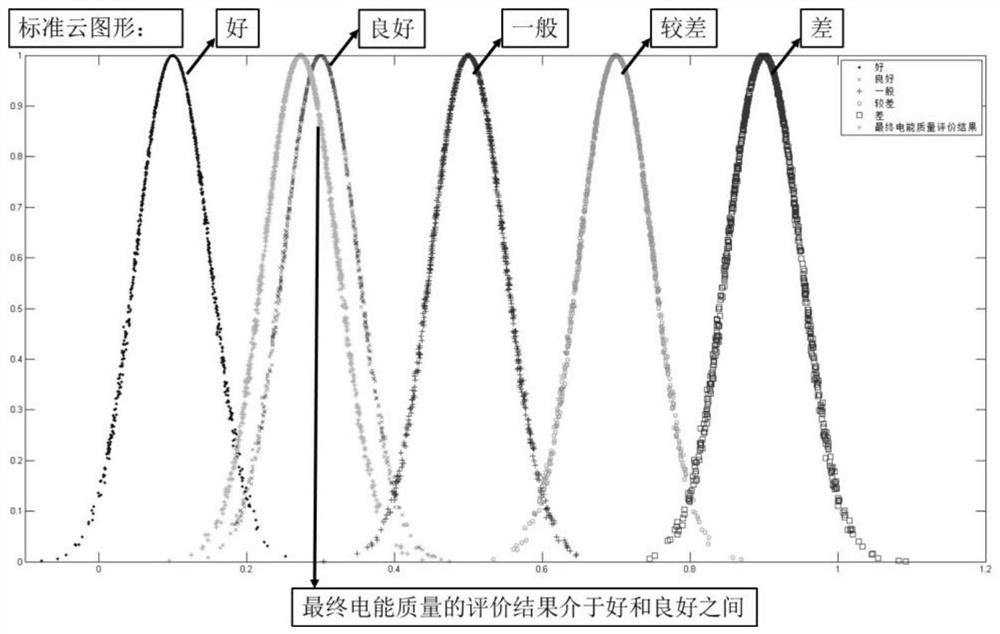
The present invention provides a power quality evaluation method based on cloud graph visualization output, which includes: determining the power quality evaluation index that needs to be visualized to form a power quality comprehensive evaluation index system; using the analytic hierarchy process to calculate and determine each index in the index system. The size of the impact of the final evaluation result, that is, the weight of the index; calculate the normalized value of the original data of each evaluation index; calculate the visual output parameters of the power quality evaluation result; substitute the parameters into the Gaussian function and use the Gaussian function after the parameter substitution in the computer Commonly used mathematical software is used to draw function images, and the drawn images are the visualized cloud graphics of the final evaluation results. This method establishes a power quality assessment model based on the visual output of cloud graphics, which overcomes the problems of inconsistent measurement standards and obscure data of traditional power data, and can help power users intuitively and specifically grasp the power quality status of their own electricity consumption. .

Description

technical field [0001] The invention relates to the technical field of user-side power quality evaluation and auxiliary decision-making, in particular to a power quality evaluation method based on cloud graphic visualization output. Background technique [0002] With the development of distributed power supply technology, more and more power electronic devices are used in the power grid, which increases the nonlinear factors in the power grid and causes more and more power distortion; at the same time, with the frequency conversion energy-saving technology in air conditioners, refrigerators, The application of air purifiers, dishwashers, kitchen shredders and other electrical appliances has more and more sources of power quality pollution on the user side; the simultaneous action of various factors has caused the power quality in the grid to be increasingly threatened. If there is a problem with the power quality, the small one will cause damage to the user's electrical appl...

Claims


Application Information

Patent Timeline
Patent Type & Authority Patents(China)
IPC IPC(8): G06Q10/06G06Q50/06
CPCG06Q10/06393G06Q50/06Y02P90/82
Inventor 丁凯李伟胡羽川钱一民王易
Owner STATE GRID HUBEI ELECTRIC POWER RES INST
Learn More