Sandstone acid-rock reaction visualization quantitative evaluation method

A technology for acid-rock reaction and quantitative evaluation, applied in the field of petroleum geological testing, can solve problems such as false images, inability to compare in situ, difficulties, etc.

Inactive Publication Date: 2018-08-28
CHINA PETROLEUM & CHEM CORP +1
View PDF8 Cites 10 Cited by
  • Summary
  • Abstract
  • Description
  • Claims
  • Application Information

AI Technical Summary

Problems solved by technology

The effectiveness of the acid solution and the potential value of production increase can be judged by the simulation experiment results, but it is impossible to compare the effects of pore increase and sensitive mineral dissolution in the same area of ​​the sample, and it is impossible to realize the pores in the three-dimensional space before and after the acid-rock reaction of the sample. Design a more effective acidification formula by comparing with the distribution shape and distribution pattern of sensitive minerals to achieve the best acidification effect
In order to observe the three-dimensional structure inside the core sample, the existing petroleum geological testing technology must go through repeated and complicated destructive sample preparation, such as casting thin sections, scanning electron microscope, electron probe, etc. These processes are not only very difficult, but also will introduce artificial artifacts

Method used


Image

  • Sandstone acid-rock reaction visualization quantitative evaluation method
  • Sandstone acid-rock reaction visualization quantitative evaluation method
  • Sandstone acid-rock reaction visualization quantitative evaluation method

Examples


Embodiment 1

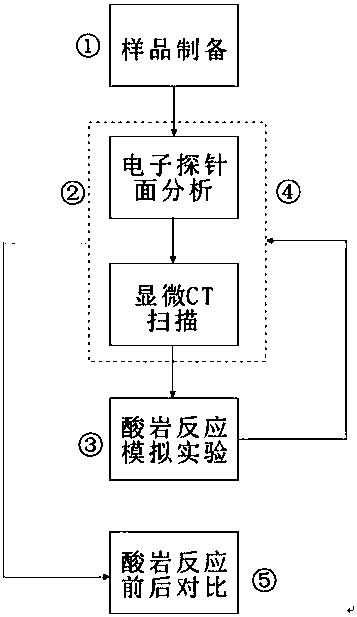
[0037] Example 1. A method for visual quantitative evaluation of sandstone-acid rock reaction, comprising the following steps:

[0038] 1. The sample comes from the core of a well in Shengli Oilfield. A 4mm diameter and 8mm long column sample was drilled, and the 800-mesh corundum column sample was ground to meet the requirements of electronic probe analysis.

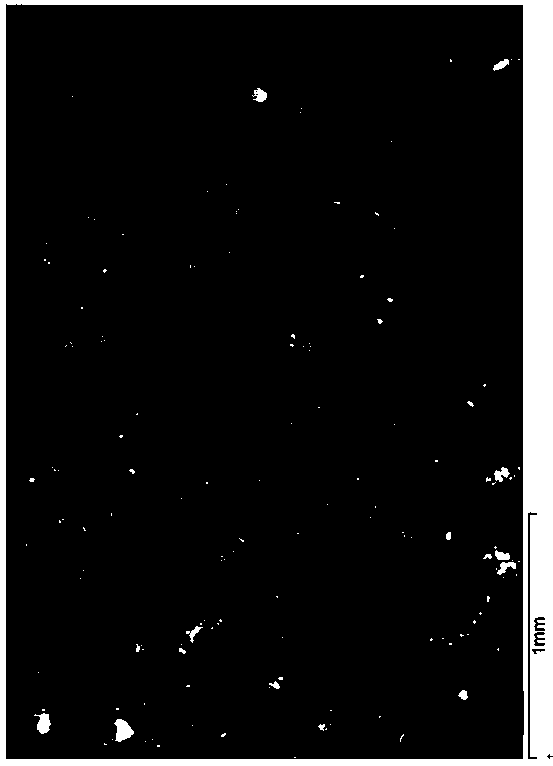
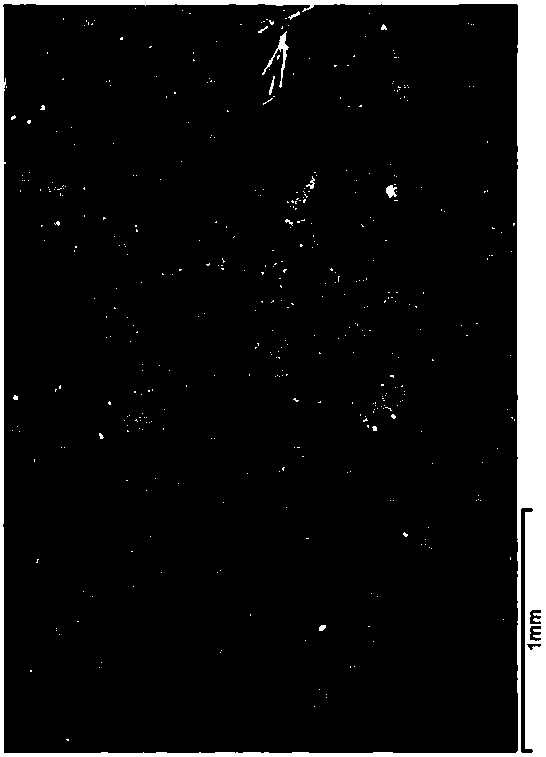
[0039] 2. The electronic probe surface analysis was carried out on the grinding plane ( figure 2 ) and micro-CT first layer imaging ( Figure 4 ); Carry out micro-CT three-dimensional imaging on the core column sample, and determine the gray-scale segmentation threshold of the sensitive minerals and pores of the core column sample by comparing the analysis results of the electron probe surface and the first-layer imaging results of the micro-CT, and use the Avizofirer software Segment the 3D imaging results to obtain a 3D image of pores ( Figure 6 ) and three-dimensional images of carbonate-sensitive minerals ( F...

Embodiment 2

[0047] Example 2. A method for visual quantitative evaluation of sandstone-acid rock reaction, comprising the following steps:

[0048] Step 1: Drill a horizontal core column sample (perpendicular to the full-diameter core direction of the vertical well) sample with a diameter of 2-8mm and a length generally less than 2cm (less than the length of the sample that can be placed on the electronic probe sample table), grind one end of the sample flat, and record For side A.

[0049]Step 2: Use the electron probe to perform imaging and energy spectrum analysis on the A side of the sample, and record the resulting image as A1; put the A side up into the micro-CT for the first layer (that is, the A side) imaging and three-dimensional imaging, the first layer The imaging result is recorded as A2, and the 3D imaging construction result is recorded as V1; comparing A1 with A2, the mineral skeleton and pore fine boundaries on the A2 surface can be segmented, and the gray threshold of th...

Embodiment 3

[0065] Example 3. A method for visual quantitative evaluation of sandstone-acid rock reaction, comprising the following steps: ①Drilling a horizontal core column sample with a diameter of 2-8 mm, and grinding one end of the core column to meet the analysis requirements of a composite electronic probe; Needle surface analysis and micro-CT first-layer imaging, and micro-CT three-dimensional imaging of the entire sample, by comparing the electron probe surface analysis results and micro-CT first-layer imaging results, the gray-scale segmentation threshold of minerals and pores is obtained. The threshold is segmented in the 3D imaging results to obtain 3D images of pores and sensitive minerals such as carbonates, and calculate the sample porosity and volume content of sensitive minerals; ④ Repeat step ② experiment and analysis for the reacted sample; ⑤ Compare the analysis results of steps ② and ④ to obtain the porosity and sensitive mineral volume changes before and after acid ro...


PUM

PropertyMeasurementUnit
diameteraaaaaaaaaa
porosityaaaaaaaaaa

Abstract

The invention discloses a sandstone acid-rock reaction visualization quantitative evaluation method, which comprises: burnishing a sandstone core column sample to achieve a flat state; carrying out electron probe surface analysis, micro CT first-layer imaging and micro CT three-dimensional imaging on the burnished surface to obtain the three-dimensional image of pores and sensitive minerals, and calculating the porosity and the volume content of the sensitive minerals; carrying out acid-rock reaction simulation experiment on the sample; and carrying out electron probe surface analysis, micro CT first-layer imaging and micro CT three-dimensional imaging to obtain the three-dimensional image of pores and sensitive minerals, calculating the porosity and the volume content of the sensitive minerals after the reaction, and comparing the porosities and the volume contents of the sensitive minerals before and after the reaction. With the method of the present invention, the change of the porosity and the volume content of the sensitive minerals before and after the acid-rock reaction can be obtained, the three-dimensional spatial distribution shape of the pores and sensitive minerals canbe displayed, the acid-rock reaction action effect can be subjected to visualization quantitative evaluation, and the technical support can be provided for the oil test and producing test and the scientific, reasonable and efficient development of tight sandstone oil layers.

Description

technical field [0001] The invention relates to a visual quantitative evaluation method for sandstone-acid rock reaction effect, belonging to the technical field of petroleum geological testing. Background technique [0002] The acid-rock reaction simulation experiment under indoor formation temperature and pressure conditions is currently one of the most effective means to accurately evaluate the formation stimulation potential before acidizing oil testing or stimulation. The effectiveness of the acid solution and the potential value of production increase can be judged by the simulation experiment results, but it is impossible to compare the effects of pore increase and sensitive mineral dissolution in the same area of ​​the sample, and it is impossible to realize the pores in the three-dimensional space before and after the acid-rock reaction of the sample. Comparing with the distribution pattern and distribution pattern of sensitive minerals to design a more effective ac...

Claims


Application Information

Patent Timeline
Patent Type & Authority Applications(China)
IPC IPC(8): G01N23/046G01N23/225G01N23/2251G01N1/08G01N1/28
CPCG01N1/08G01N1/286G01N23/04G01N23/2251
Inventor 方正伟滕建彬张守鹏刘宁谢忠怀李博刘宝军李保利崔松楠
Owner CHINA PETROLEUM & CHEM CORP
Why Eureka
Try Eureka