Method for quantitative and homogenous analysis of gluing diaphragm material in lithium ion battery
A technology for lithium-ion batteries and diaphragm materials, which is applied in the field of qualitative and uniformity analysis of rubber-coated diaphragm materials in lithium-ion batteries. It can solve problems such as high environmental requirements, affecting test results, and difficulty in distinguishing coating methods. The effect of less dosage and accurate test results
- Summary
- Abstract
- Description
- Claims
- Application Information
AI Technical Summary
Problems solved by technology
Method used
Image
Examples
Embodiment 1
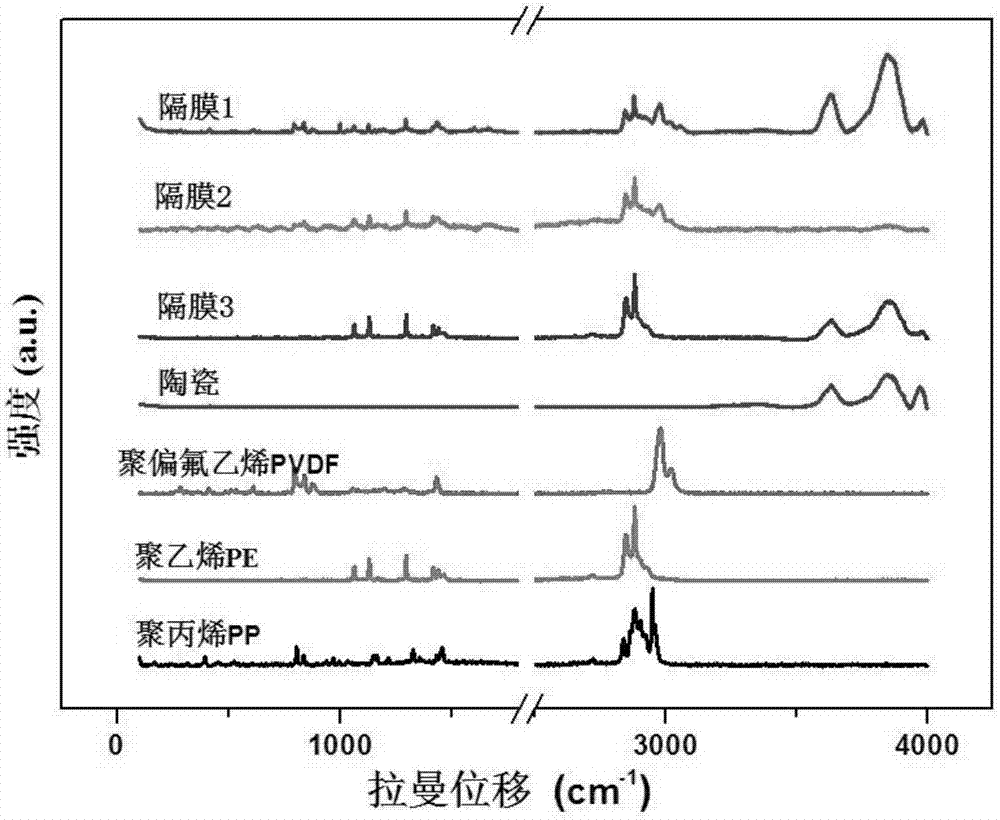
[0029] (1) Using a Raman spectrometer, carry out Raman spectroscopic detection on the standard samples PP, PE, PVDF, and ceramics with known components in the diaphragm material, and the Raman spectrograms are as follows figure 1 and collect the Raman characteristic peak position data in each Raman spectrogram, then set up the Raman spectrum characteristic peak position database, as shown in Table 1;
[0030] (2) Under the same test conditions as step (1), use a Raman spectrometer to detect the Raman spectrum of the rubberized diaphragm sample to be tested, so as to obtain its Raman spectrum and Raman imaging; In the case of Raman spectroscopy, if there are phenomena such as poor signal-to-noise ratio and strong background signal in Raman spectroscopy, spectral smoothing, baseline correction and other processing methods can be adopted, which will not affect the Raman shift.
[0031] (3) compare the Raman characteristic peak position in the Raman spectrogram of the rubber-coate...
Embodiment 2
[0034] According to the analysis method of Example 1, the two sides of the rubber-coated diaphragm sample 1 to be tested are respectively subjected to Raman spectrum detection with a Raman spectroscopic analyzer, and the two sides of the diaphragm are respectively marked as diaphragm 1 and diaphragm 2, under the same conditions Next test its Raman spectrum, and extract its Raman peak position; then compare with Table 1, qualitative:
[0035] As shown in the comparison results in Table 1, it can be seen that the Raman spectrum peak position in diaphragm 1 is 793.57cm -1 、836.64cm -1 、1433.95cm -1 、2976.97cm -1 The isopeak position belongs to the characteristic peak of polyvinylidene fluoride, 1060.28cm -1 、1125.90cm -1 、1291.58cm -1 、2844.54cm -1 、2878.86cm -1 The equal peak position is attributed to the peak position of polyethylene, 3630.37cm -1 、3850.20cm -1 、3982.05cm -1 It can be attributed to ceramics, and the peak shape, relative displacement, and relative inte...
Embodiment 3
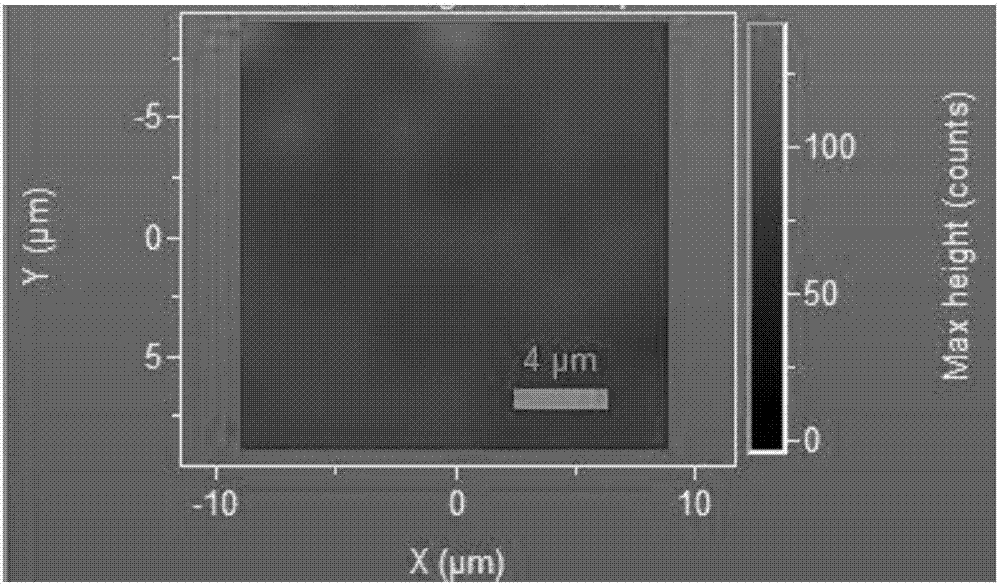
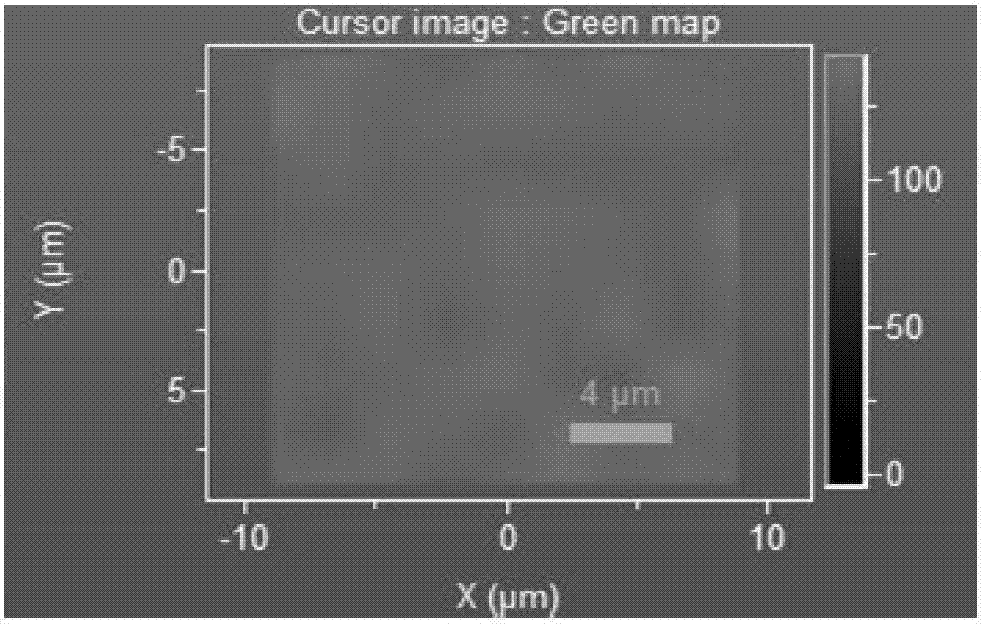
[0039] Using the membrane 2 in Example 2 as a test sample, a certain test area is selected by mediating the movement of the platform of the Raman spectrometer, and the spectrum of the area is collected. Such as figure 2 It is the Raman spectrum imaging of the local area of the rubber-coated diaphragm (diaphragm 2). In the figure, the 838cm peak of the PVDF Raman spectrum is selected -1 as its characteristic peak. figure 2 Medium 838cm -1 The intensity distribution is not uniform, indicating poor uniformity of the coating PVDF in separator 2.
PUM
 Abstract
Description
Claims
Application Information
 - R&D
- Intellectual Property
- Life Sciences
- Materials
- Tech Scout
- Unparalleled Data Quality
- Higher Quality Content
- 60% Fewer Hallucinations
Browse by: Latest US Patents, China's latest patents, Technical Efficacy Thesaurus, Application Domain, Technology Topic, Popular Technical Reports.
© 2025 PatSnap. All rights reserved.Legal|Privacy policy|Modern Slavery Act Transparency Statement|Sitemap|About US| Contact US: help@patsnap.com


