
Spectrum feature visualization device and visualization method

A spectrum feature and spectrum technology, applied in the field of spectrum feature visualization device, can solve the problems of complicated measurement process and so on.

Inactive Publication Date: 2017-06-30
广州新拓慧电子科技有限公司
View PDF5 Cites 2 Cited by
  • Summary
  • Abstract
  • Description
  • Claims
  • Application Information

AI Technical Summary

Problems solved by technology

[0006] In the actual measurement, the ITU measurement method uses the mathematical model of the Poisson distribution to measure the spectrum occupancy, which has certain limitations: the ITU measurement method is suitable for the case of a small occupancy, and for the case of a large occupancy, the upper limit of the confidence interval There will be unreasonable situations greater than 100%, and the number of sampling points is large, making the measurement process more complicated and cumbersome

Method used


Image

  • Spectrum feature visualization device and visualization method
  • Spectrum feature visualization device and visualization method
  • Spectrum feature visualization device and visualization method

Examples


Embodiment Construction

[0049] In order to make the object, technical solution and advantages of the present invention clearer, the present invention will be further described in detail below in conjunction with the accompanying drawings.

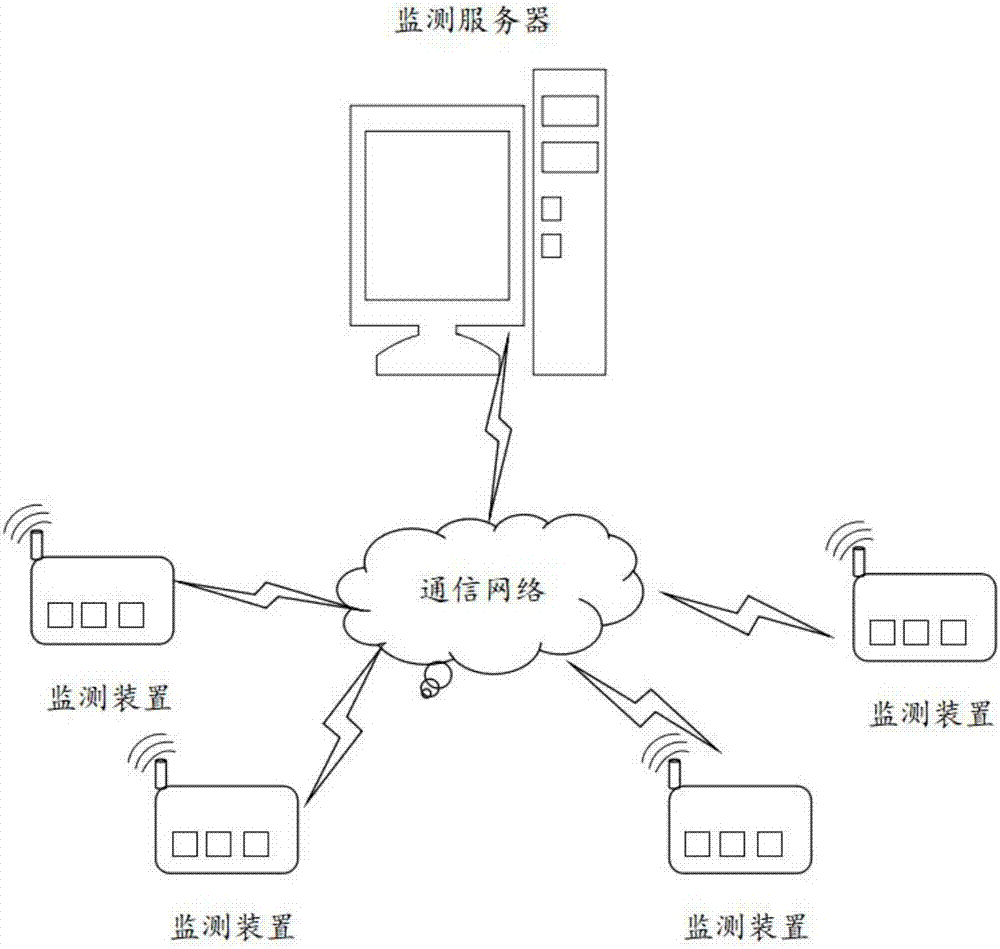
[0050] Embodiments of the present invention provide a spectrum feature visualization device, such as figure 1 As shown, it includes a monitoring server and a plurality of monitoring devices, the monitoring server and the plurality of monitoring devices are connected in communication, and the plurality of monitoring devices are connected to each other to form a monitoring network;

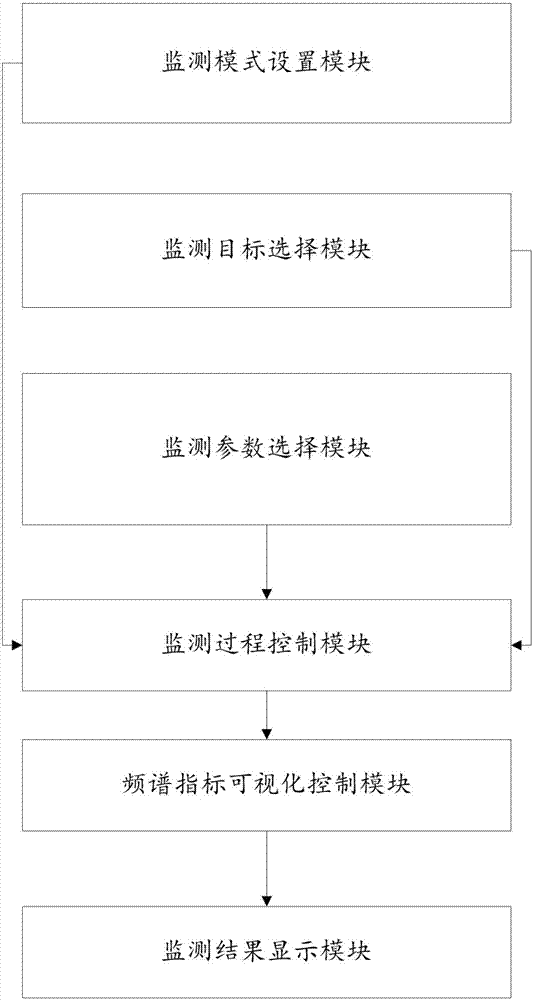
[0051] The monitoring server such as figure 2 As shown, it includes a monitoring mode setting module, a monitoring target selection module, a monitoring parameter selection module, a spectrum index visualization control module, a monitoring process control module, and a monitoring result display module; the spectrum index visualization control module is used to select the spectrum. A ...


PUM


Abstract

The invention provides a spectrum feature visualization device and a spectrum feature visualization method, used for displaying time occupancy rates and space occupancy rates of comprehensive frequency and different industrial utilization frequency, and a maximum value, a minimum value and an average value of level / field intensity from different angles such as frequency domain, space and time by using charts. Measurement on the spectrum occupancy rate is performed by using a Poisson distribution mathematical model, the situation that the measured spectrum occupancy rate has a reasonable confidence interval can be ensured, furthermore, in the case of same confidence level and relative accuracy, the quantity of sampling points is much less than that of the sampling points in the prior art, particularly under the condition of high occupancy.

Description

technical field [0001] The invention relates to the radio field, in particular to a spectrum feature visualization device and a visualization method. Background technique [0002] With the continuous development of the wireless communication industry based entirely on the electromagnetic spectrum, radio monitoring and direction-finding equipment and devices in various provinces and cities across the country have developed into various types, such as fixed monitoring stations (central stations and unattended stations), vehicle-mounted mobile Stations, Airborne Monitoring Devices, Shipborne Monitoring Devices and Portable Monitoring Devices. However, the existing radio spectrum monitoring devices face the challenges of the increasingly complex electromagnetic environment in the air, and it is difficult to accurately understand the electromagnetic situation in the area. It is difficult for the device to provide comprehensive support for the management of various monitoring fac...

Claims


Application Information

Patent Timeline
IPC IPC(8): H04B17/318H04B17/309
CPCH04B17/309H04B17/318
Inventor 侍宇飞曾耀强
Owner 广州新拓慧电子科技有限公司
Learn More