
A Time-varying Network Community Evolution Visualization Method Introducing Quantitative Indicators

A time-varying network and community technology, applied in the field of information visualization, can solve the problems of lack of quantitative information display, failure to consider the dynamic properties of time-varying network, and the need to improve the utilization rate of visualization space, so as to achieve the effect of enhancing readability.

Active Publication Date: 2020-03-17
CHONGQING UNIV OF POSTS & TELECOMM
View PDF3 Cites 0 Cited by
  • Summary
  • Abstract
  • Description
  • Claims
  • Application Information

AI Technical Summary

Problems solved by technology

However, existing research generally has the following problems: (1) The starting point of existing research is usually to preserve user image maps, but there are still many controversies on whether this effort really helps users obtain information; (2) a single Timeframe network visualization results lack time-varying properties of the network
For the single-step time frame layout of the time-varying network, the traditional static layout algorithm is still used, and the dynamic properties of the time-varying network are not considered; (3) The visualized information is mostly qualitative and lacks the display of quantitative information; (4) The utilization rate of the visualization space needs to be improved

Method used


Image

  • A Time-varying Network Community Evolution Visualization Method Introducing Quantitative Indicators
  • A Time-varying Network Community Evolution Visualization Method Introducing Quantitative Indicators
  • A Time-varying Network Community Evolution Visualization Method Introducing Quantitative Indicators

Examples


Embodiment Construction

[0019] Specific implementation plan

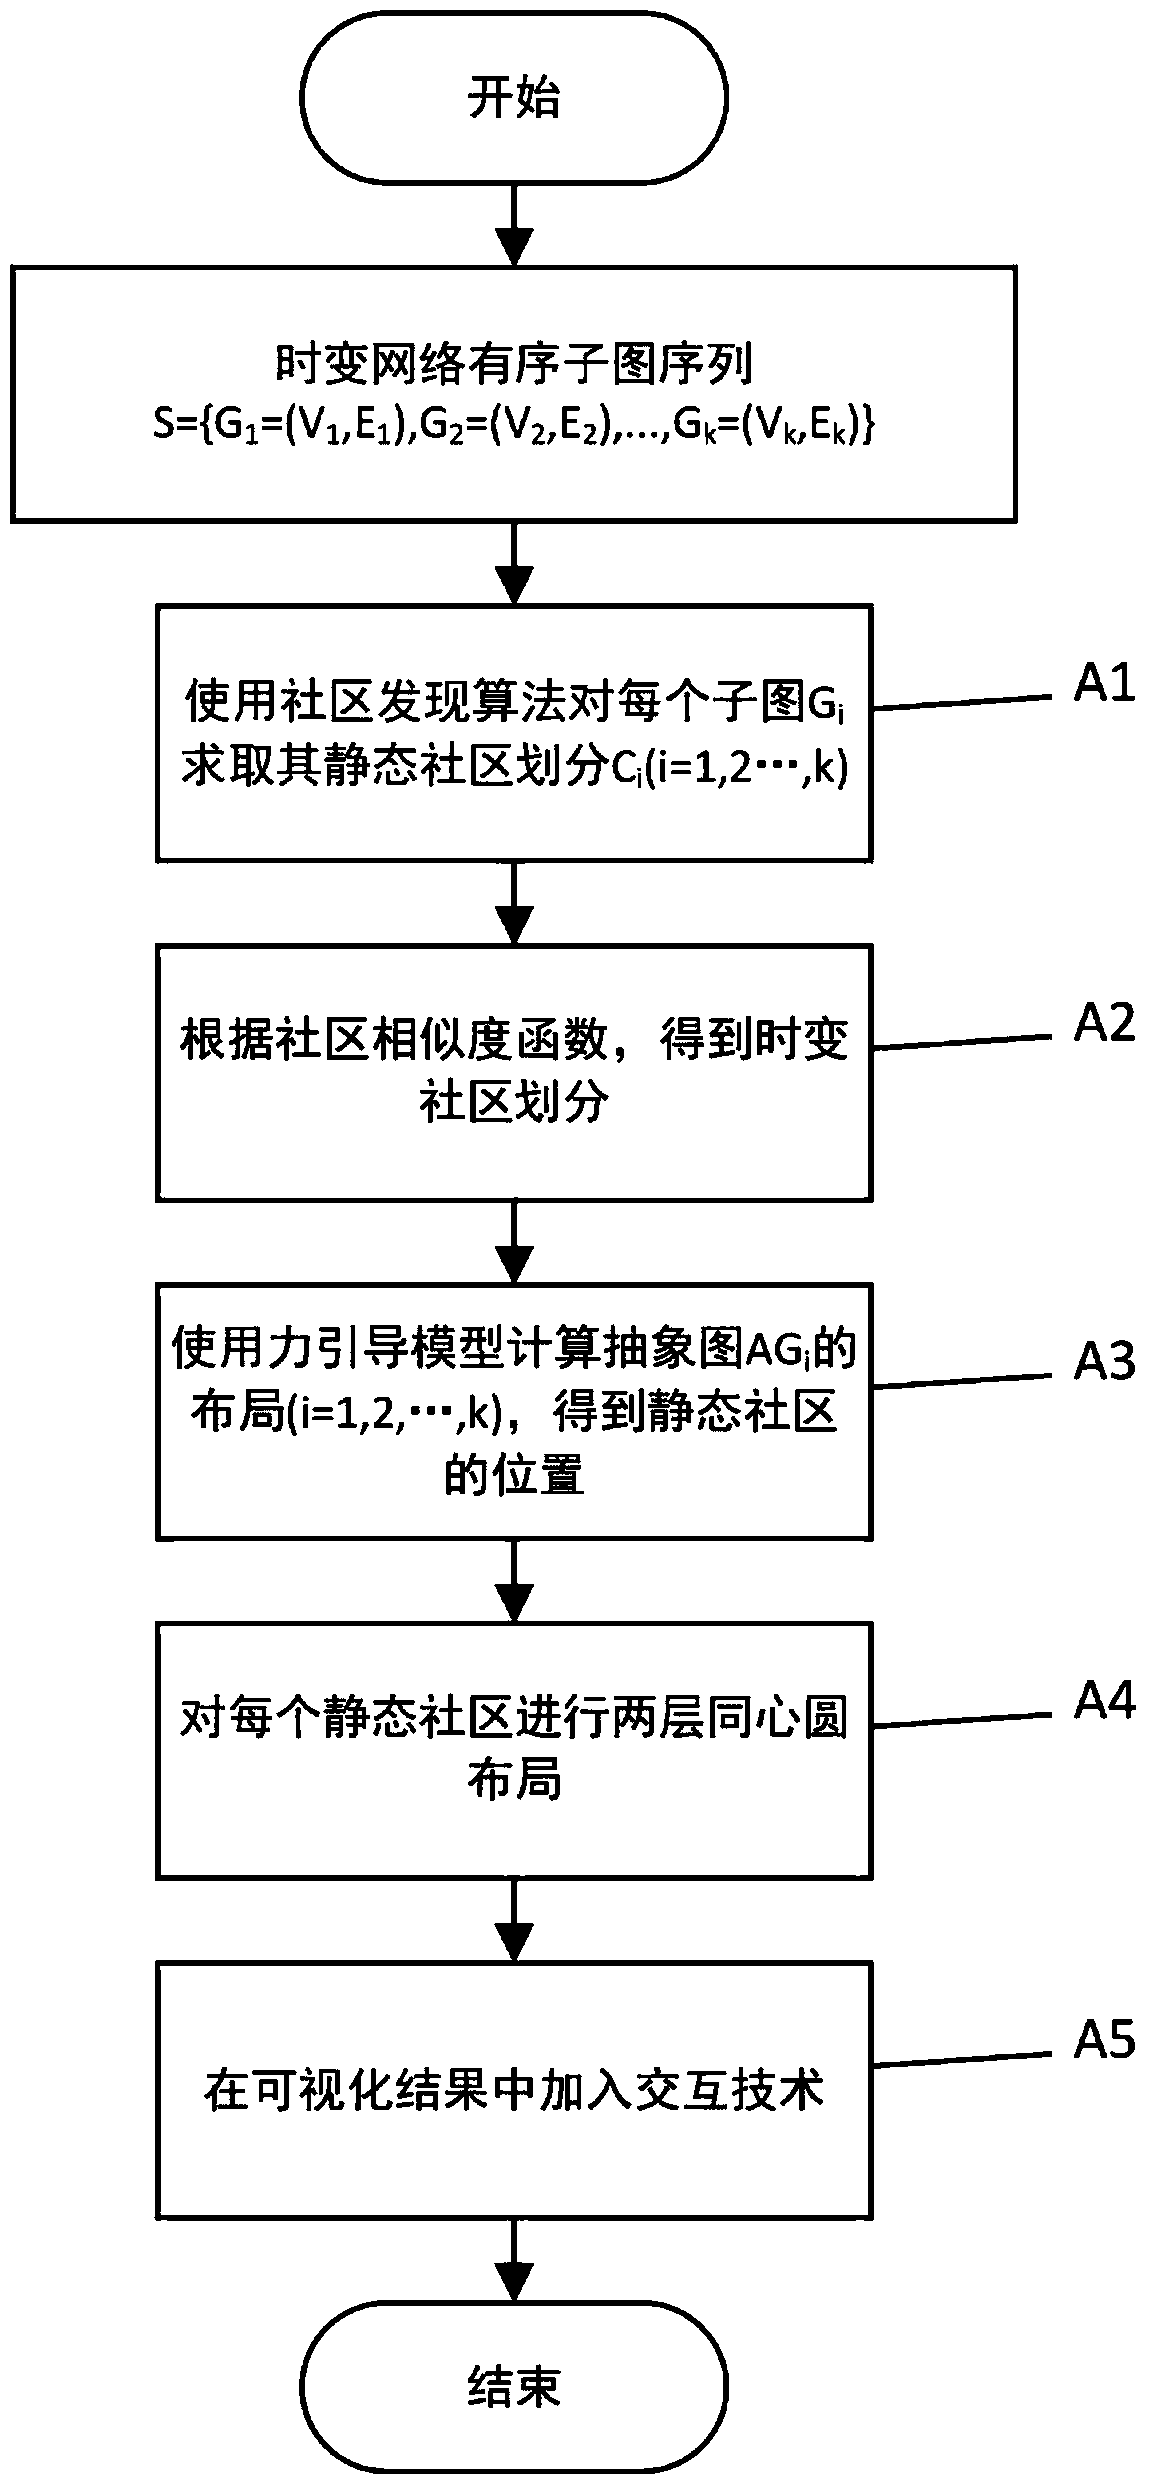
[0020] Most of the existing network visualization methods are aimed at static networks. The so-called static network means that the time attributes of the network are not considered. The nodes and edges in the network are fixed. Correspondingly, the time-varying network considers the time attributes of network evolution. The nodes and edges in the network follow Increase or decrease over time. Correspondingly, the community structure obtained by the community division of the static network is also static, and the members of the community are unchanged, while the community structure obtained by the community division of the time-varying network is also dynamic, and the members of the community also change with time.

[0021] A time-varying network can be divided into several moments. Although the time-varying network is constantly changing, the network is "static" at a certain moment. The time-varying network is called a "time step sub-network"...


PUM


Abstract

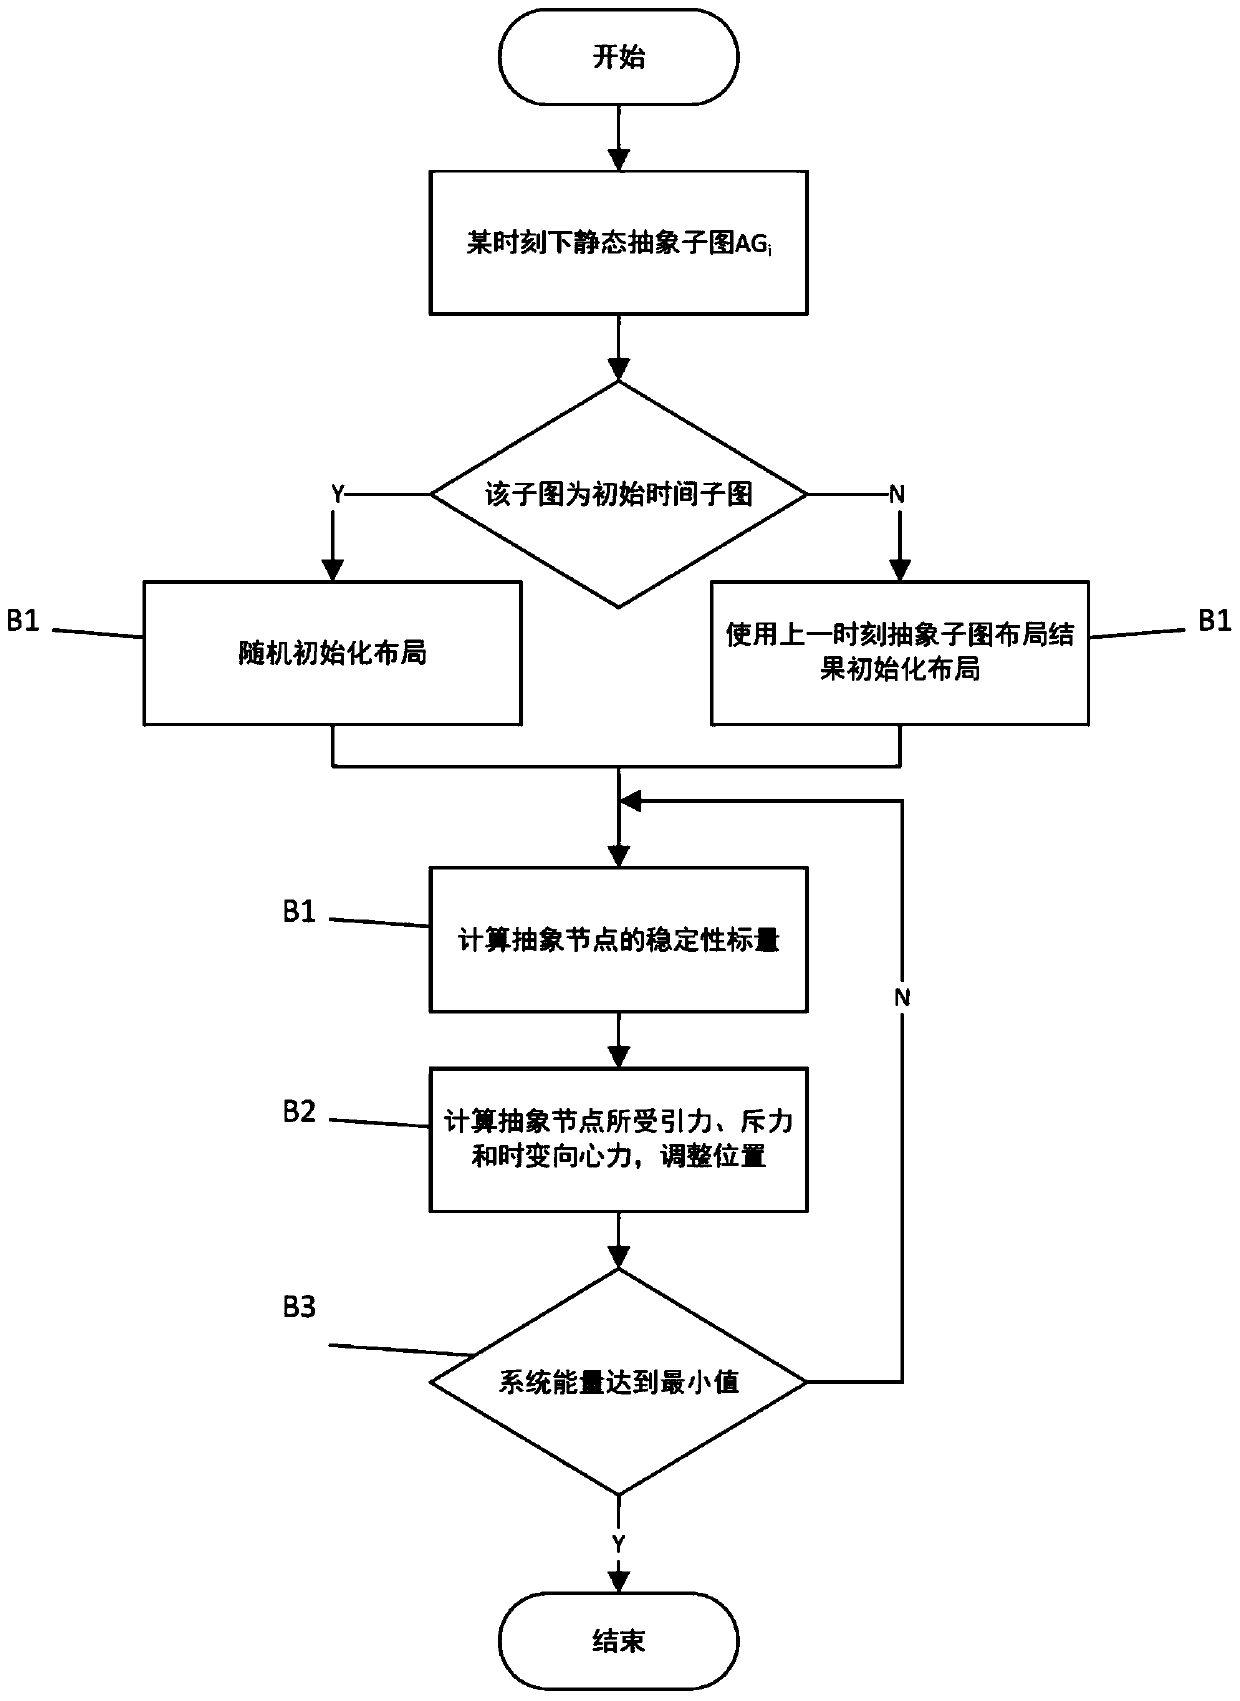
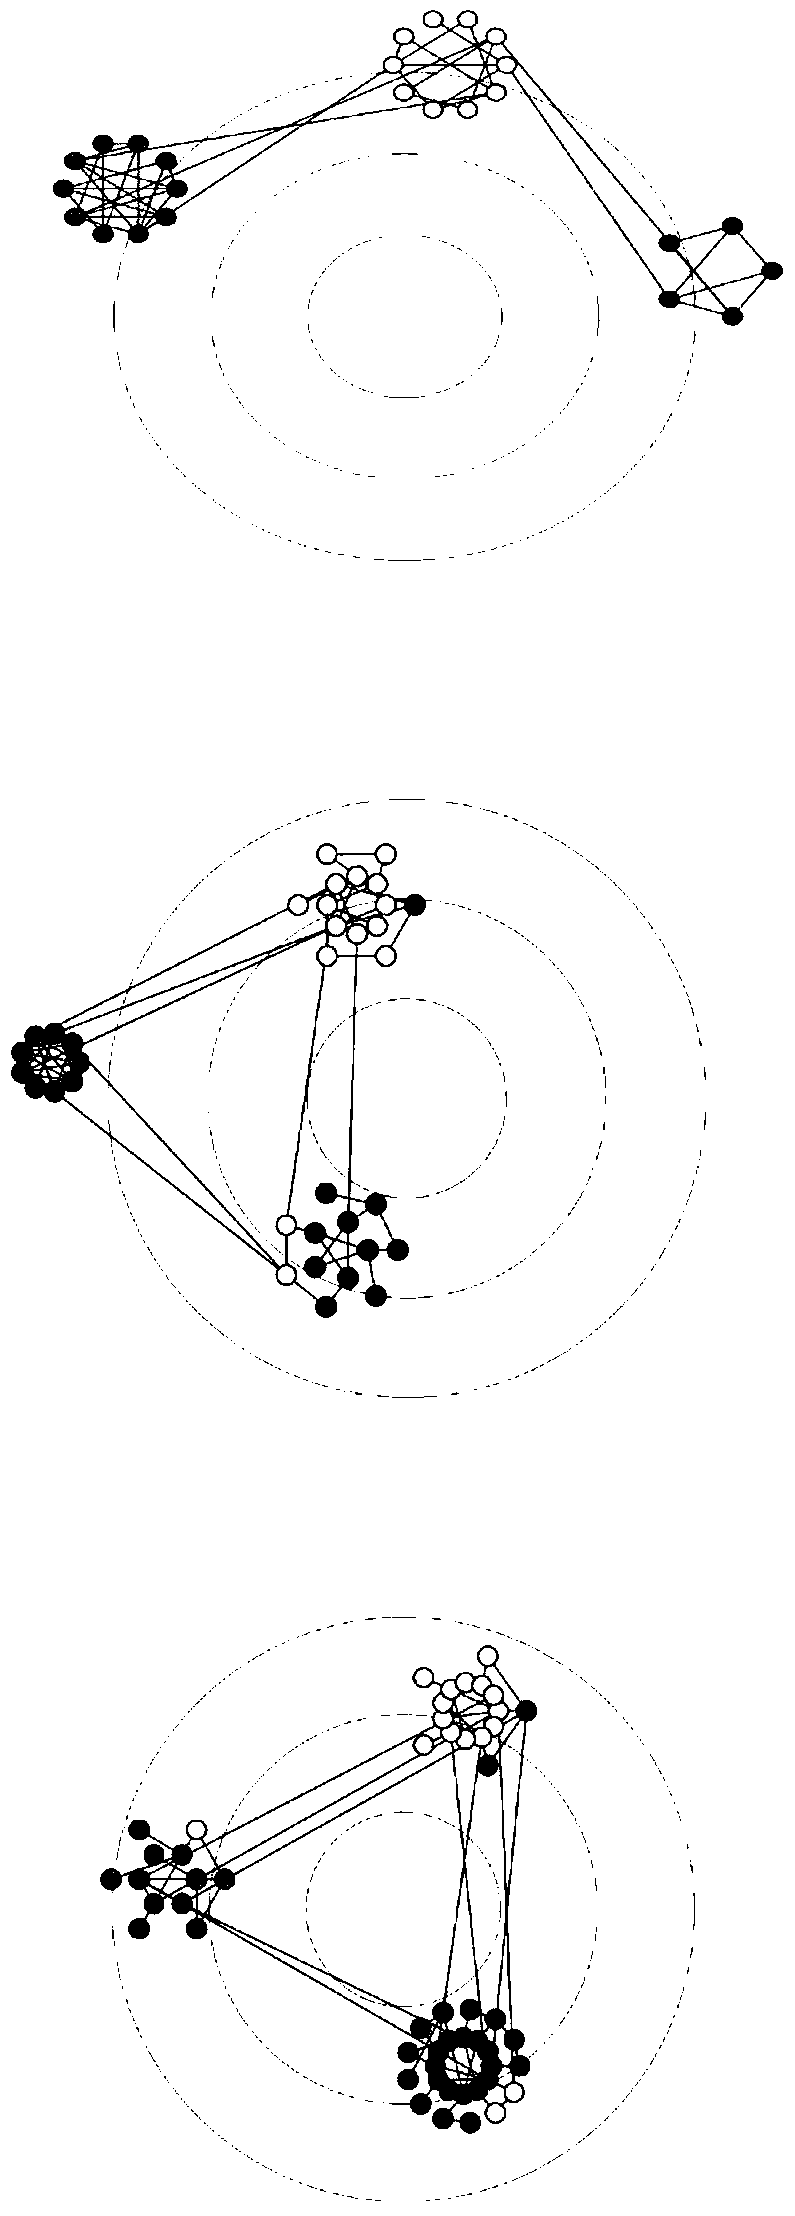
The invention relates to the information visualization field and especially relates to a visualization method capable of reflecting community evolution in a time-varying network. Time-varying community division of the time-varying network is acquired. Global layout is performed on an abstract community network and a time-varying centripetal force is introduced so that an unstable community is close to a layout center and mapping of a community position and a time-varying characteristic is realized. A stability index is used to limit gravitation and a repulsive force in a gravitation model so as to guarantee layout stability and ensure a community layout position. Layout is performed on nodes in each community and node changes of a time-varying community in adjacent time slices are embodied. A concentric circular ring is used as a visual background and readability of the community position and stability quantification index mapping information is enhanced.

Description

Technical field [0001] The invention relates to the field of information visualization, in particular to a visualization layout method reflecting the evolution process of a time-varying network community structure. Background technique [0002] Human society has long been networked, and there are complex networks such as the World Wide Web, social networks, and transportation networks everywhere in human life. Traditional network visualization research actually takes static networks as the research object, that is, the network structure of the visualization object will not change over time. Most networks in the real world are dynamic or time-varying, that is, nodes and edges in the network change over time. With the deletion of nodes or edges, new nodes and edges will be added. The research of time-varying network is much more complicated because it needs to consider time attributes, because the addition or deletion of nodes in the network may affect the global structure of the ...

Claims


Application Information

Patent Timeline
Patent Type & Authority Patents(China)
IPC IPC(8): G06F16/9538G06Q50/00
Inventor 吴渝温磊李红波郑雪松李藻旭
Owner CHONGQING UNIV OF POSTS & TELECOMM
Learn More