Data clustering analysis method based on Grassmann manifold
An analysis method and data clustering technology, which is applied in the direction of instruments, character and pattern recognition, computer components, etc., can solve the problems that the clustering results are not accurate enough, and the Euclidean space cannot fully reflect the spatial distribution characteristics of data clustering, etc., to achieve The effect of improving accuracy
- Summary
- Abstract
- Description
- Claims
- Application Information
AI Technical Summary
Problems solved by technology
Method used
Image
Examples
Embodiment 1
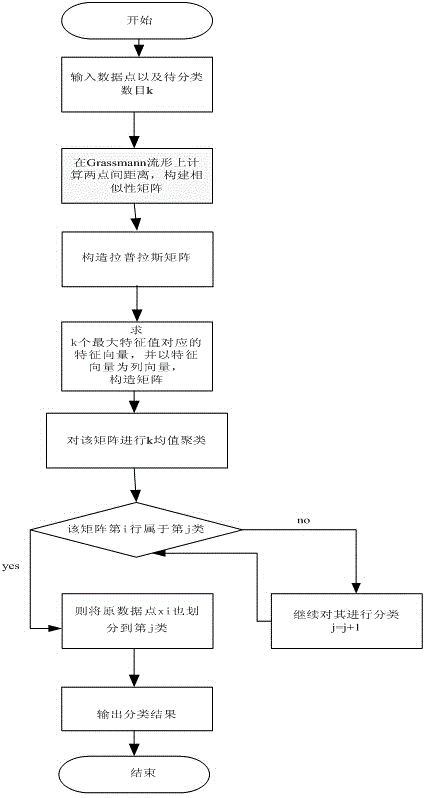
[0022] step 1:
[0023] Enter 200 data points of 100 dimensions , the number of clusters to be clustered is 2; (each data point is a 100-dimensional column vector, and 200 data points form a 100*200 matrix)
[0024] Step 2:
[0025] Based on the distance formula between two points on the Grassmann manifold, calculate the distance between data points and construct a similarity matrix .
[0026] Step 3:
[0027] Construct the Laplacian Matrix , where D is a diagonal matrix, .
[0028] Step 4:
[0029] Find the eigenvectors corresponding to the two largest eigenvalues of the Laplacian matrix L, and construct the matrix ,in is a column vector.
[0030] Step 5:
[0031] Normalize the row vectors of V to get a matrix Y where .
[0032] Step 6:
[0033] Treat each row of Y as R 2 A point within the interval is classified using the K value algorithm.
[0034] Step 7:
[0035] If the th row belongs to class, the original data point also divided into Cl...
Embodiment 2
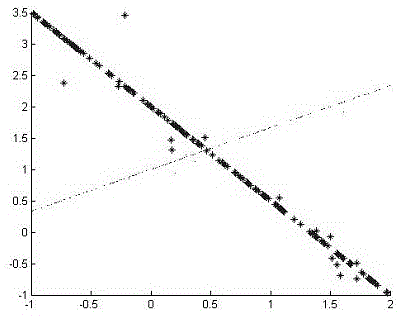
[0039] step 1:
[0040] Input 340 2D data points , the number to be clustered is 2;
[0041] Step 2:
[0042] Based on the distance formula between two points on the Grassmann manifold, calculate the distance between data points and construct a similarity matrix .
[0043] Step 3:
[0044] Construct the Laplacian Matrix , where D is a diagonal matrix, .
[0045] Step 4:
[0046] Find the eigenvectors corresponding to the two largest eigenvalues of the Laplacian matrix L, and construct the matrix ,in is a column vector.
[0047] Step 5:
[0048] Normalize the row vectors of V to obtain a matrix Y where .
[0049] Step 6:
[0050] Treat each row of Y as R 2 A point within the interval is classified using the K value algorithm.
[0051] Step 7:
[0052] If Y row belongs to class, the original data point also divided into Classification of output data points .
Embodiment 3
[0054] step 1:
[0055] Input 297 data points of 62 dimensions , the number to be clustered is 3;
[0056] Step 2:
[0057] Based on the distance formula between two points on the Grassmann manifold, calculate the distance between data points and construct a similarity matrix .
[0058] Step 3:
[0059] Construct the Laplacian Matrix , where D is a diagonal matrix, .
[0060] Step 4:
[0061] Find the eigenvectors corresponding to the two largest eigenvalues of the Laplacian matrix L, and construct the matrix ,in is a column vector.
[0062] Step 5:
[0063] Normalizing the row vectors of V yields a matrix Y where .
[0064] Step 6:
[0065] Treat each row of Y as if it were R 2 A point in the space, using the K-means algorithm to classify it.
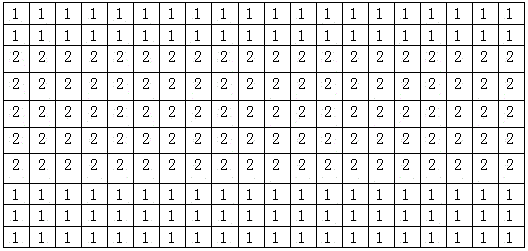
[0066] Step 7:
[0067] If the th row belongs to class, the original data point also divided into Classification of output data points . The classification results are as follows.
[0068]
[...
PUM
 Abstract
Description
Claims
Application Information
 - R&D
- Intellectual Property
- Life Sciences
- Materials
- Tech Scout
- Unparalleled Data Quality
- Higher Quality Content
- 60% Fewer Hallucinations
Browse by: Latest US Patents, China's latest patents, Technical Efficacy Thesaurus, Application Domain, Technology Topic, Popular Technical Reports.
© 2025 PatSnap. All rights reserved.Legal|Privacy policy|Modern Slavery Act Transparency Statement|Sitemap|About US| Contact US: help@patsnap.com


