
Fault diagnosis method based on metric learning and time sequence during industrial process

A metric learning and time-series technology, applied to instruments, electrical testing/monitoring, control/regulation systems, etc., can solve problems such as high system cost, difficulty in distinguishing fault types, and difficulty in online diagnosis, so as to reduce the amount of calculation and improve promotion performance, design and ease of operation

Inactive Publication Date: 2015-12-02
HARBIN INST OF TECH
View PDF6 Cites 21 Cited by
  • Summary
  • Abstract
  • Description
  • Claims
  • Application Information

AI Technical Summary

Problems solved by technology

[0005] The purpose of the present invention is to solve the problems of high system cost, difficult online diagnosis and difficult to distinguish fault types in the existing fault diagnosis methods, and propose a fault diagnosis method based on metric learning and time series in industrial processes

Method used


Image

  • Fault diagnosis method based on metric learning and time sequence during industrial process
  • Fault diagnosis method based on metric learning and time sequence during industrial process
  • Fault diagnosis method based on metric learning and time sequence during industrial process

Examples


specific Embodiment approach 1

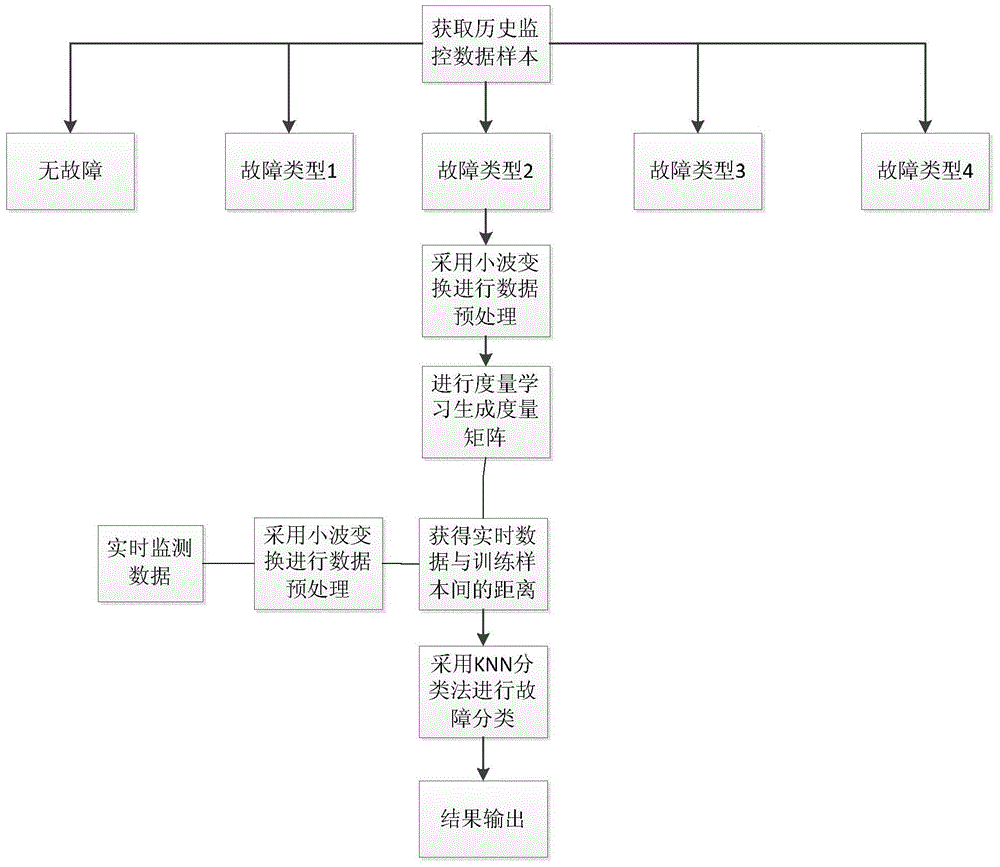
[0023] Embodiment 1: A fault diagnosis method based on metric learning and time series in an industrial process of this embodiment is specifically prepared according to the following steps:

[0024] Step 1: Analyze the historical monitoring data, and divide the system failures into n types, that is, n subclasses, according to the different causes of the system failures;

[0025] Step 2: Collect the standard data under the normal operating conditions of the system and the operating states of n fault operating conditions as training samples;

[0026] Step 3: Preprocessing the training samples by using a time series method; wherein, the preprocessing method refers to using wavelet transform to process the training samples;

[0027] Step 4: Perform metric learning on the preprocessed training samples, and generate a metric matrix of the system as a standard for measuring the similarity of the samples, that is, generate a metric matrix A of the system;

[0028] Step 5. After the r...

specific Embodiment approach 2

[0039] Embodiment 2: The difference between this embodiment and Embodiment 1 is that the metric learning in step 4 is specifically: metric learning focuses on analyzing the differences between data of different fault types, and obtains a metric matrix through training samples, which is used in online fault diagnosis. There are obvious advantages; metric learning realizes the distinction of fault types by obtaining a distance matrix that can accurately describe the similarity of samples;

[0040] (1) Obtain the distance M between all training samples and real-time monitoring samples through metric learning A Expressed as:

[0041] M A = ( x - y ) T A ( x - y ...

specific Embodiment approach 3

[0049] Embodiment 3: The difference between this embodiment and Embodiment 1 or 2 is that a specific iterative process for calculating the metric matrix A by selecting an iterative method based on gradient descent is described as follows:

[0050] (1) Select a pair of constraints (i, j);

[0051] (2) Calculate p=(x i -x j ) T A k (x i -x j );

[0052] (3) When (i,j)∈S, take δ=1, otherwise take δ=-1;

[0053] (4) Calculation a = m i n ( λ i j , δ 2 ( 1 p - γ ξ c ( i , j ...


PUM


Abstract

The present invention relates to a fault diagnosis method based on a metric learning and time sequence during an industrial process for solving the problems that a conventional fault diagnosis method is high in system cost, is difficult for on-line diagnosis, is difficult to distinguish to the fault types, etc. The method is realized by a step 1 of dividing the system faults into n types; a step 2 of preparing a training sample; a step 3 of pre-processing the training sample; a step 4 of carrying out the metric learning on the pre-processed training sample; a step 5 of calculating the distances between a real-time monitoring sample and n subclasses; a step 6 of according to the distances between the real-time monitoring sample and the n subclasses, adopting a KNN classification method to diagnose the faults, namely determining whether a system generates the faults and determining the types of the faults. The fault diagnosis method based on the metric learning and time sequence during the industrial process of the present invention is applied to the fault diagnosis field.

Description

technical field [0001] The invention relates to a fault diagnosis method based on metric learning and time series, in particular to a fault diagnosis method based on metric learning and time series in an industrial process. Background technique [0002] The fault diagnosis system involves steel, boiler, chemical, pharmaceutical and many other fields, and has become an important part of modern industrial production. [0003] Modern industrial processes generally tend to be large-scale and have the characteristics of difficult mechanism modeling. In order to monitor the operating state of the system at all times, many state variables in the production process are often measured for a long time to obtain a large amount of on-site monitoring data. A large amount of monitoring data contains a lot of system operation information, which is of great significance for evaluating the system operation status. However, the variables are often not independent but have a certain correlatio...

Claims


Application Information

Patent Timeline
IPC IPC(8): G05B23/02
CPCG05B23/0213
Inventor 尹珅闫国杨高会军
Owner HARBIN INST OF TECH
Learn More