Oil gas inclusion component sampling method
A technology of inclusions and oil and gas, applied in the field of oil and gas exploration research, can solve the problems of being easily polluted by the outside world and not being able to effectively collect compounds with high carbon numbers, so as to achieve efficient collection, reduce external pollution, and reduce foreign pollutants.
- Summary
- Abstract
- Description
- Claims
- Application Information
AI Technical Summary
Problems solved by technology
Method used
Image
Examples
Embodiment 1
[0037] Steps:
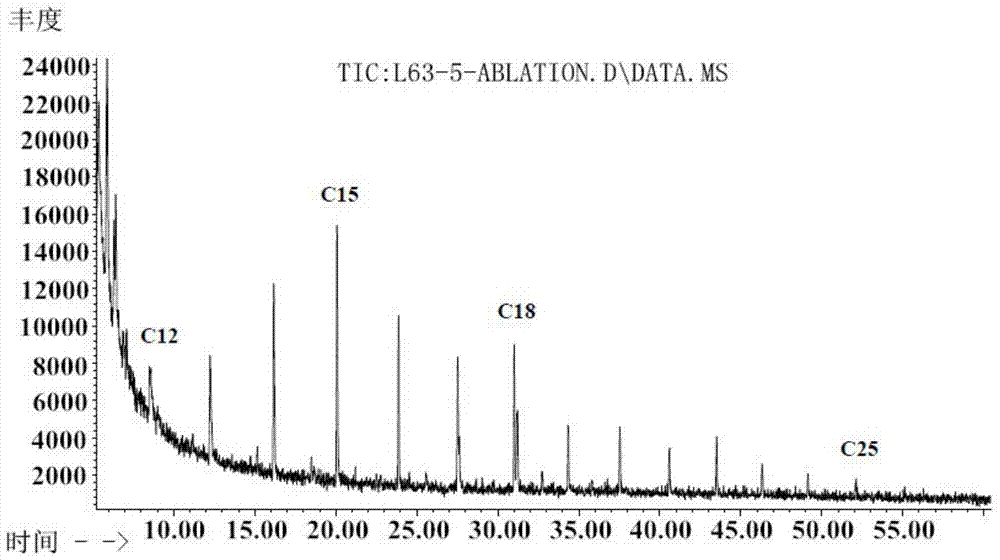
[0038] (1) Take a certain amount of calcite cement sample 1 in the brecciated fracture zone of Well Luo 63 in the Zhanhua Sag, and use a mortar to crush sample 1 into particles with a cross-section smaller than 1mm*1mm, then dry the particles and wash them with a solvent, Remove surface-adsorbed hydrocarbon components.
[0039] (2) Take two quartz capillary square tubes, the inner diameter of the first quartz capillary square tube 4 is 0.7mm*0.7
[0040] mm, the outer diameter is 0.9mm*0.9mm, and the length is about 50mm. The second square quartz capillary tube 2 has an inner diameter of 1mm*1mm, an outer diameter of 1.2mm*1.2mm, and a length of about 60mm. First put the two square tubes into the methylene chloride solvent and soak for 48 hours, then take them out and dry them, then use a hydrogen flame gun to seal one end of the two square tubes, and finally put the two square tubes into the oven and dry them at 100 Bake at ℃ for about 30 minutes to remove m...
Embodiment 2
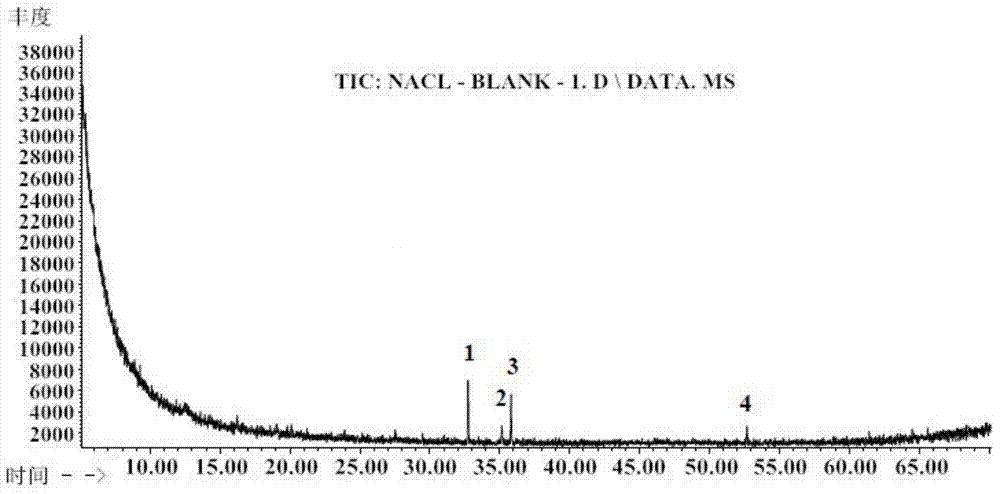
[0047] Another oil and gas inclusion was taken for compositional analysis. Before collecting and analyzing the composition of the inclusion, the background composition of the sample was collected first (that is, except that the main minerals around the inclusion were not denuded, the rest of the operations were similar to the collection of the inclusion composition. components collected under exactly the same conditions) and analyzed, the results are as follows Figure 5 shown.
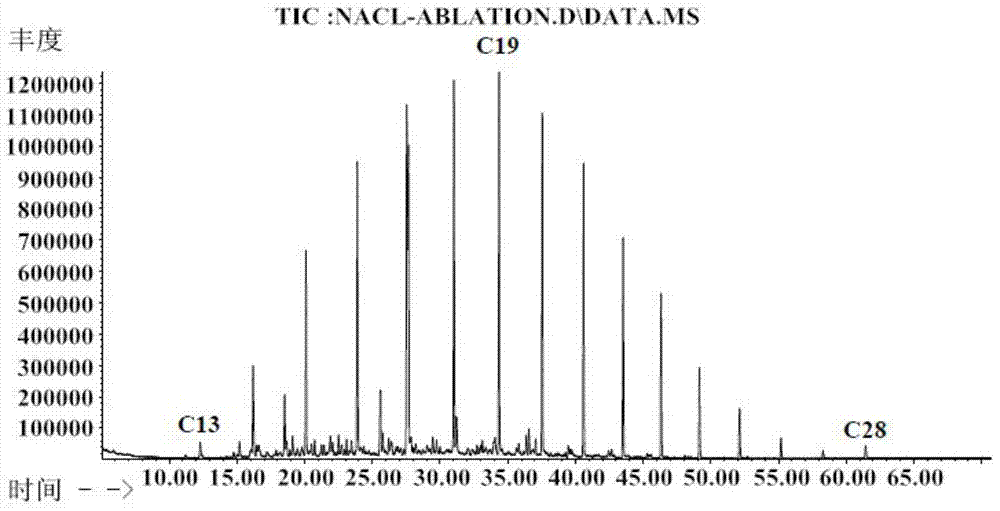
[0048] After collecting and analyzing the background components of the sample, collect and analyze the inclusion components of the same sample (i.e. repeat steps 1-5), and the analysis results are as follows: Figure 6 .
[0049] Depend on Figure 5 and Figure 6 It can be seen from the comparison that the analysis results of the background components no matter in the number of impurity peaks ( Figure 5 The peaks numbered 1 to 4) or in the response intensity ( Figure 5 Among them, the intensity...
PUM
| Property | Measurement | Unit |
|---|---|---|
| diameter | aaaaa | aaaaa |
| diameter | aaaaa | aaaaa |
| length | aaaaa | aaaaa |
Abstract
Description
Claims
Application Information
 - R&D Engineer
- R&D Manager
- IP Professional
- Industry Leading Data Capabilities
- Powerful AI technology
- Patent DNA Extraction
Browse by: Latest US Patents, China's latest patents, Technical Efficacy Thesaurus, Application Domain, Technology Topic, Popular Technical Reports.
© 2024 PatSnap. All rights reserved.Legal|Privacy policy|Modern Slavery Act Transparency Statement|Sitemap|About US| Contact US: help@patsnap.com


