
Customizing system and customizing method for graph real-time monitoring interface based on SVG (Scalable Vector Graphics)

A technology for real-time monitoring and customization of the system, applied in the direction of program control devices, etc., can solve the problems of increased graphics file size, single SVG monitoring graphic element, poor independence, etc., to improve the loading speed, simple interface customization, and improve development efficiency. Effect

Inactive Publication Date: 2013-12-25
BEIJING TIANYUAN SCI & TECH CREATION WINDPOWER TECH
View PDF3 Cites 34 Cited by
  • Summary
  • Abstract
  • Description
  • Claims
  • Application Information

AI Technical Summary

Problems solved by technology

[0020] (2) In the current central monitoring platform, the customization of the monitoring interface is integrated in a functional module under the platform, rather than as an independent configuration tool. The independence is poor, and the configuration steps are cumbersome and complicated
[0021] (3) The SVG monitoring graphic element is single, and it is not conducive to expansion
[0022] (4) The SVG graphics file is too large, and the efficiency of loading files and real-time refresh is low
At present, the display of each data classification in the real-time information monitoring interface of a single fan is realized by hiding or displaying the SVG layer. In fact, all the information is still customized on an SVG graphic file. For a long time, the size of the graphics file will also increase, resulting in lower file loading and refresh efficiency
[0023] (5) It is not conducive to the clear division of labor between engineers and developers
[0024] It can be seen that the above-mentioned existing SVG monitoring interface customization process has inconvenience and deficiencies in system composition and use, and needs to be further improved urgently

Method used


Image

  • Customizing system and customizing method for graph real-time monitoring interface based on SVG (Scalable Vector Graphics)
  • Customizing system and customizing method for graph real-time monitoring interface based on SVG (Scalable Vector Graphics)
  • Customizing system and customizing method for graph real-time monitoring interface based on SVG (Scalable Vector Graphics)

Examples


Embodiment Construction

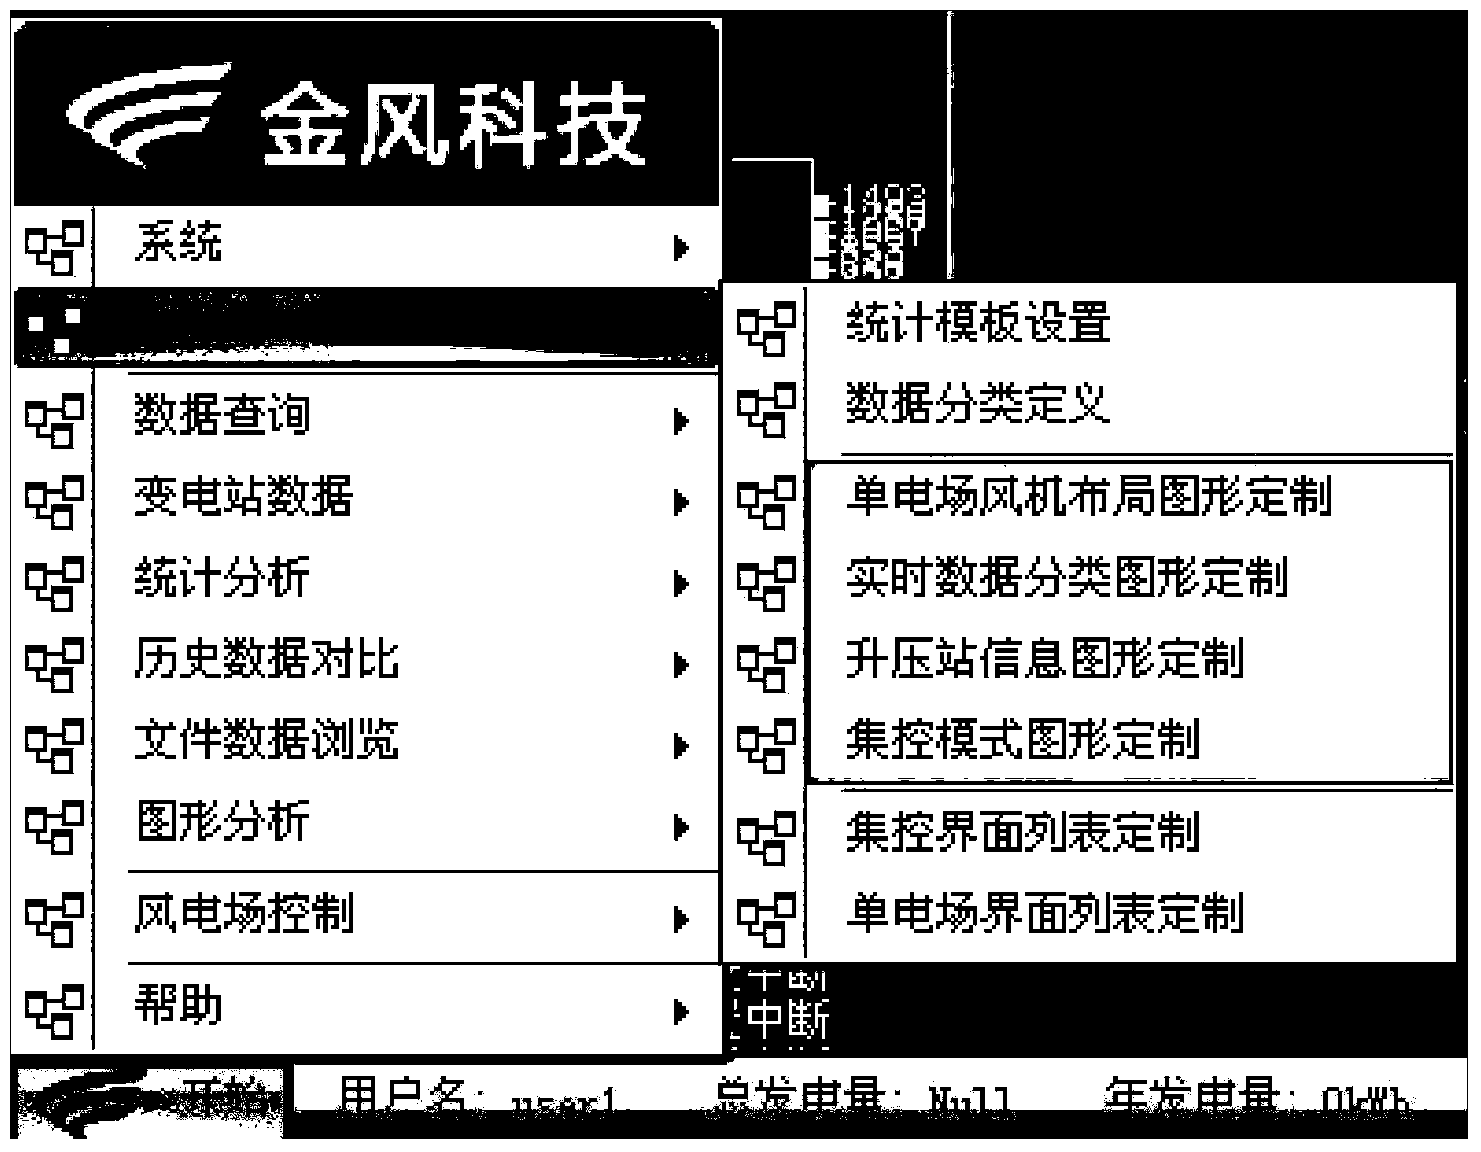
[0052] see Figure 6 , Figure 7 As shown, the SVG-based graphical real-time monitoring interface customization system of the present invention includes a file management module, a graphics editing management module, a basic graphics drawing module, a graphic element editing management module, a monitoring interface management module, a configuration item management module, a canvas management module, and a view Interface management module and help system module.

[0053] The file management module provides users with file management operations, including new, open, open recent file, save, save as, export image, export primitive, export SVG file, close file and other operation functions, and also provides print, exit System-wise features.

[0054] The graphics editing management module mainly provides graphics editing functions, including copy, paste, cut, delete, undo, redo, select all, cancel all selection, graphics lock and unlock, graphics grouping and ungrouping, graphi...


PUM


Abstract

The invention relates to a customizing system and a customizing method for a graph real-time monitoring interface based on SVG (Scalable Vector Graphics). The customizing system comprises a monitoring system, a SVG graph configuration tool and a graph and information storage system, wherein the SVG graph configuration tool comprises a file manager, a graph editing manager, a basic graph drawer, a pixel editing manager, a monitoring interface manager, a configuration project manager, a canvas manager, a view interface manager and a help system module. The customizing method comprises the following steps: establishing a new project and a file and configuring environmental parameters; selecting graphs in a local configuration library or selecting a pixel from a pixel library or drawing the pixel and generating the graph; editing the graph, associating data points and distributing the interface; checking the SVG graph file and configuration information; issuing the graph, interacting with the local configuration library and generating the SVG graph file and corresponding configuration information; and delivering to the monitoring system. The customizing system and the customizing method provided by the invention can be utilized to increase the flexibility, universality, expandability and adaptability of a monitoring service.

Description

technical field [0001] The invention relates to an interface customization system and method, in particular to an SVG-based graphical real-time monitoring interface customization system and a customization method thereof. Background technique [0002] SVG (Scalable Vector Graphics, Scalable Vector Graphics) is an XML-based scalable two-dimensional vector graphics format formulated by the W3C organization. Its XML-based syntax and structure make it have inherent advantages, and it is different from existing and future ones. There is a natural integration among other XML applications, and it has been widely used in real-time monitoring fields such as energy, electric power, mines, and railways, and has broad application prospects. The advantages of the SVG graphic format are: (1) Based on XML; (2) Use text to describe objects; (3) Interactive and dynamic; (4) Fully support DOM; (5) Stepless scaling without distortion. Because of this, the central monitoring platform of the in...

Claims


Application Information

Patent Timeline
IPC IPC(8): G06F9/44
Inventor 马生龙万华
Owner BEIJING TIANYUAN SCI & TECH CREATION WINDPOWER TECH
Learn More