A method to maintain the signal-to-noise ratio and improve the resolution of seismic records
A seismic recording and resolution technology, applied in the field of oil and gas geophysical seismic exploration
- Summary
- Abstract
- Description
- Claims
- Application Information
AI Technical Summary
Problems solved by technology
Method used
Image
Examples
Embodiment 1
[0080] Embodiment 1: Taking a method for maintaining the signal-to-noise ratio and improving the resolution of seismic records as an example, the present invention will be further described in detail.
[0081] Step A: artificially stimulate seismic waves, use a geophone to detect reflected seismic signals from the ground, and record them on a magnetic tape. The specific field acquisition configuration of this embodiment is that 7 measuring lines are received at the same time, each measuring line has 240 traces, the distance between traces is 50 meters, the distance between lines is 100 meters, the recording length is 7 seconds, and the sampling interval is 1 millisecond. gun.
[0082] Step B, read the seismic signal from the magnetic tape, perform conventional seismic signal processing such as noise suppression, deconvolution, velocity analysis, and migration on the seismic signal, and obtain the seismic record x after conventional processing i (t). For earthquake records x ...
Embodiment 2
[0099] This embodiment is an application example of block B of an oilfield. The exploration target layer is a fracture-cavity carbonate oil and gas reservoir with a relatively large buried depth of about 7,000 meters. The surface is covered by sand dunes, the near-surface absorption and scattering are relatively serious, and the signal-to-noise ratio and resolution are low. It is necessary to improve the resolution of seismic records while maintaining the signal-to-noise ratio.
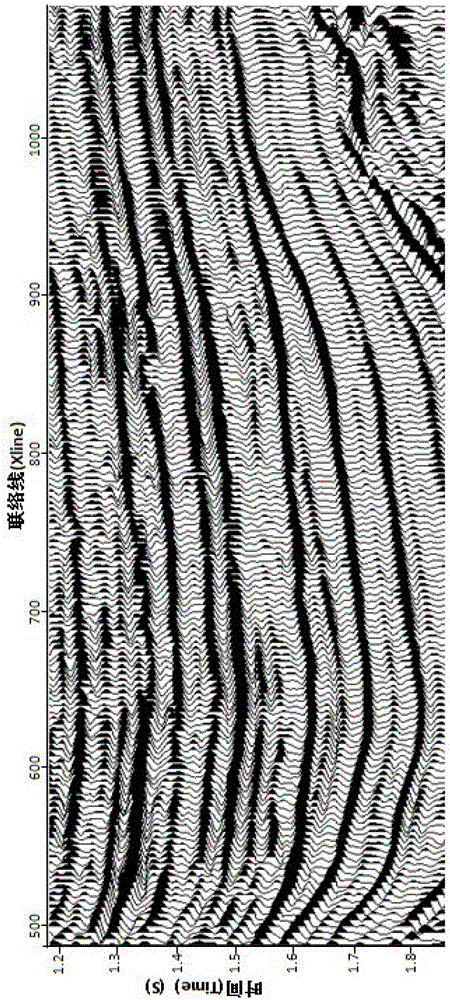
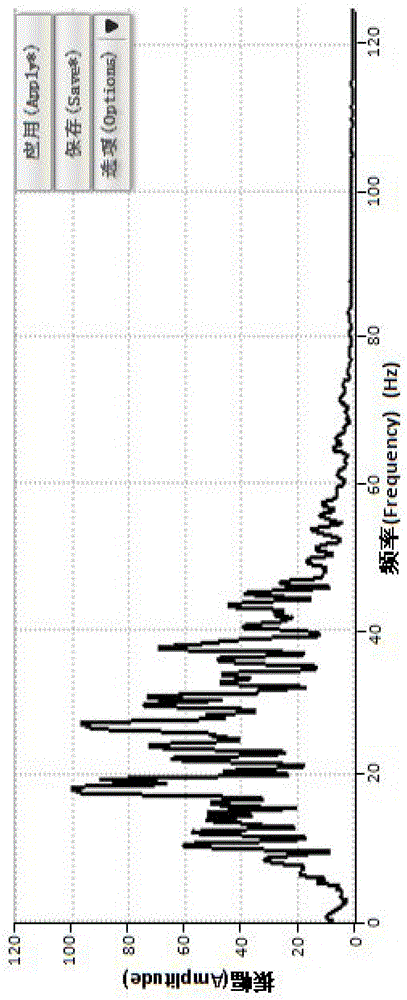
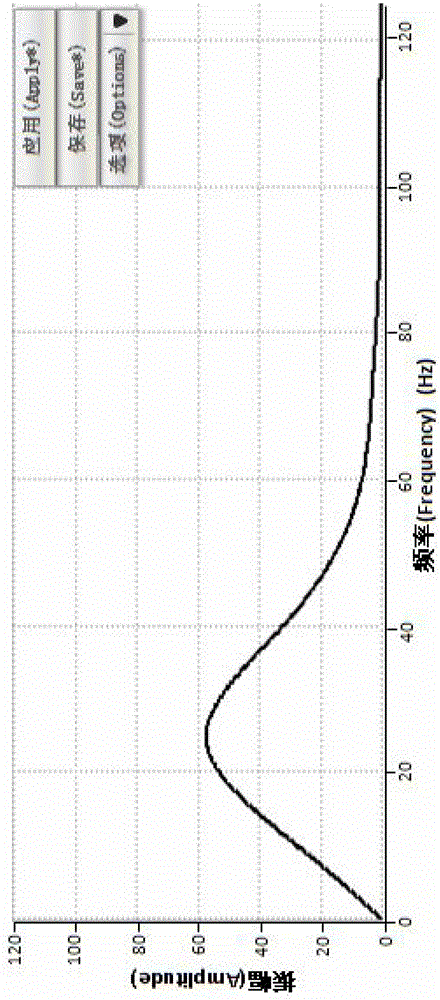
[0100] Image 6 is the profile image of the seismic record after conventional processing. Figure 7 is the average amplitude spectrum of the seismic record, and it can be seen that the high-frequency energy is weak due to the influence of formation absorption. Figure 8 is the seismic wavelet amplitude spectrum estimated from the seismic record amplitude spectrum. Figure 9 is the signal purity spectrum, the signal purity above 60Hz is very low, most of its energy is occupied by noise. Figure 10 I...
Embodiment 3
[0102] This example is an application example of block C. The exploration target layer is a thin interbedded oil and gas reservoir of sand and mudstone sandwiched by complex fault blocks. The thickness of a single sand body is less than 10 meters, and the thickness of a sand layer group is about 30 meters. The signal-to-noise ratio and resolution requirements of the data are high.
[0103] Figure 11 It is a seismic section image after conventional processing, and its resolution is low, which cannot meet the geological requirements of complex fault-block sand body prediction. Figure 12 Seismic cross-sectional image processed by the present invention, and Figure 11 In contrast, the overall quality of the seismic profile has been significantly improved, and the structural relationship and geological characteristics within the sand group, between sand groups, and between different fault block sand bodies are clearer and more reliable, which is of great importance for fine rese...
PUM
 Abstract
Description
Claims
Application Information
 - R&D
- Intellectual Property
- Life Sciences
- Materials
- Tech Scout
- Unparalleled Data Quality
- Higher Quality Content
- 60% Fewer Hallucinations
Browse by: Latest US Patents, China's latest patents, Technical Efficacy Thesaurus, Application Domain, Technology Topic, Popular Technical Reports.
© 2025 PatSnap. All rights reserved.Legal|Privacy policy|Modern Slavery Act Transparency Statement|Sitemap|About US| Contact US: help@patsnap.com


