Sea surface oil spilling segmentation method based on polarized SAR (synthetic aperture radar) data fusion
A sea oil spill and data technology, applied to instruments, character and pattern recognition, computer components, etc., can solve the problem of SAR image not being universal
- Summary
- Abstract
- Description
- Claims
- Application Information
AI Technical Summary
Problems solved by technology
Method used
Image
Examples
Embodiment 1
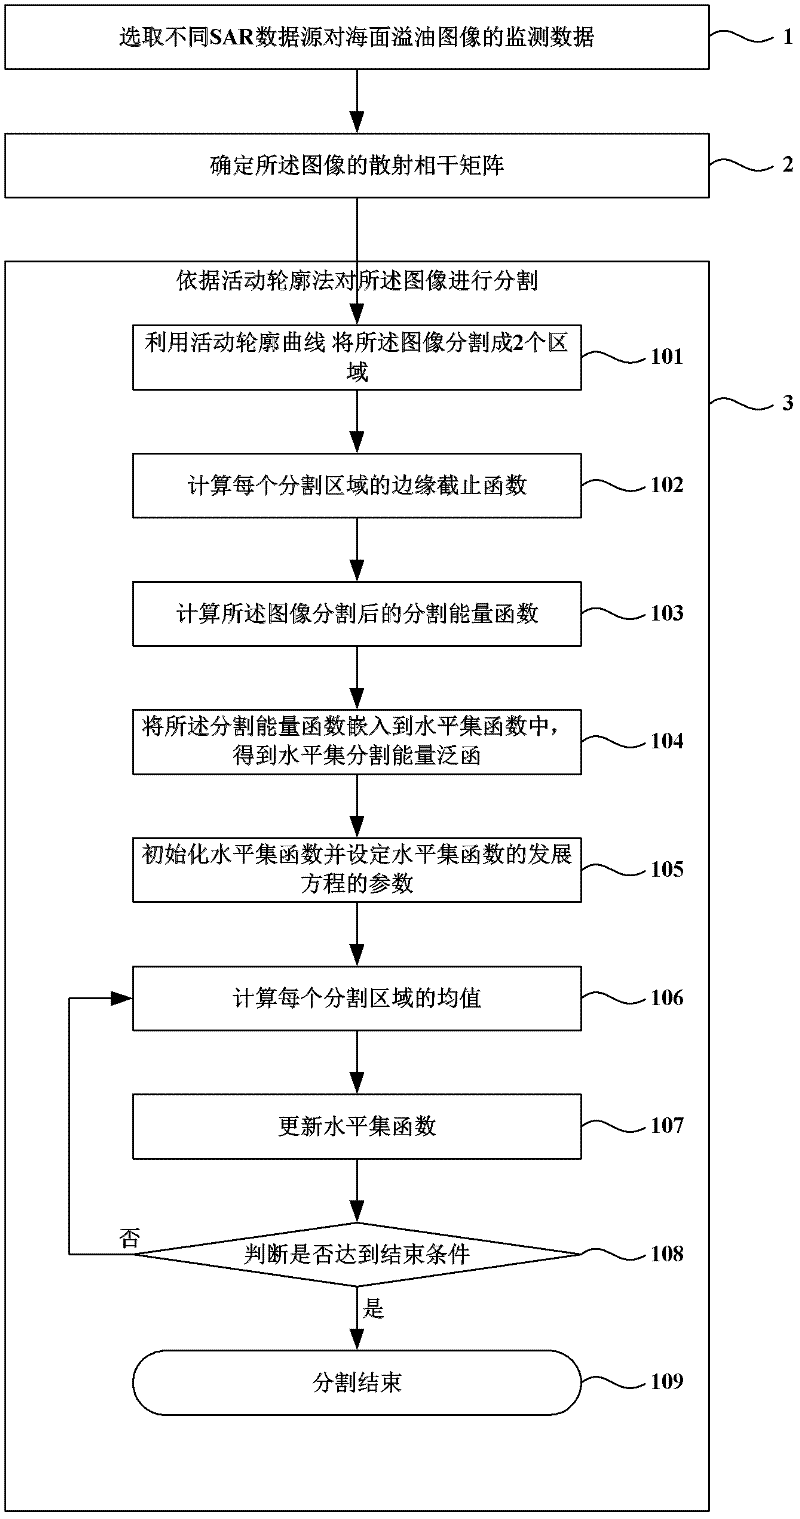
[0048] figure 1 It is a flow chart of the sea surface oil spill segmentation method based on polarimetric SAR data fusion. figure 1 Among them, the sea surface oil spill segmentation method based on polarization SAR data fusion provided by the present invention includes:
[0049] Step 1: Select the sea oil spill image monitoring data from different synthetic aperture radar data sources.
[0050] Step 2: Determine the scattering coherence matrix of the image.
[0051] Synthetic Aperture Radar (SAR) emits an electromagnetic wave, and the measured value of the target observation is included in the radar backscattered wave. Due to the influence of coherent speckle noise (Speckle), the single-view SAR intensity image obeys a negative exponential distribution. The multi-look SAR intensity image σ obeys the Gamma distribution, denoted as G(·) is a Gamma function, and
[0052] P ( σ ) = ...
Embodiment 2
[0105] The implementation process of the present invention is described below with an actual sea surface oil spill image simulation data.
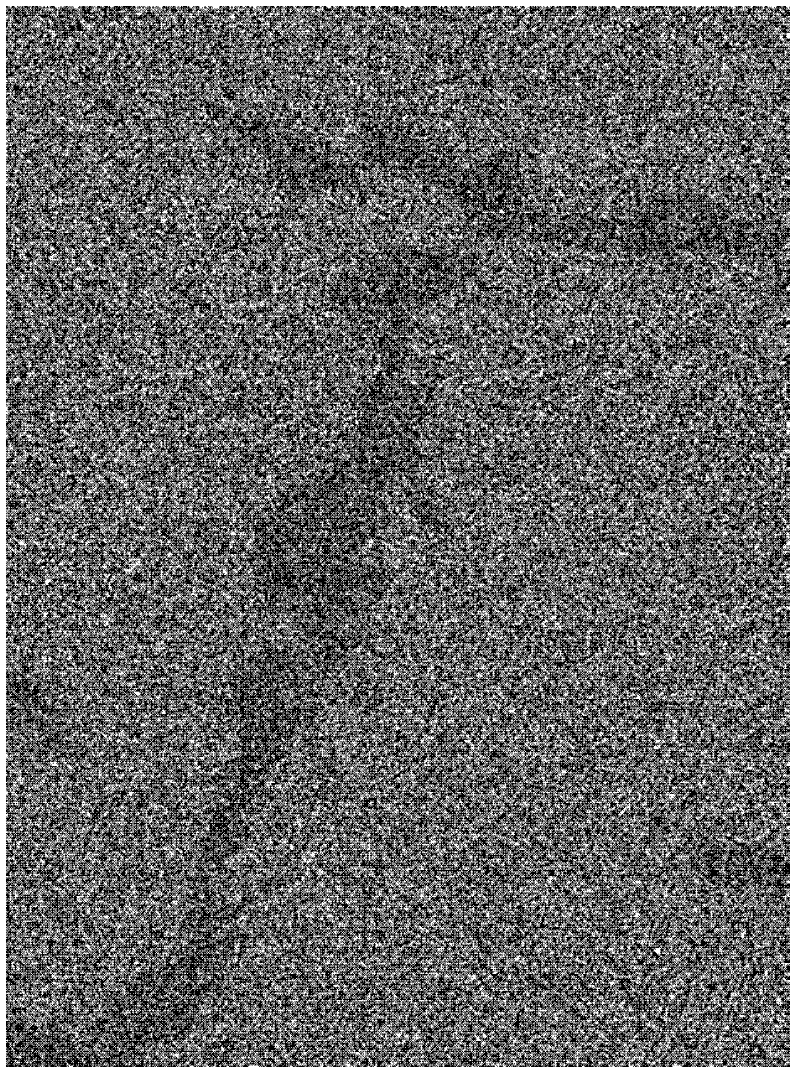
[0106] Step 201: figure 2 The total power map of the simulated oil film data is given, the size of the image is 571×421, and the backscatter coefficients of the sea surface and oil film are respectively
[0107] [|S HH | 2 2|S HV | 2 |S VV | 2 ] oil =[0.0031 5.3598×10 -4 0.0047]
[0108] (1)
[0109] [|S HH | 2 2|S HV | 2 |S VV | 2 ] sea =[0.0048 5.7513×10 -4 0.0093]
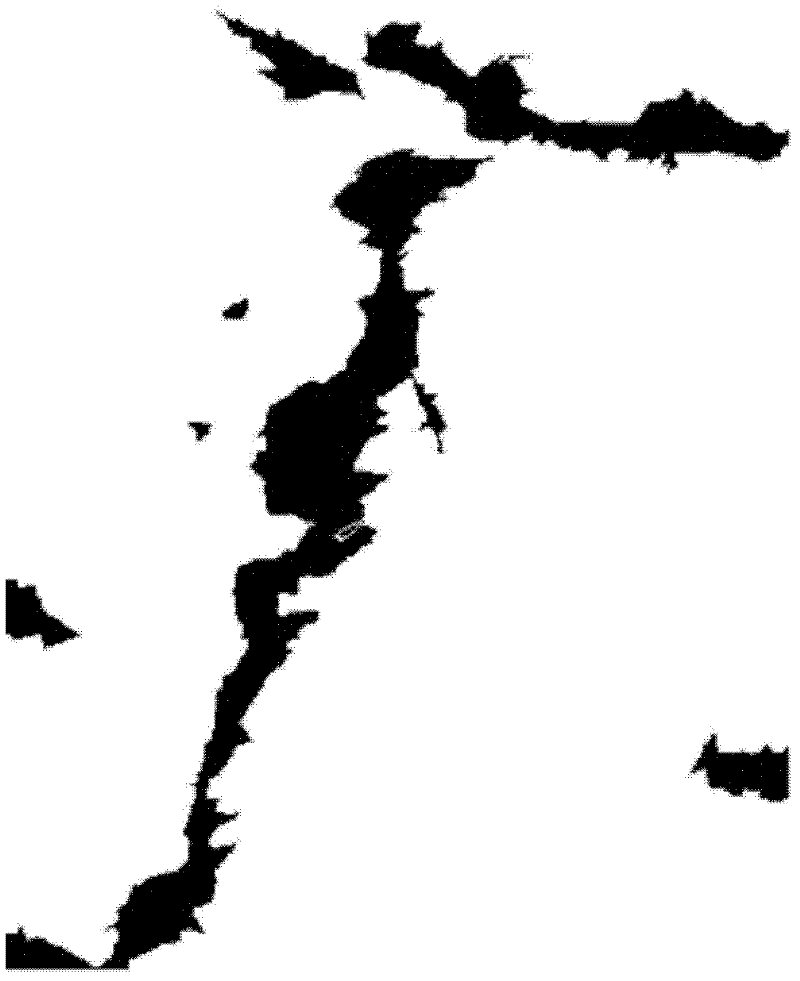
[0110] The shape of the oil film in this simulation image is selected from the shape of the oil spill obtained by the real ASAR sensor. For the specific shape of the oil spill, see image 3 shown. In this implementation case, the applied data sources are three sets of single-polarization SAR intensity data, |S HH | 2 ,|S HV | 2 and|S VV | 2 ; Intensity fusion data of two sets of dual-pol...
PUM
 Abstract
Description
Claims
Application Information
 - R&D
- Intellectual Property
- Life Sciences
- Materials
- Tech Scout
- Unparalleled Data Quality
- Higher Quality Content
- 60% Fewer Hallucinations
Browse by: Latest US Patents, China's latest patents, Technical Efficacy Thesaurus, Application Domain, Technology Topic, Popular Technical Reports.
© 2025 PatSnap. All rights reserved.Legal|Privacy policy|Modern Slavery Act Transparency Statement|Sitemap|About US| Contact US: help@patsnap.com


