Pixel type based objective assessment method of image quality by utilizing structural similarity
An objective evaluation method and technology of image quality, applied in image analysis, image data processing, instruments, etc., can solve problems such as lack of stability, poor effect, and no consideration of human eyes.
- Summary
- Abstract
- Description
- Claims
- Application Information
AI Technical Summary
Problems solved by technology
Method used
Image
Examples
Embodiment 1
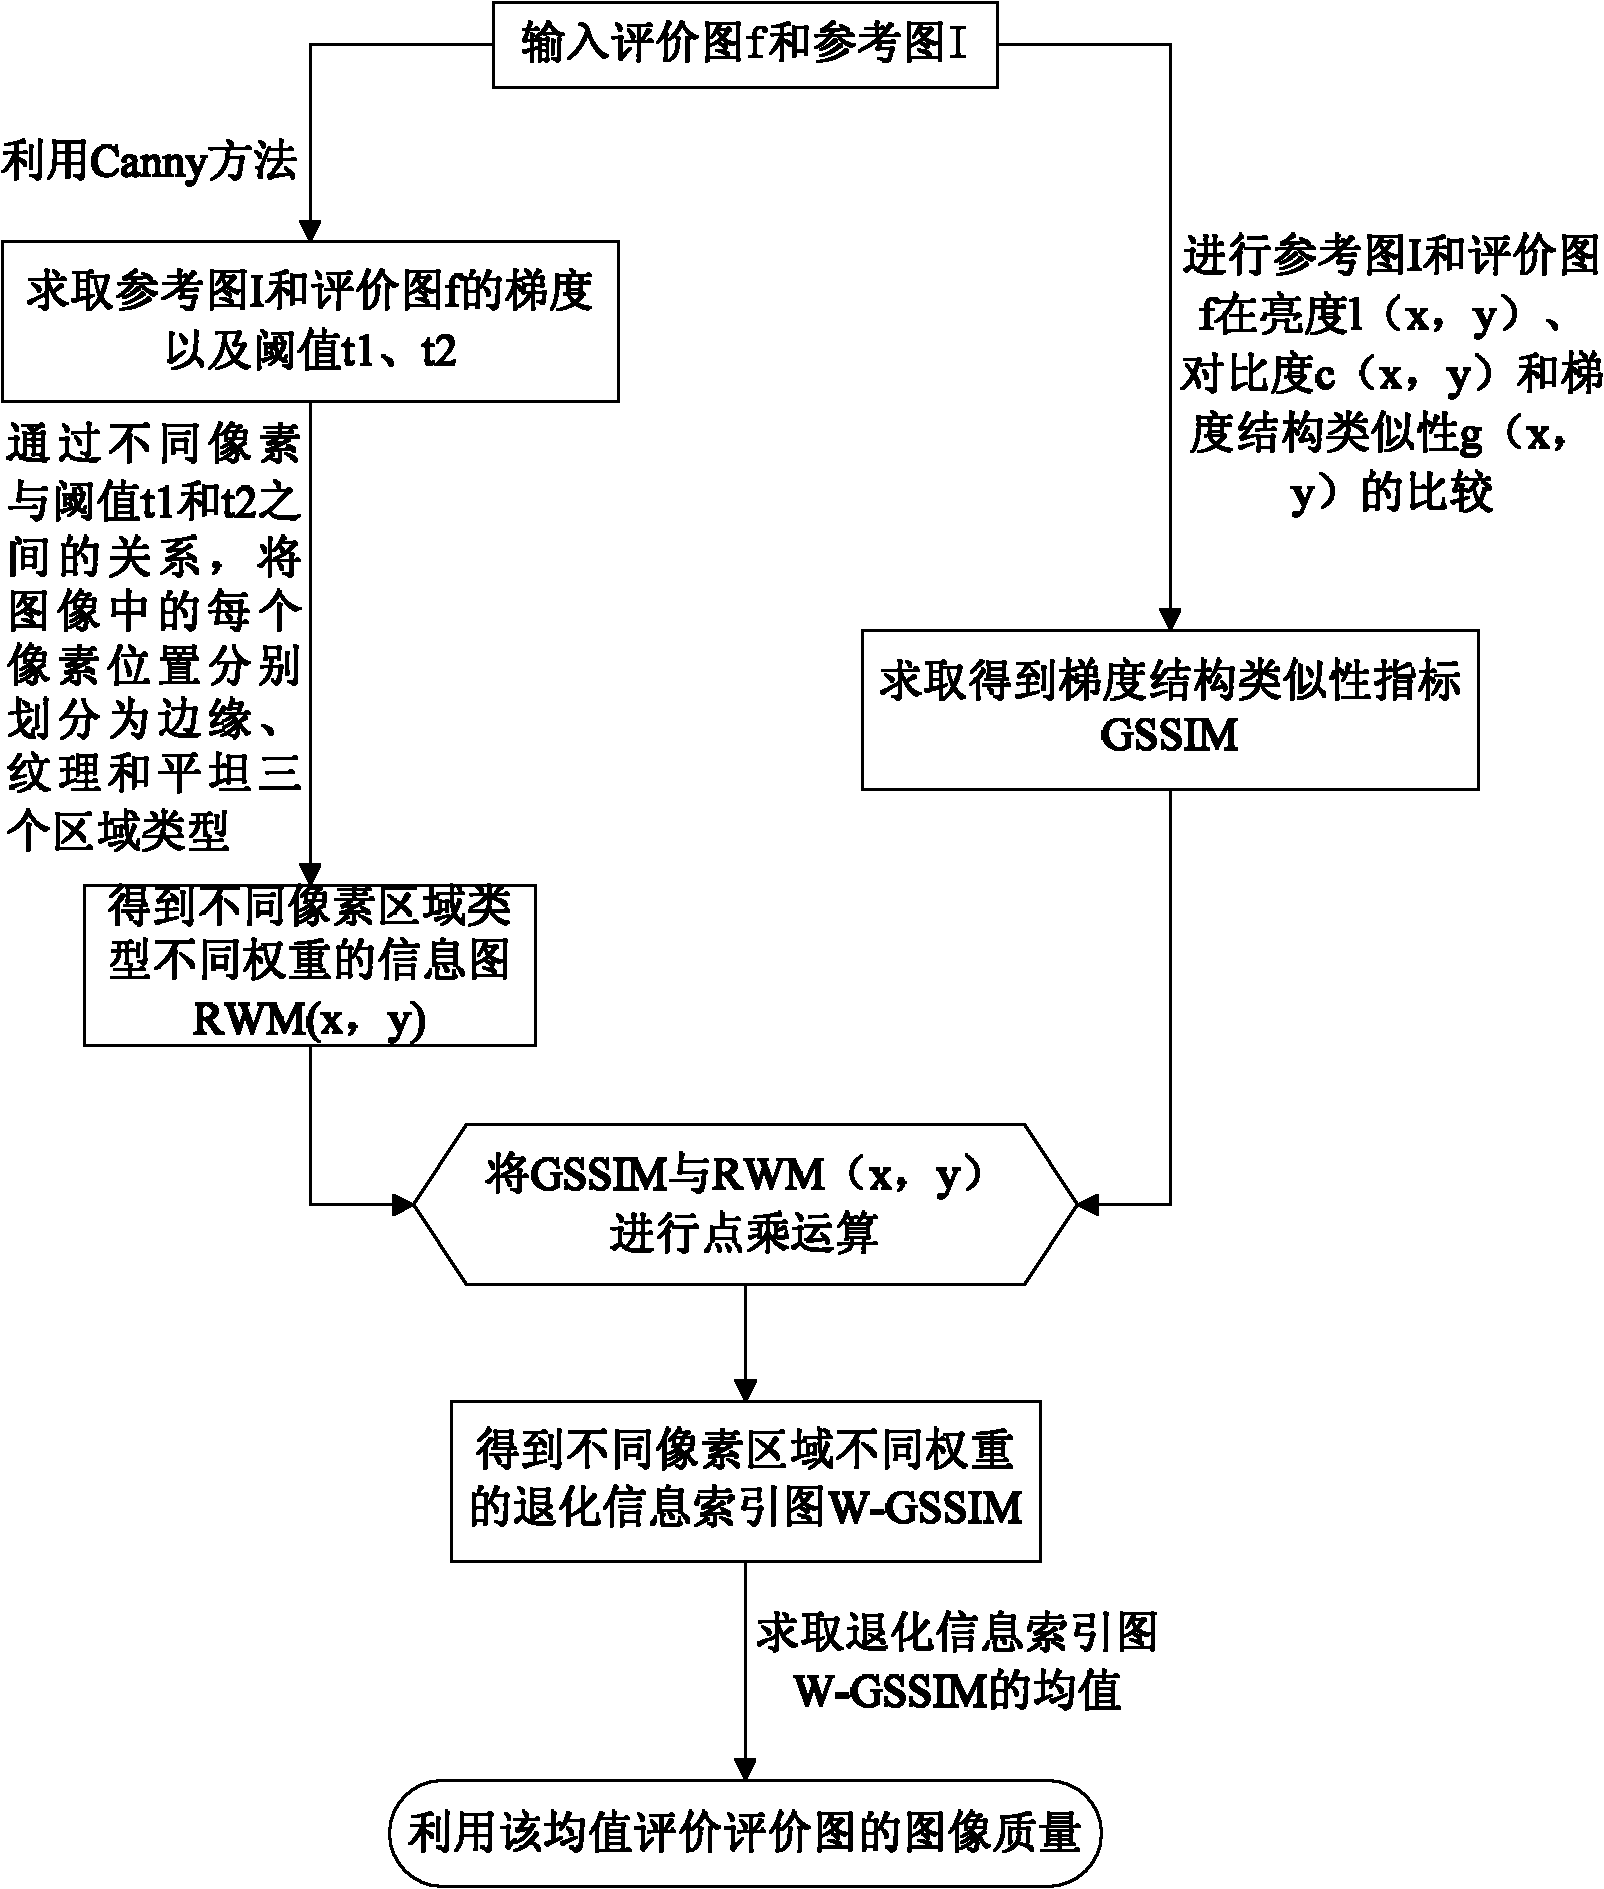
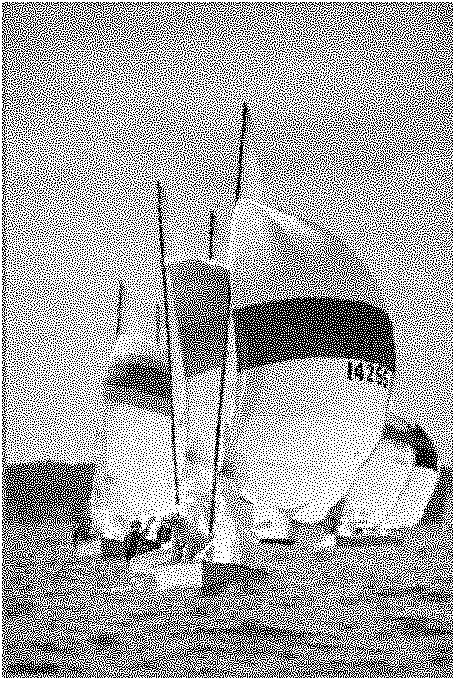
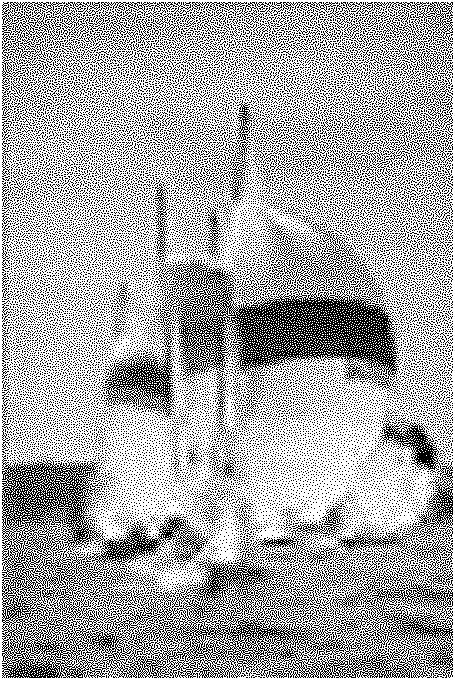
[0072] The flow chart of image processing by the evaluation method of the present invention is as follows: figure 1 As shown, the evaluation value of the image quality can be obtained by inputting the reference image and the evaluation image. by Figure 2a As a reference to Figure I and Figure 2b As an example of the evaluation chart f, the process of the evaluation method of the present invention is described in detail:
[0073] (1) Obtain the information graph RWM with different weights of different pixel area types in the image:
[0074] Will Figure 2a shown in reference figure I and Figure 2b The evaluation graph f shown in the input;
[0075] Calculate the gradient G of the reference image I using the canny method I (x, y), and at the same time obtain two thresholds t1 and t2 that represent the strong and weak boundaries of the image gradient value, t1>t2; also use the canny method to obtain the gradient G of the evaluation map f (the final image to be evaluated)...
Embodiment 2
[0104] According to the same method in Example 1, respectively Figure 3a~3h make an evaluation, Figure 3a~3h A set of grayscale images (reference image and different degradation form images) shown is the reference image used in the experiment ( Figure 3a ) and evaluation graph ( Figure 3b~3h ), and the evaluation results are shown in Table 1. in Figure 3a Figure 3a For reference figure, Figure 3b is the mean shift plot, Figure 3c For comparison stretching diagram, Figure 3d is the salt and pepper noise map, Figure 3e is the multiplicative speckle noise map, Figure 3f is additive Gaussian noise, Figure 3g is the fuzzy graph, Figure 3h Compressed image for JPEG. The larger the W-GSSIM evaluation value in Table 1, the better the image quality. The reference figure is Figure 3(a); from the test results in Table 1, it can be seen that the evaluation method of the present invention is basically consistent with human observation.
[0105] Table 1
[0106] ...
PUM
 Abstract
Description
Claims
Application Information
 - R&D
- Intellectual Property
- Life Sciences
- Materials
- Tech Scout
- Unparalleled Data Quality
- Higher Quality Content
- 60% Fewer Hallucinations
Browse by: Latest US Patents, China's latest patents, Technical Efficacy Thesaurus, Application Domain, Technology Topic, Popular Technical Reports.
© 2025 PatSnap. All rights reserved.Legal|Privacy policy|Modern Slavery Act Transparency Statement|Sitemap|About US| Contact US: help@patsnap.com


