Brass anticorrosion corrosion inhibitor
A corrosion inhibitor and anti-corrosion technology, applied in the field of corrosion and protection of metal materials to achieve good corrosion inhibition effect
- Summary
- Abstract
- Description
- Claims
- Application Information
AI Technical Summary
Problems solved by technology
Method used
Image
Examples
Embodiment 1
[0027] A kind of anti-corrosion corrosion inhibitor for brass
[0028] The solute is polyepoxysuccinic acid, the solvent is deionized water, and the final concentration is 0mg / L, 1mg / L, 2mg / L, 5mg / L, and 10mg / L PESA single compound corrosion inhibitor.
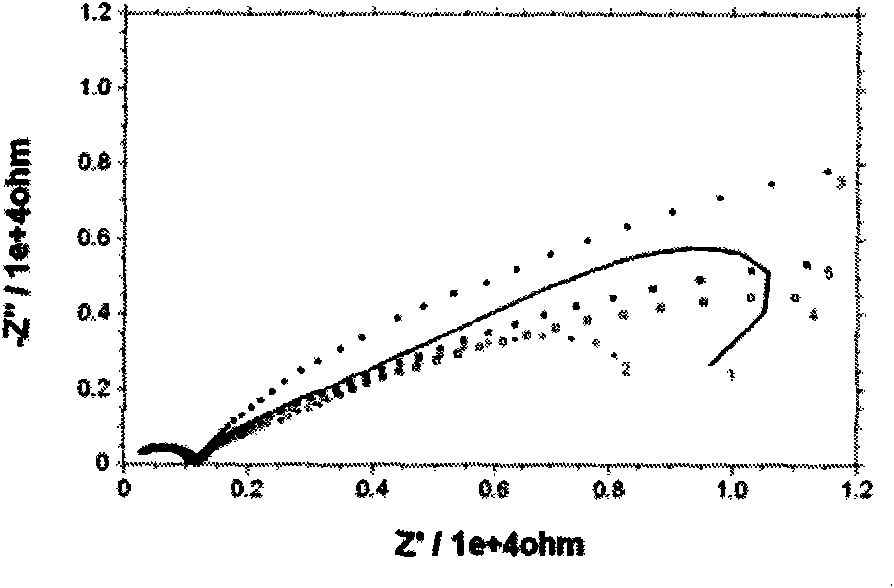
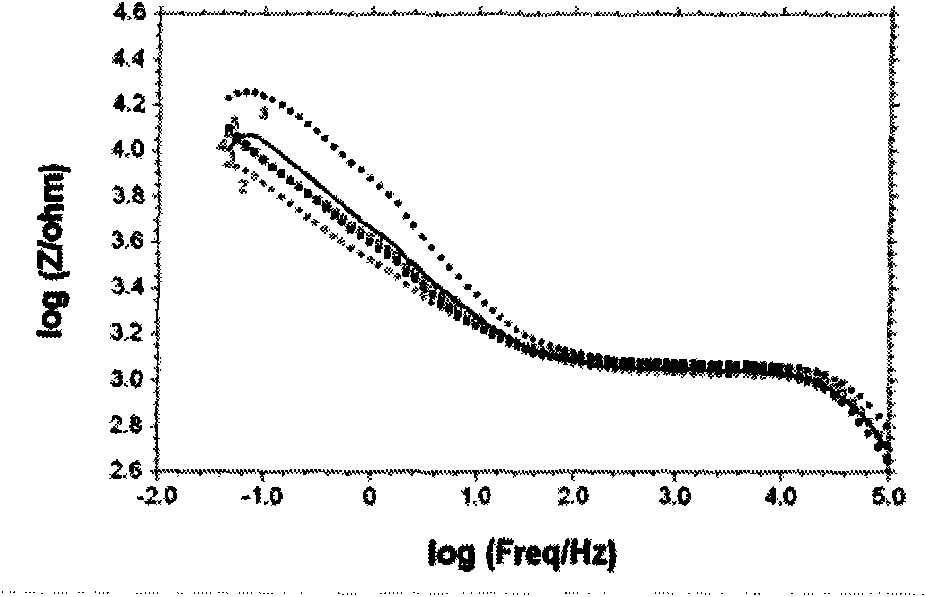
[0029] Corrosion inhibition effect of PESA single compound corrosion inhibitor on brass in simulated water see attached figure 1 And attached figure 2 .
[0030] In the measurement of AC impedance, the blank means that the simulated aqueous solution is used as the medium, and the addition amount of the corrosion inhibitor is 0mg / L.
[0031] attached figure 1 And attached figure 2 It is the Nyquist diagram and Bode diagram measured after the brass electrode was soaked in the simulated aqueous solution containing different concentrations of PESA for 0.5h, in which curve 1, curve 2, curve 3, curve 4 and curve 5 respectively represent polyepoxysuccinic acid (PESA ) are Nyquist plots and Bode plots at 0 mg / L, 1 mg / L, 2 mg / L,...
Embodiment 2
[0042] A kind of anti-corrosion corrosion inhibitor for brass
[0043] The solute is polyepoxysuccinic acid, ZnSO4 and Na 2 SiO 3 , the solvent is deionized water, and 6 groups of brass anti-corrosion and corrosion inhibitors are configured. The concentration of PESA in each group of brass anti-corrosion corrosion inhibitors is 2mg / L, ZnSO 4 The concentration is 5mg / L, and Na 2 SiO 3 The concentrations are 0mg / L, 10mg / L, 20mg / L, 30mg / L, 40mg / L, 50mg / L.
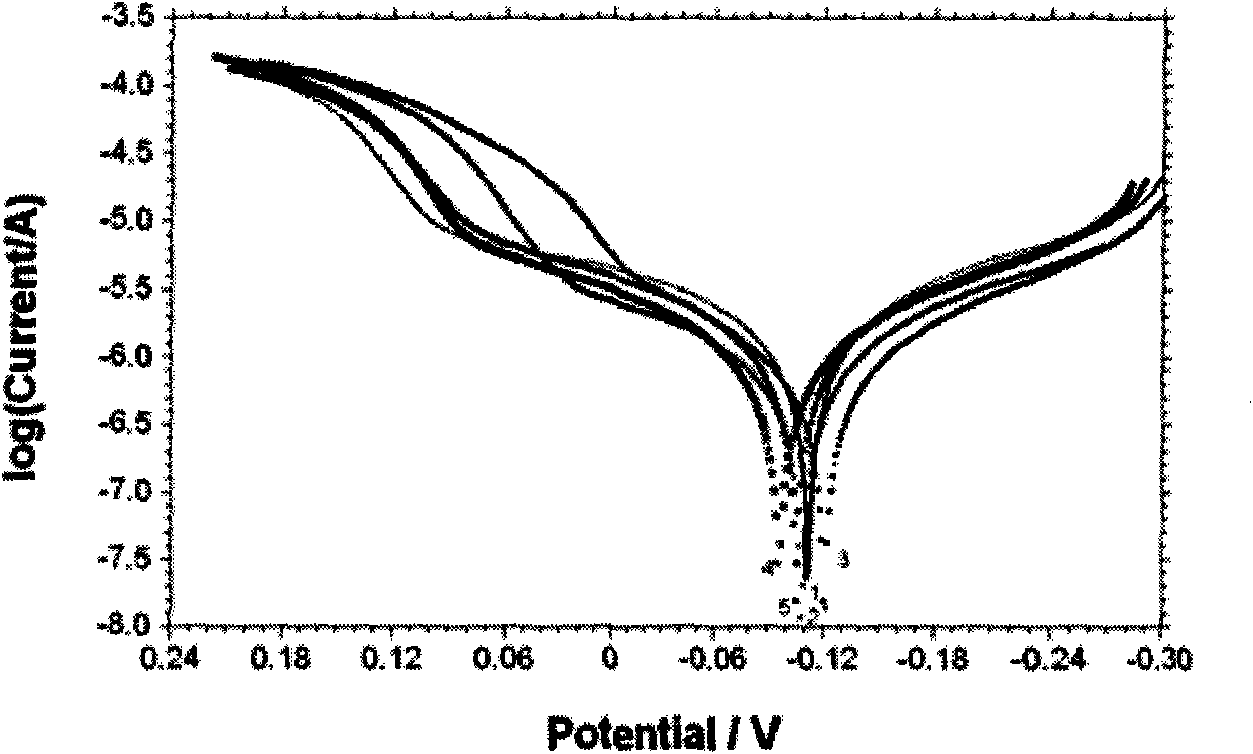
[0044]The corrosion inhibition effect of brass anti-corrosion and corrosion inhibitor on brass in simulated water is shown in the appendix Figure 4 And attached Figure 5 .
[0045] attached Figure 4 And attached Figure 5 Is in 2mg / L PESA, 5mg / LZnSO 4 Add different concentrations of Na to the simulated water 2 SiO 3 The obtained Nyquist diagram and Bode diagram, in which curve 1, curve 2, curve 3, curve 4 and curve 5 respectively represent Na 2 SiO 3 Nyquist plot and Bode plot at concentrations of 0mg / L, 10mg / ...
PUM
| Property | Measurement | Unit |
|---|---|---|
| concentration | aaaaa | aaaaa |
| concentration | aaaaa | aaaaa |
| concentration | aaaaa | aaaaa |
Abstract
Description
Claims
Application Information
 - Generate Ideas
- Intellectual Property
- Life Sciences
- Materials
- Tech Scout
- Unparalleled Data Quality
- Higher Quality Content
- 60% Fewer Hallucinations
Browse by: Latest US Patents, China's latest patents, Technical Efficacy Thesaurus, Application Domain, Technology Topic, Popular Technical Reports.
© 2025 PatSnap. All rights reserved.Legal|Privacy policy|Modern Slavery Act Transparency Statement|Sitemap|About US| Contact US: help@patsnap.com


