Eureka AIR delivers breakthrough ideas for toughest innovation challenges, trusted by R&D personnel around the world.

Volume analysis and display of information in optical coherence tomography angiography

a technology volume analysis, applied in the field of optical coherence tomography (oct) imaging methods and image processing, can solve problems such as difficult interpretation, segmentation errors can obscure important disease-related information, and segmentation algorithms developed for healthy tissue do not work properly for diseased tissu

Active Publication Date: 2017-07-25
SPAIDE RICHARD F
View PDF2 Cites 179 Cited by
  • Summary
  • Abstract
  • Description
  • Claims
  • Application Information

AI Technical Summary

Benefits of technology

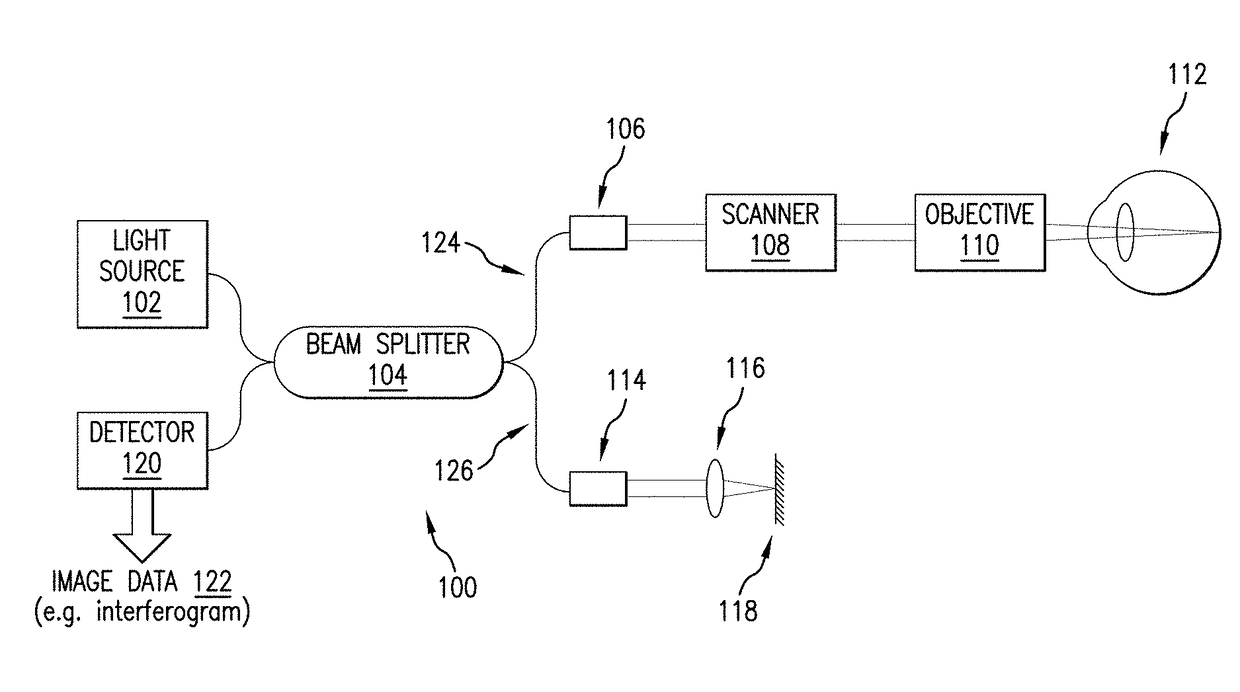
[0043]A cross sectional OCT image of the retina allows clinicians to evaluate pathology of the eye in vivo. As successively newer OCT instruments have been developed the scan speed has increased. A common unit of measurement of speed of scanning is the A-scan rate, in which an A-scan is a one dimensional representation of reflectance information obtained by a line intersecting tissue. In the case of OCT, the backscatter intensity is measured at discrete points along a line, which in summation produces the A-scan. The A-scan rate of early devices was measured in the hundreds per second and modern commercial instruments can produce up to 100,000 A-scans per second. Many A-scans in a plane produce a B-scan. Successive planes of scans form a three dimensional block of information. The large size of the data set obtained increases the challenge to evaluate the data. It is also possible to slice across the three dimensions of data in any arbitrary direction to extract planes of information that can be evaluated.
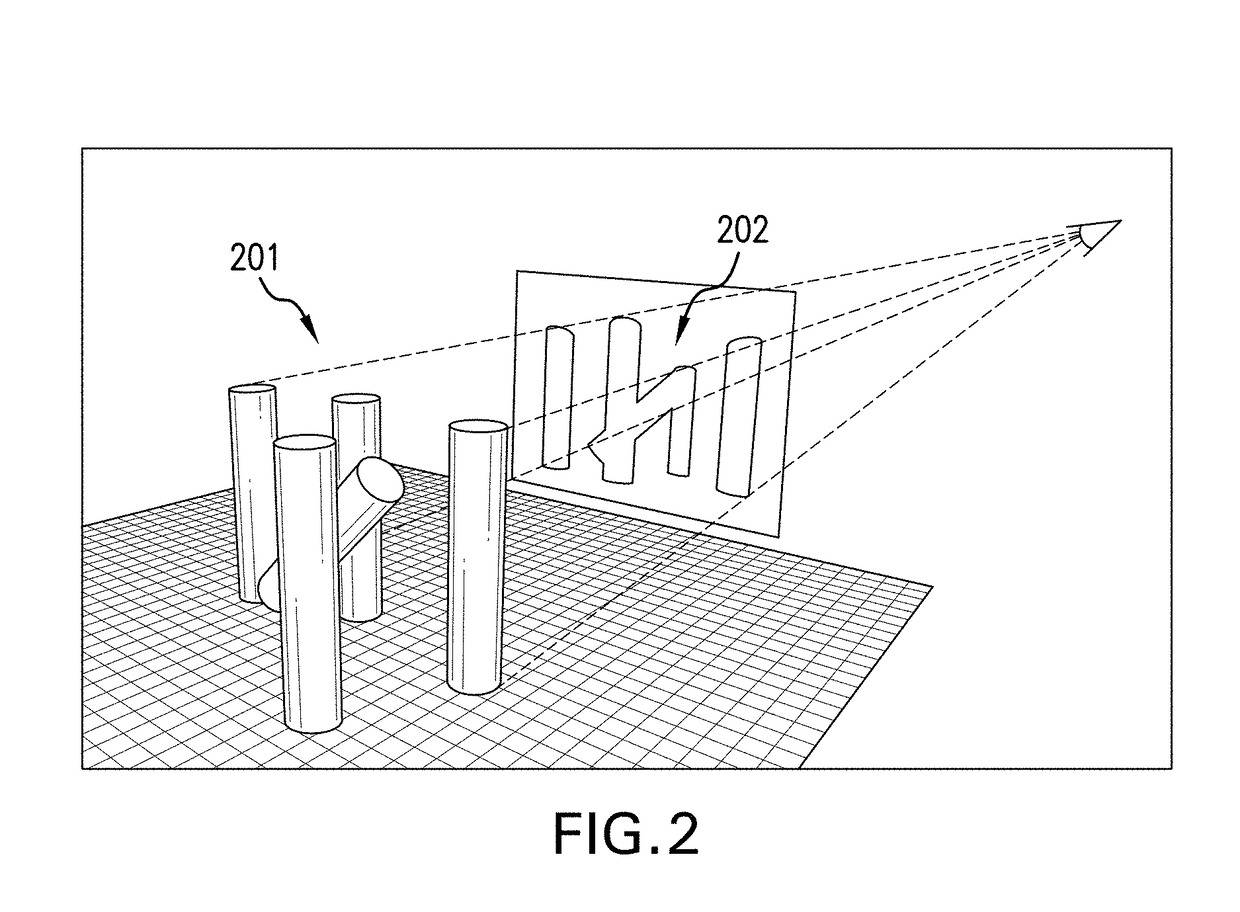
[0074]In one embodiment, the transparency of the volume rendered image may be modified according to local vascular density and perfusion data. The tissue, the flow information or any combination may be displayed in a manner to visualize depth information through the tissue sampled. This can include the use of 3D monitors or anaglyph representations. Areas of pathology may be color coded. The transparency can be varied by layer or depth. For example, to be able to see deeper layers we can increase the transparency of the overlying layers.

Problems solved by technology

The retina is a curved structure, and the flat planes initially produced in OCT slice across many layers, making interpretation difficult.
Segmentation algorithms developed for healthy tissue do not work properly for diseased tissue, which may be abnormal in many different ways that are difficult to anticipate in a segmentation algorithm.
While segmentation can be useful in a healthy eye, segmentation errors can obscure important disease-related information.

Method used


Image

  • Volume analysis and display of information in optical coherence tomography angiography
  • Volume analysis and display of information in optical coherence tomography angiography
  • Volume analysis and display of information in optical coherence tomography angiography

Examples


Embodiment Construction

[0041]Certain terminology is used herein for convenience only and is not to be taken as a limitation on the present disclosure. Relative language used herein is best understood with reference to the drawings, in which like numerals are used to identify like or similar items. Further, in the drawings, certain features may be shown in somewhat schematic form.

[0042]It is also to be noted that the phrase “at least one of”, if used herein, followed by a plurality of members herein means one of the members, or a combination of more than one of the members. For example, the phrase “at least one of a first widget and a second widget” means in the present application: the first widget, the second widget, or the first widget and the second widget. Likewise, “at least one of a first widget, a second widget and a third widget” means in the present application: the first widget, the second widget, the third widget, the first widget and the second widget, the first widget and the third widget, th...


PUM


Abstract

Computer aided visualization and diagnosis by volume analysis of optical coherence tomography (OCT) angiographic data. In one embodiment, such analysis comprises acquiring an OCT dataset using a processor in conjunction with an imaging system; evaluating the dataset, with the processor, for flow information using amplitude or phase information; generating a matrix of voxel values, with the processor, representing flow occurring in vessels in the volume of tissue; performing volume rendering of these values, the volume rendering comprising deriving three dimensional position and vector information of the vessels with the processor; displaying the volume rendering information on a computer monitor; and assessing the vascularity, vascular density, and vascular flow parameters as derived from the volume rendered images.

Description

CROSS-REFERENCE TO RELATED APPLICATIONS[0001]This application claims the benefit, pursuant to 35 U.S.C. §119(e), of the respective filing dates of U.S. Provisional Patent App. Ser. No. 62 / 112,924, filed by me on Feb. 6, 2015, and U.S. Provisional Patent App. Ser. No. 62 / 116,313, filed by me on Feb. 13, 2015. The entire disclosure of each of said provisional patent applications, and the drawings submitted therewith (both in black and white and in color) are incorporated herein by reference.BACKGROUND OF THE DISCLOSURE[0002]1. Field of the Disclosure[0003]This application relates generally to optical coherence tomography (OCT) imaging methods and image processing and, more specifically, to an OCT imaging method and processing utilizing volume rendering, and analysis and display of information of the retinal vasculature that utilizes the spatial position of the vessels.[0004]2. Description of Related Art[0005]Optical Coherence Tomography (OCT) is an optical imaging technique that uses ...

Claims


Application Information

Patent Timeline
Patent Type & Authority Patents(United States)
IPC IPC(8): A61B3/14A61B3/00A61B3/12A61B3/10G06T7/00G06T15/08
CPCA61B3/1233A61B3/0025A61B3/0041A61B3/102G06T7/0012G06T15/08G06T2200/24G06T2207/10101G06T2207/30041G06T2207/30104G06T2210/41
Inventor SPAIDE, RICHARD F.
Owner SPAIDE RICHARD F
Why Eureka
Eureka Blog
Learn More