
Method for real-time visualization of BGP analysis and trouble-shooting

a real-time visualization and troubleshooting technology, applied in the field of computer networks, to achieve the effect of efficient identification and reporting

Inactive Publication Date: 2011-05-17
THE BOEING CO
View PDF7 Cites 131 Cited by
  • Summary
  • Abstract
  • Description
  • Claims
  • Application Information

AI Technical Summary

Benefits of technology

[0018]Requirements of the visualization tool are: 1) scalability, i.e. the identification and extraction of key BGP features to monitor and visualize in order to process a large set of data at very fine time-scales, 2) efficiency, i.e. graphical layouts to easily direct user's attention to an anomaly, and 3) readability, i.e. the layouts must be clear and easy to be consulted in the case of large network deployment, i.e. large number of nodes and links. As soon as an anomaly is visualized on the display, the tool interacts with the user to further trouble-shoot the problem observed using a more thorough analysis.
[0021]The novelty of the present invention includes, but is not limited to, the capability of the system in general and of the visualization module in specific to incrementally and efficiently identify and report a cause of a problem in a large scale network without being overwhelmed by the large amount of network information.

Problems solved by technology

This is usually a time-consuming phase of the process due to the different temporal and / or spatial correlation that must be run across several sets of data.

Method used


Image

  • Method for real-time visualization of BGP analysis and trouble-shooting
  • Method for real-time visualization of BGP analysis and trouble-shooting
  • Method for real-time visualization of BGP analysis and trouble-shooting

Examples


Embodiment Construction

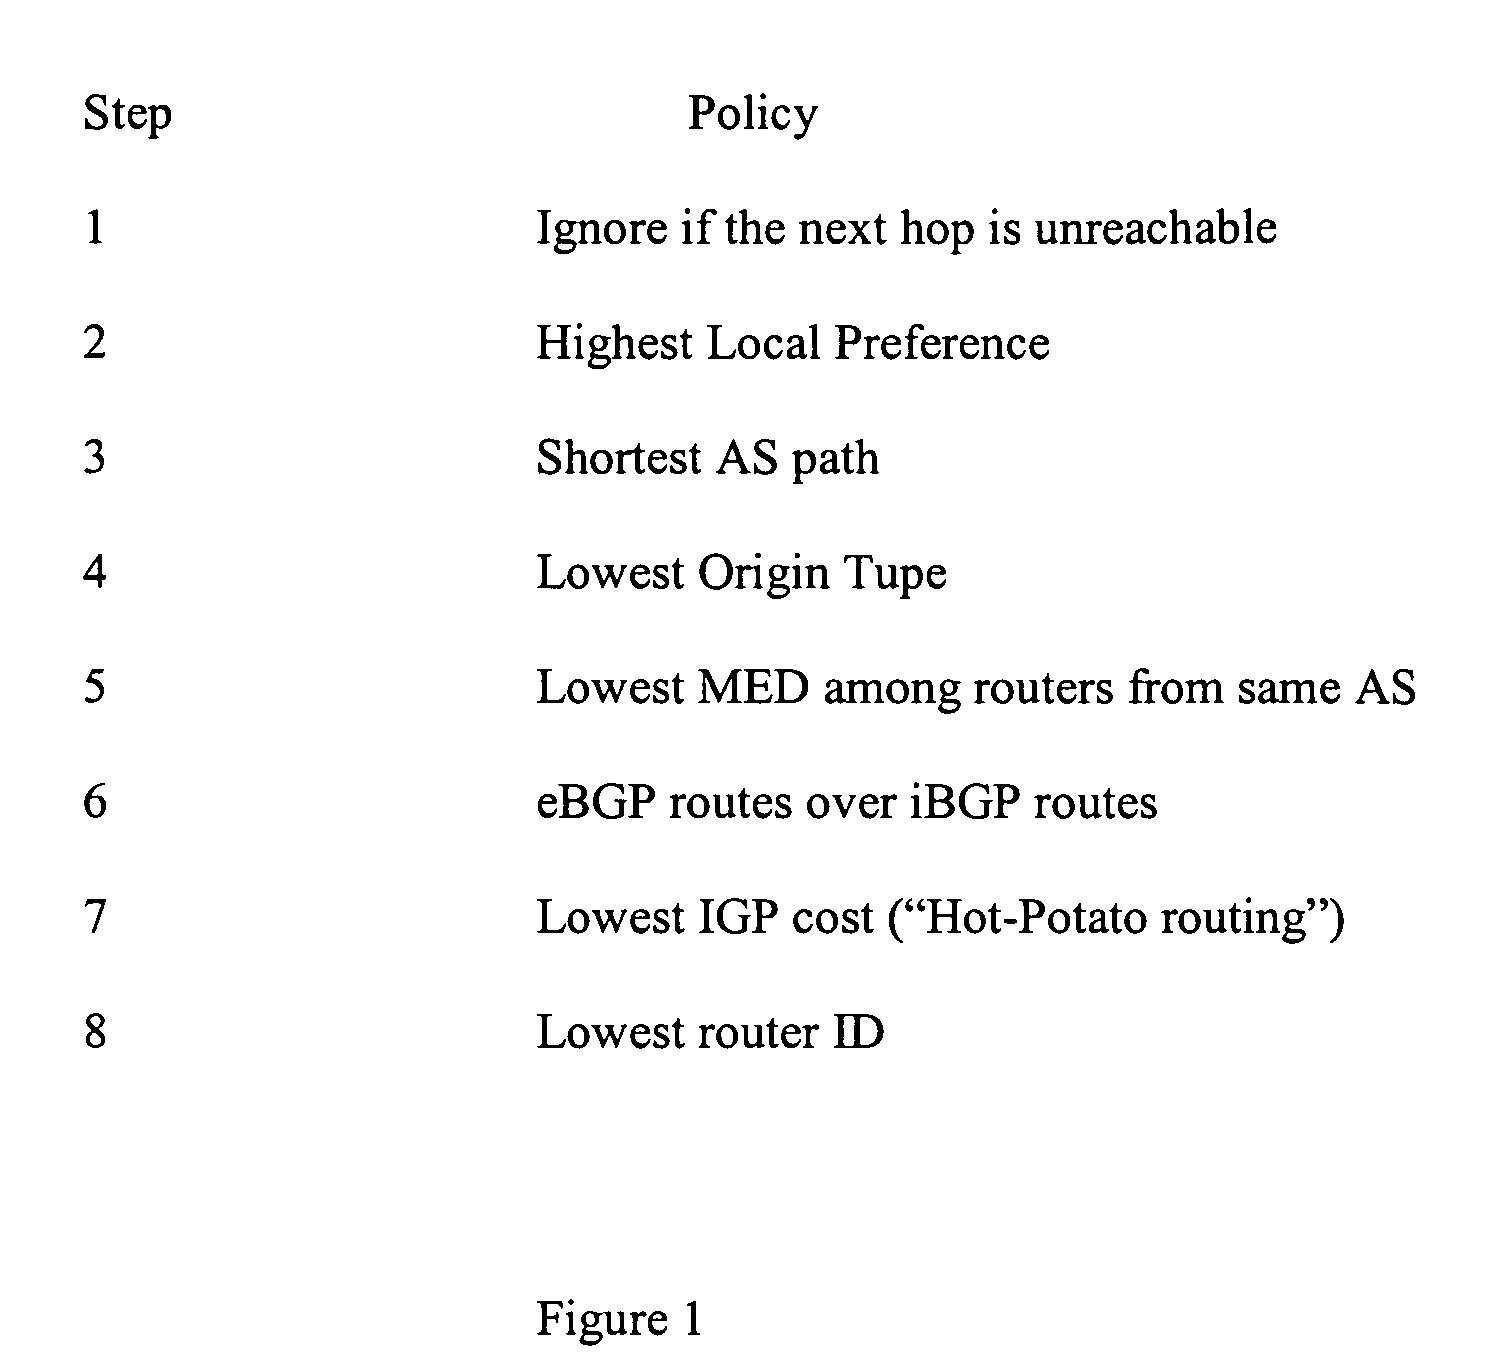
[0032]FIG. 1 is a high-level block diagram illustrating BGP decision process. Routers can apply complex policies to influence the selection of the best route for each prefix and to decide whether to propagate this route to neighbors. Knowing why a routing change occurs requires understanding how policy affects the decisions. To select a single best route for each prefix, a router applies the decision process illustrated in FIG. 1 to compare the routes learned from BGP neighbors.

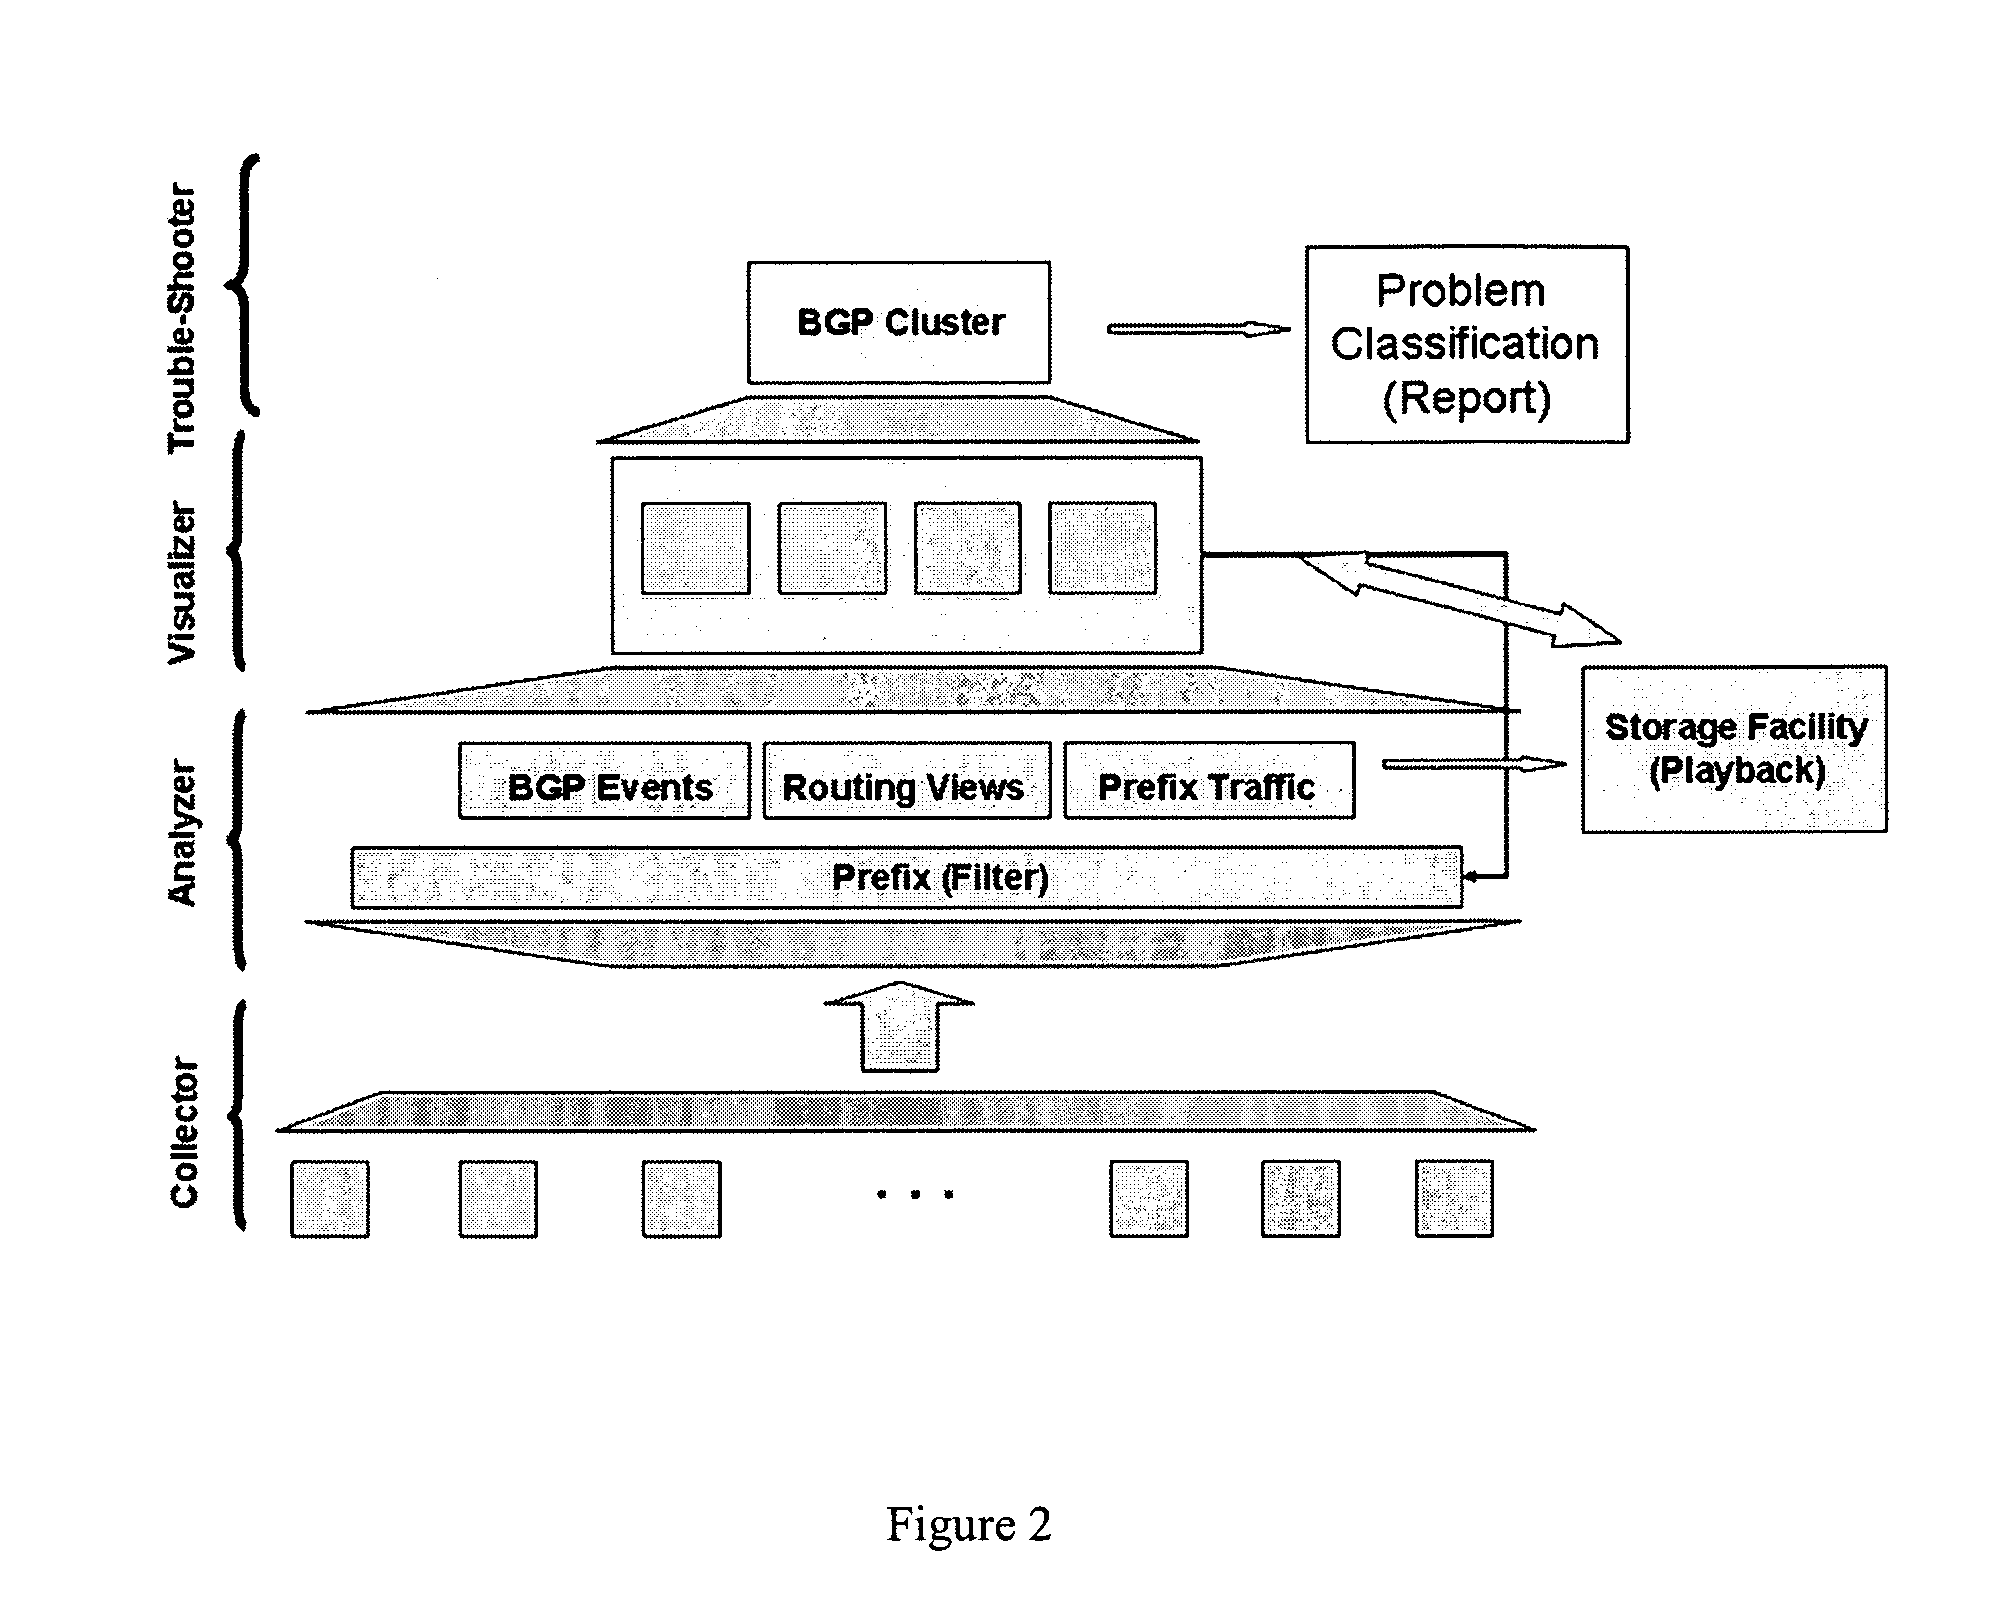
[0033]FIG. 2 is a high-level block diagram illustrating the system architecture of an example embodiment of the present invention. The architecture comprises four major modules: 1) Collector, 2) Analyzer, 3) Visualizer and 4) Trouble-shooter. Several software agents acting as slave collectors collect BGP, Netflow / Cflowd, IGP and syslogs files from all border routers and forward the information to a master collector which is a centralized system that has a unified view of the network topology and data in real ...


PUM


Abstract

The present invention comprises a multi-tier system. Major goals of the system are to 1) clearly visualize BGP dynamics and alert / report important deviation of BGP dynamics to avoid overwhelming the operators with too much information and 2) analyze the root cause of the problems by using a multi-tier approach, with a light-computational analysis and high-level classification for a real-time problem identification followed by a more rigorous off-line analysis for a further and more detailed trouble shooting. An example embodiment is provided that comprises four modules. The first module comprises a distributed family of collectors in charge of collecting real-time network information. The second module filters out non-relevant prefixes and extracts and profiles key features of the network information. The third module monitors BGP activity from both an Internet-AS and single-AS perspectives by displaying the data in real time and highlighting major shifts or divergence from historical baselines with comprehensive layouts. The forth module is run off-line to focus on a few relevant events that are selected through the first three modules. This is usually a time-consuming phase of the process due to the different temporal and / or spatial correlation that must be run across several sets of data. During this phase, the system can spend more time to better identify the real cause of the problem.

Description

BACKGROUND[0001]1. Field[0002]The present invention relates to computer networks. More particularly, the present invention relates to Internet and method for real-time visualizing of BGP (Border Gateway Protocol) analysis and trouble-shooting. In the context of this document the term “BGP” shall mean what is understood by a person skilled in the art of computer networks.[0003]2. Description of Related Art[0004]The Internet consists of many separate Administrative Systems (AS) that manage their networks independent of each other. In the context of this document the term “Administrative System” shall mean what is understood by a person skilled in the art. Internet functionality depends heavily on the operation of routers, which forward each packet towards its destination based on local information. Any performance degradation of routing protocol leads to a decrease in the overall performance of the Internet. Therefore, a primary concern for network operators, those who manage and main...

Claims


Application Information

Patent Timeline
Patent Type & Authority Patents(United States)
IPC IPC(8): G06F15/16G06F15/173
CPCH04L41/065H04L41/22H04L41/12
Inventor NUCCI, ANTONIOTEOH, SOON-TEECHUAH, CHEN-NEE
Owner THE BOEING CO
Learn More