Knowledge-based statistical method and system to determine reliability compatibility for semiconductor integrated circuits
a technology of reliability compatibility and statistical method, applied in the field of integrated circuits, can solve the problems of reducing the reliability of integrated circuits, so as to achieve the effect of wide applicability and improved device reliability performan
- Summary
- Abstract
- Description
- Claims
- Application Information
AI Technical Summary
Benefits of technology
Problems solved by technology
Method used
Image
Examples
example 1
[0050]This example demonstrates that two products with two designs have the same MTTF but one product has higher probability to outlast another. For simplicity on calculation & presentation, we assume their lives can be modeled by the Weibull distribution: the first product has Beta=1.0 and Eta=1000, and the second, Beta=0.25 and Eta=41.67. For the first product,
[0051]MTTF=ηΓ(1β+1)=1000Γ(11.0+1)=1000hours.
For the second product,
[0052]MTTF=41.67Γ(10.25+1)=1000hours.
These two products have same MTTF.
[0053]However, from the reliability function plots in FIG. 3, we can see that majority of the product 2 failed at very short life with only a very small portion survived at very long life. In most cases, customers concern more on the reliability at early stage due to the short product lifecycle, for example. Furthermore, the reliability difference between these two products after 3,000 is negligible. Under these circumstances, product 1 is preferred. Besides, product 1 has CFR ...
example 2
[0079]Consider two groups with Weibull distribution lives:
[0080]Group 1: (Beta, Eta)=(1.5, 1108); MTTF=1000
[0081]Group 2: (Beta, Eta)=(3.0, 1120); MTTF=1000
They passed the pre-check since both Beta's are larger than 1.0. Their reliability functions and pdf are in FIG. 4 and FIG. 5, respectively.
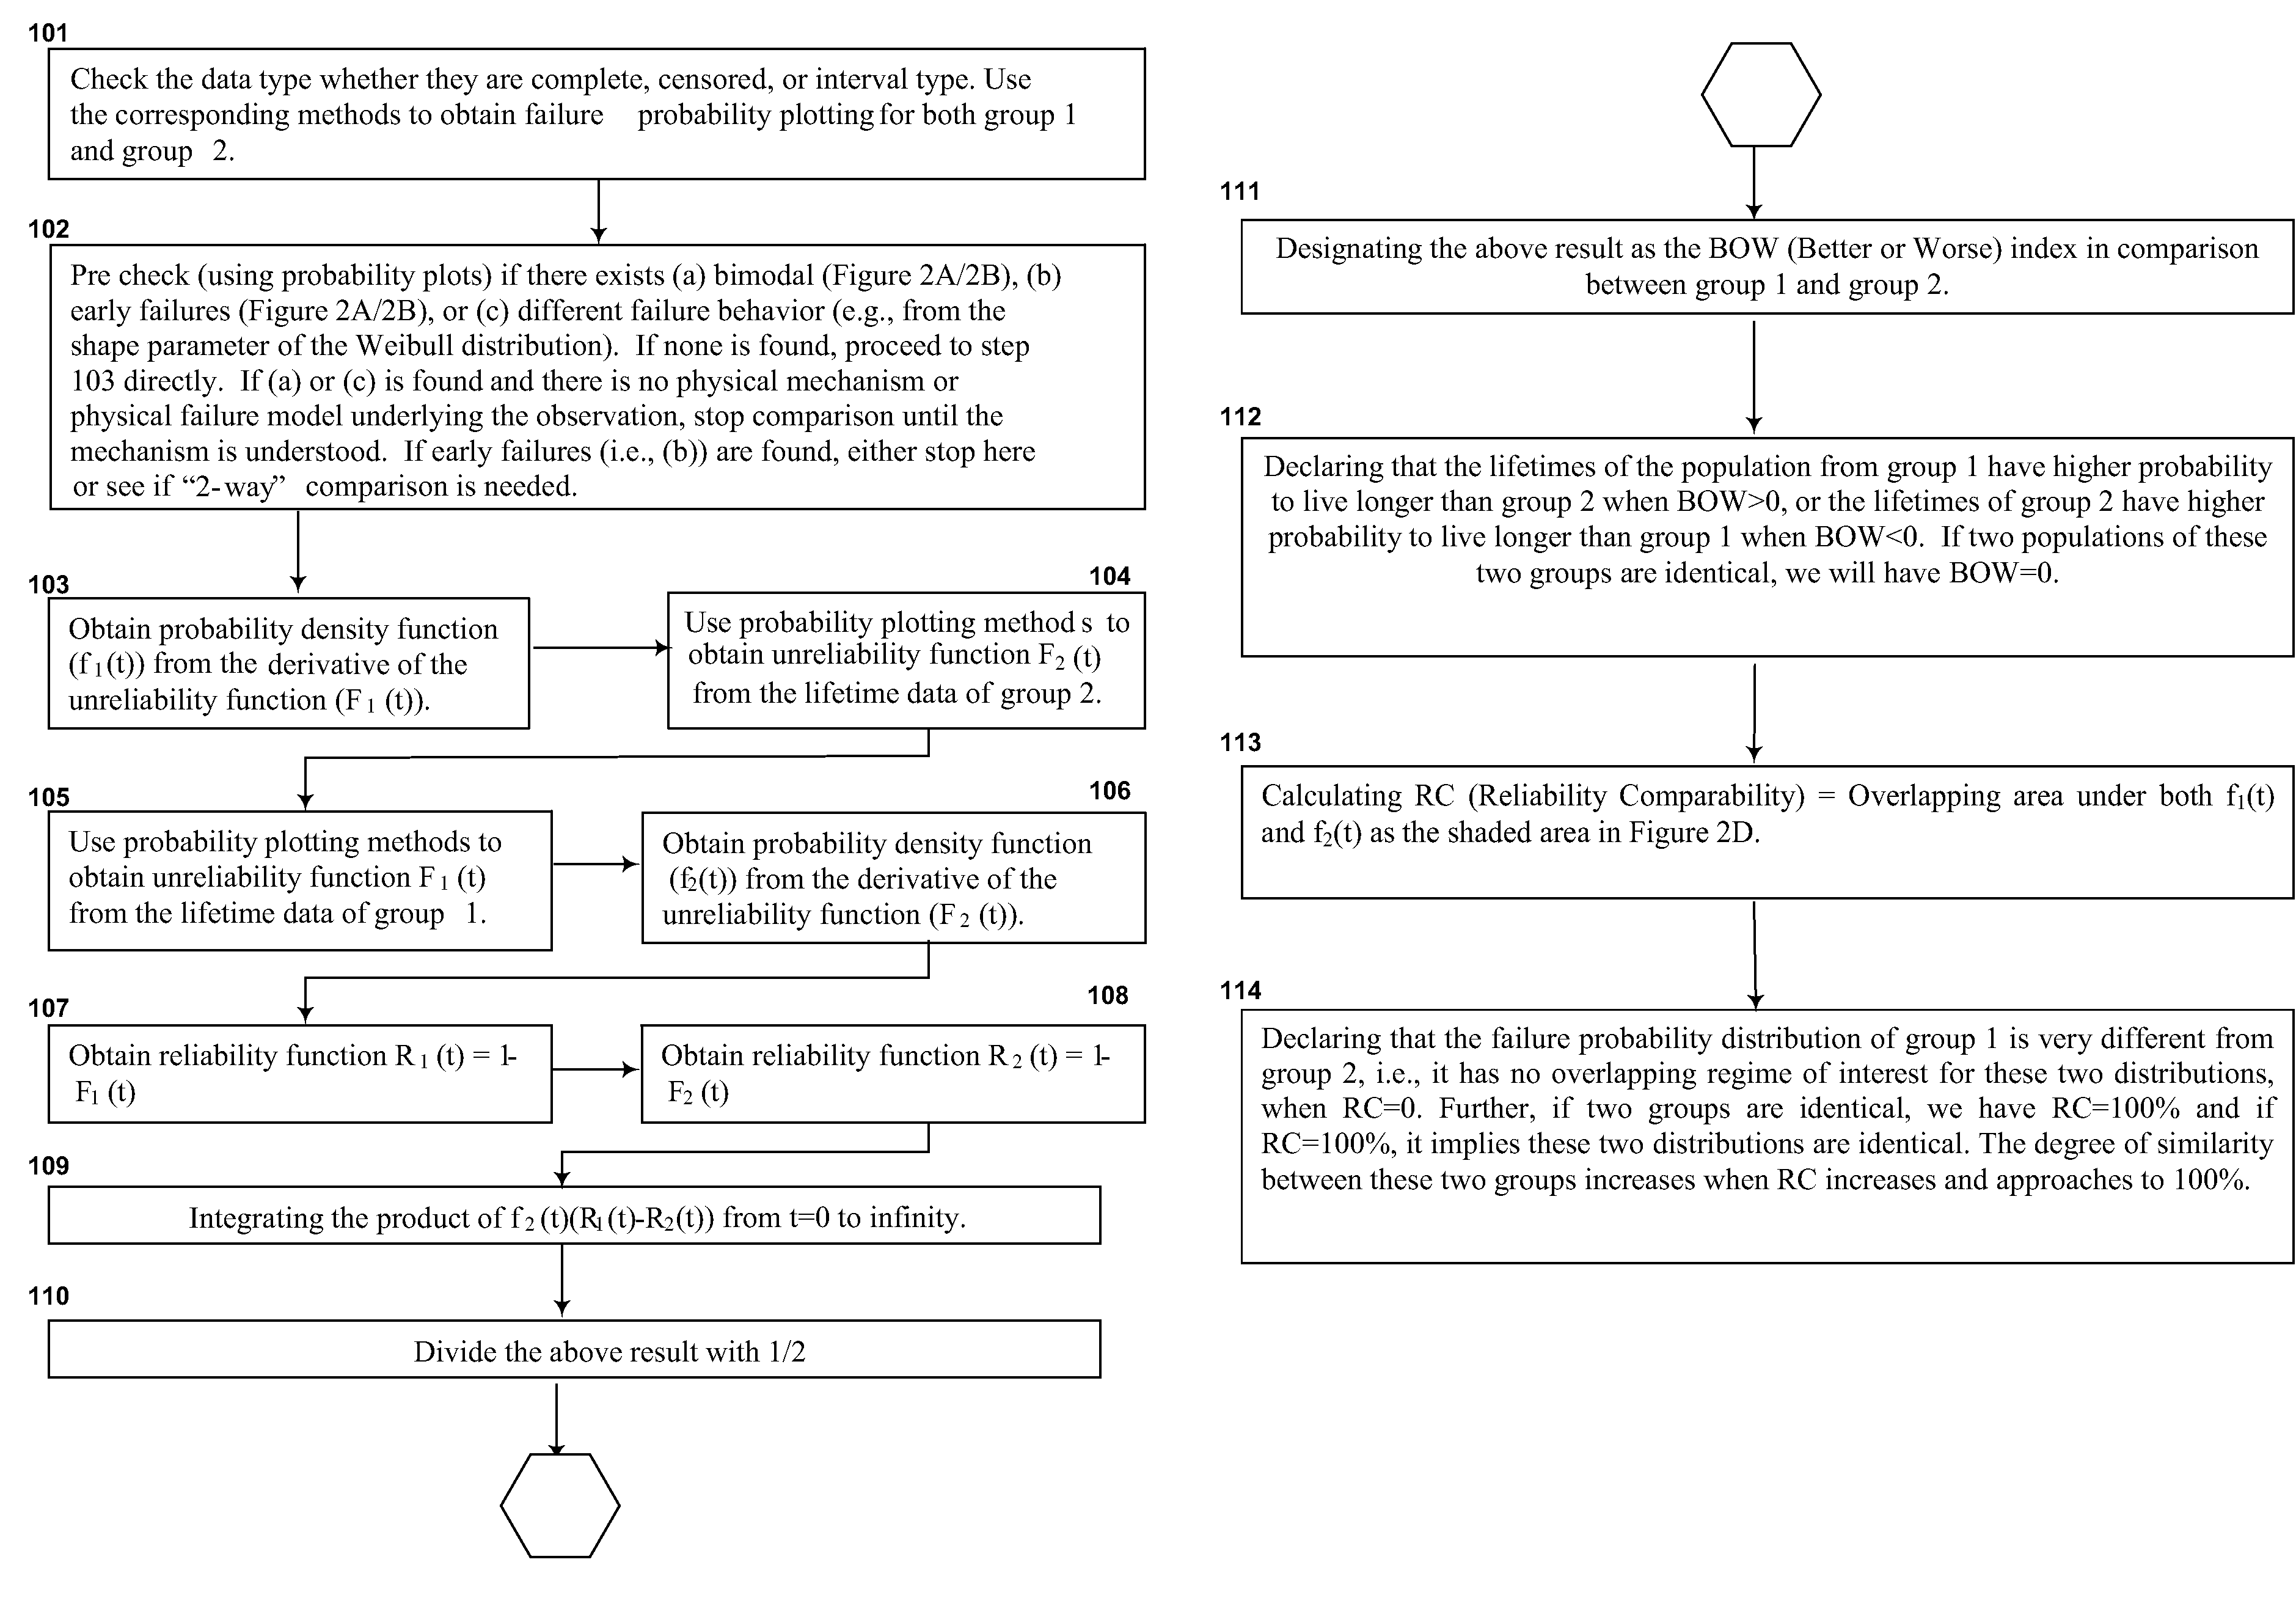
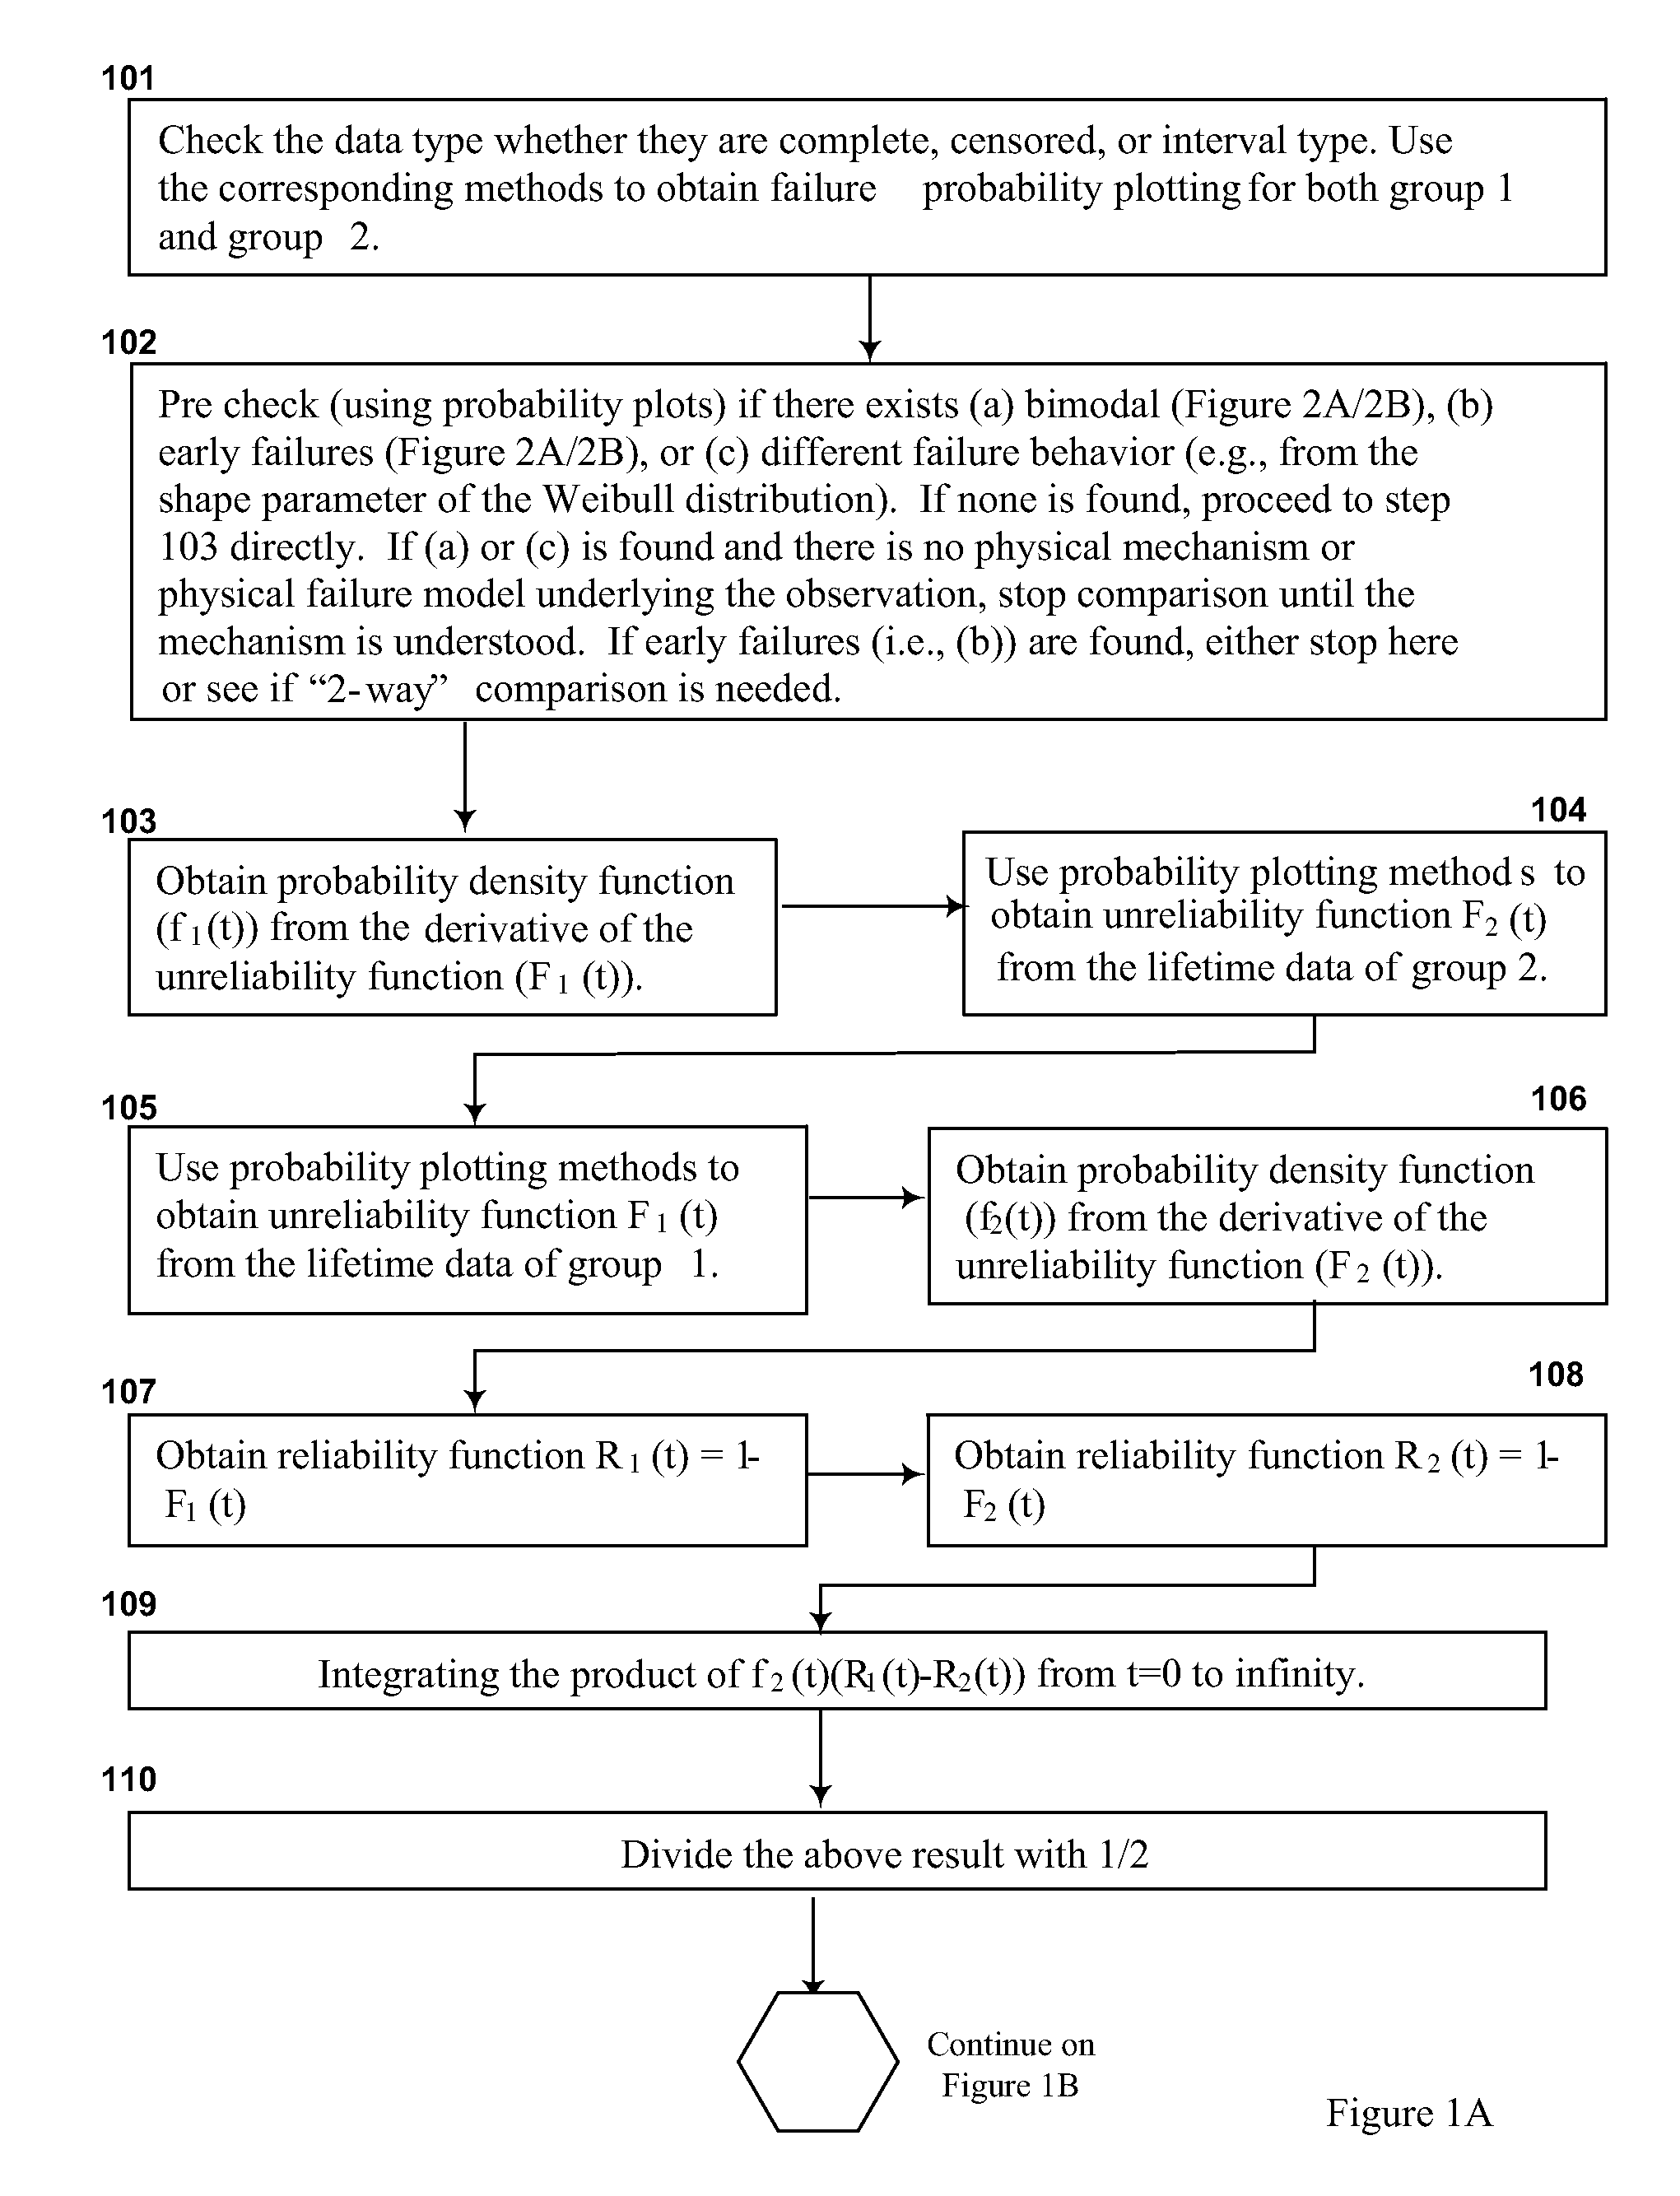
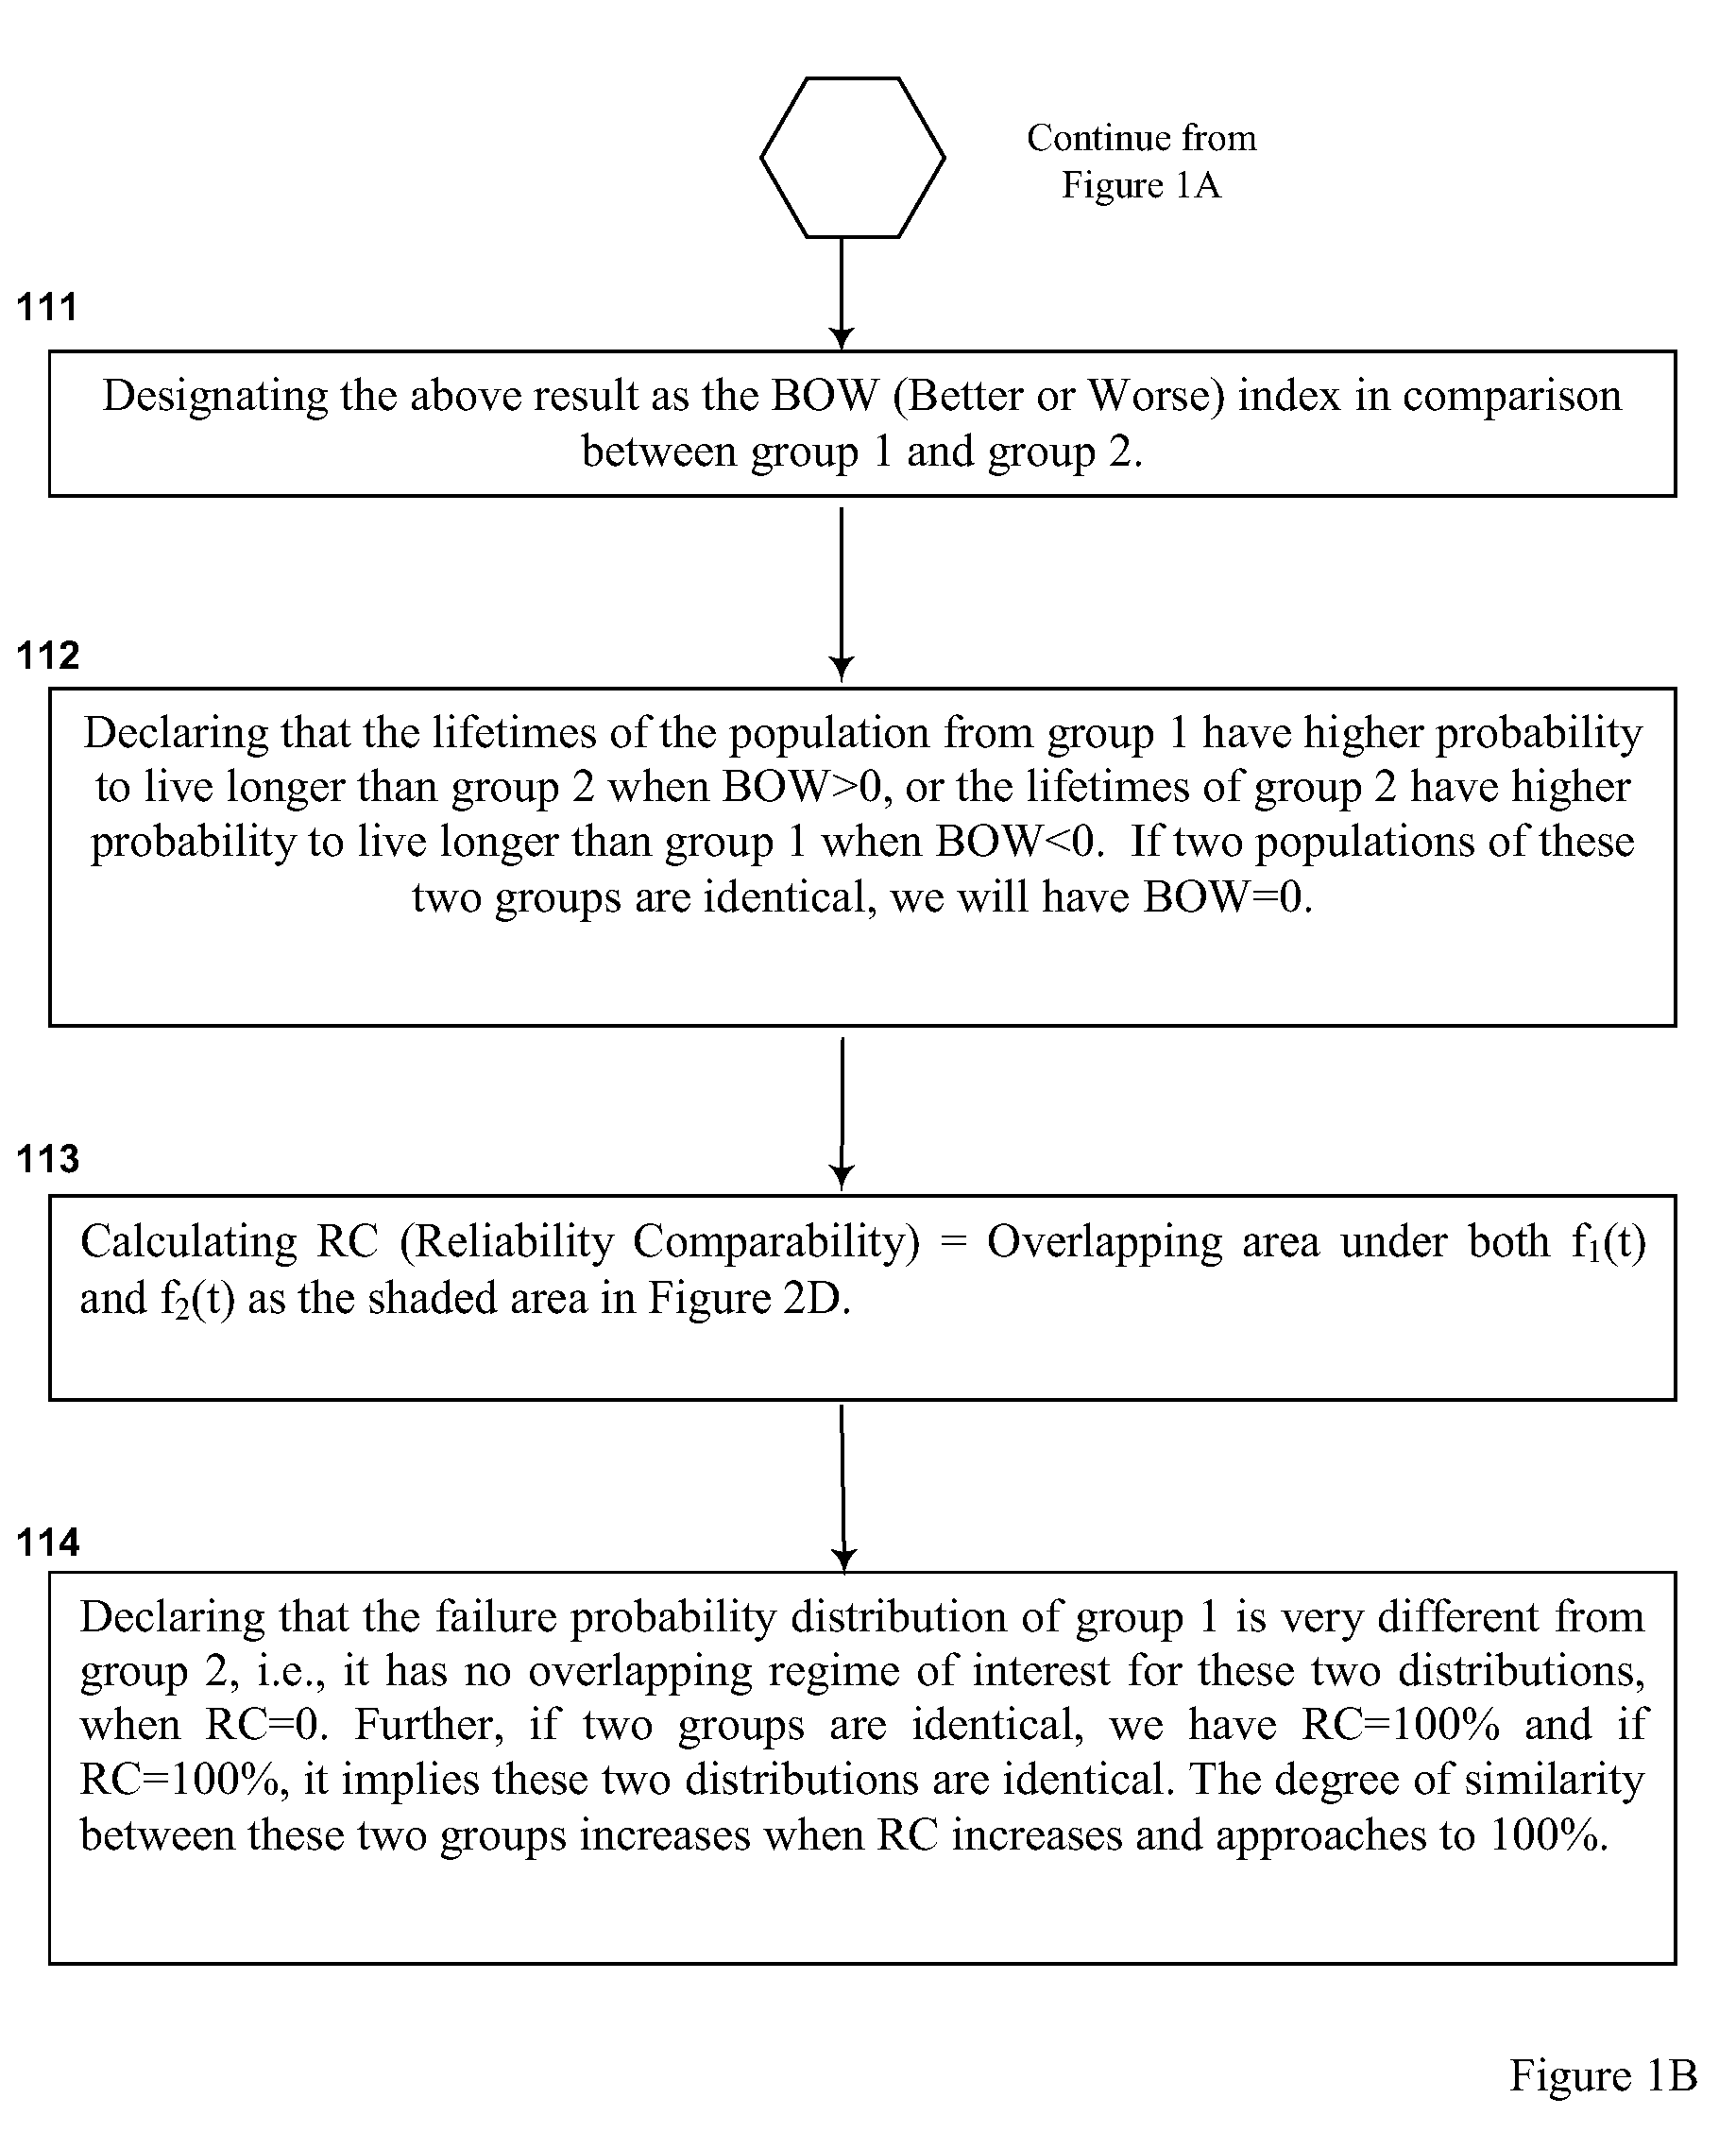
[0082]Although they both have the same MTTF (=1000), they have BOW=−12% and RC=71%. The probability that group 2 outlasts group 1 is 12% and their reliability comparability is 71%.
[0083]To sum up, when the comparisons are on the conventional lifetime indices, like t0.1% or t1ppm and which are close together as in many practical cases, using BOW can make robust judgment. In the cases when t0.1% comparison has no uncertainty and both meet Spec., both BOW and RC can still be used to give a normalized indicator of how far they are off each other. The practical case below highlights the power of BOW when the two t0.1%'s are close together and is difficult to draw conclusions by conventional compar...
example 3
[0084]The data from group A and B shown in FIG. 6 are the results of a reliability test X, which can be presumably modeled by a 2-parameter Weibull distribution.
[0085]The confidence bounds indicate that it is uncertain to distinguish these two groups' t0.1%'s, which are by extrapolation. It is because that the data are not perfectly fitting into Weibull distributions. BOW is 0.50, which indicates there is significant difference between these two groups. Their reliability functions vs. time are in FIG. 7, which also confirms the big difference between these two groups.
[0086]BOW & RC do not require parametric fitting. The general numerical approaches existing in literature for the reliability function (R(t)) fitting, and derivation to obtain numerical pdf f(t), and integral of the group of f1(t) and [R2(t)−R1(t)] provide higher accuracy than the parametric approaches.
[0087]BOW and RC are applicable either for the raw data of lifetimes (e.g., GOI, EM) or derived parameters from each te...
PUM
 Abstract
Description
Claims
Application Information
 - R&D
- Intellectual Property
- Life Sciences
- Materials
- Tech Scout
- Unparalleled Data Quality
- Higher Quality Content
- 60% Fewer Hallucinations
Browse by: Latest US Patents, China's latest patents, Technical Efficacy Thesaurus, Application Domain, Technology Topic, Popular Technical Reports.
© 2025 PatSnap. All rights reserved.Legal|Privacy policy|Modern Slavery Act Transparency Statement|Sitemap|About US| Contact US: help@patsnap.com


