Anti-cancer composition comprising DMXAA or related compound
a technology of anti-cancer compositions and compounds, applied in the field of pharmaceutical compositions, to achieve the effect of avoiding high systemic levels of agents and associated toxicities
- Summary
- Abstract
- Description
- Claims
- Application Information
AI Technical Summary
Benefits of technology
Problems solved by technology
Method used
Image
Examples
experiment i
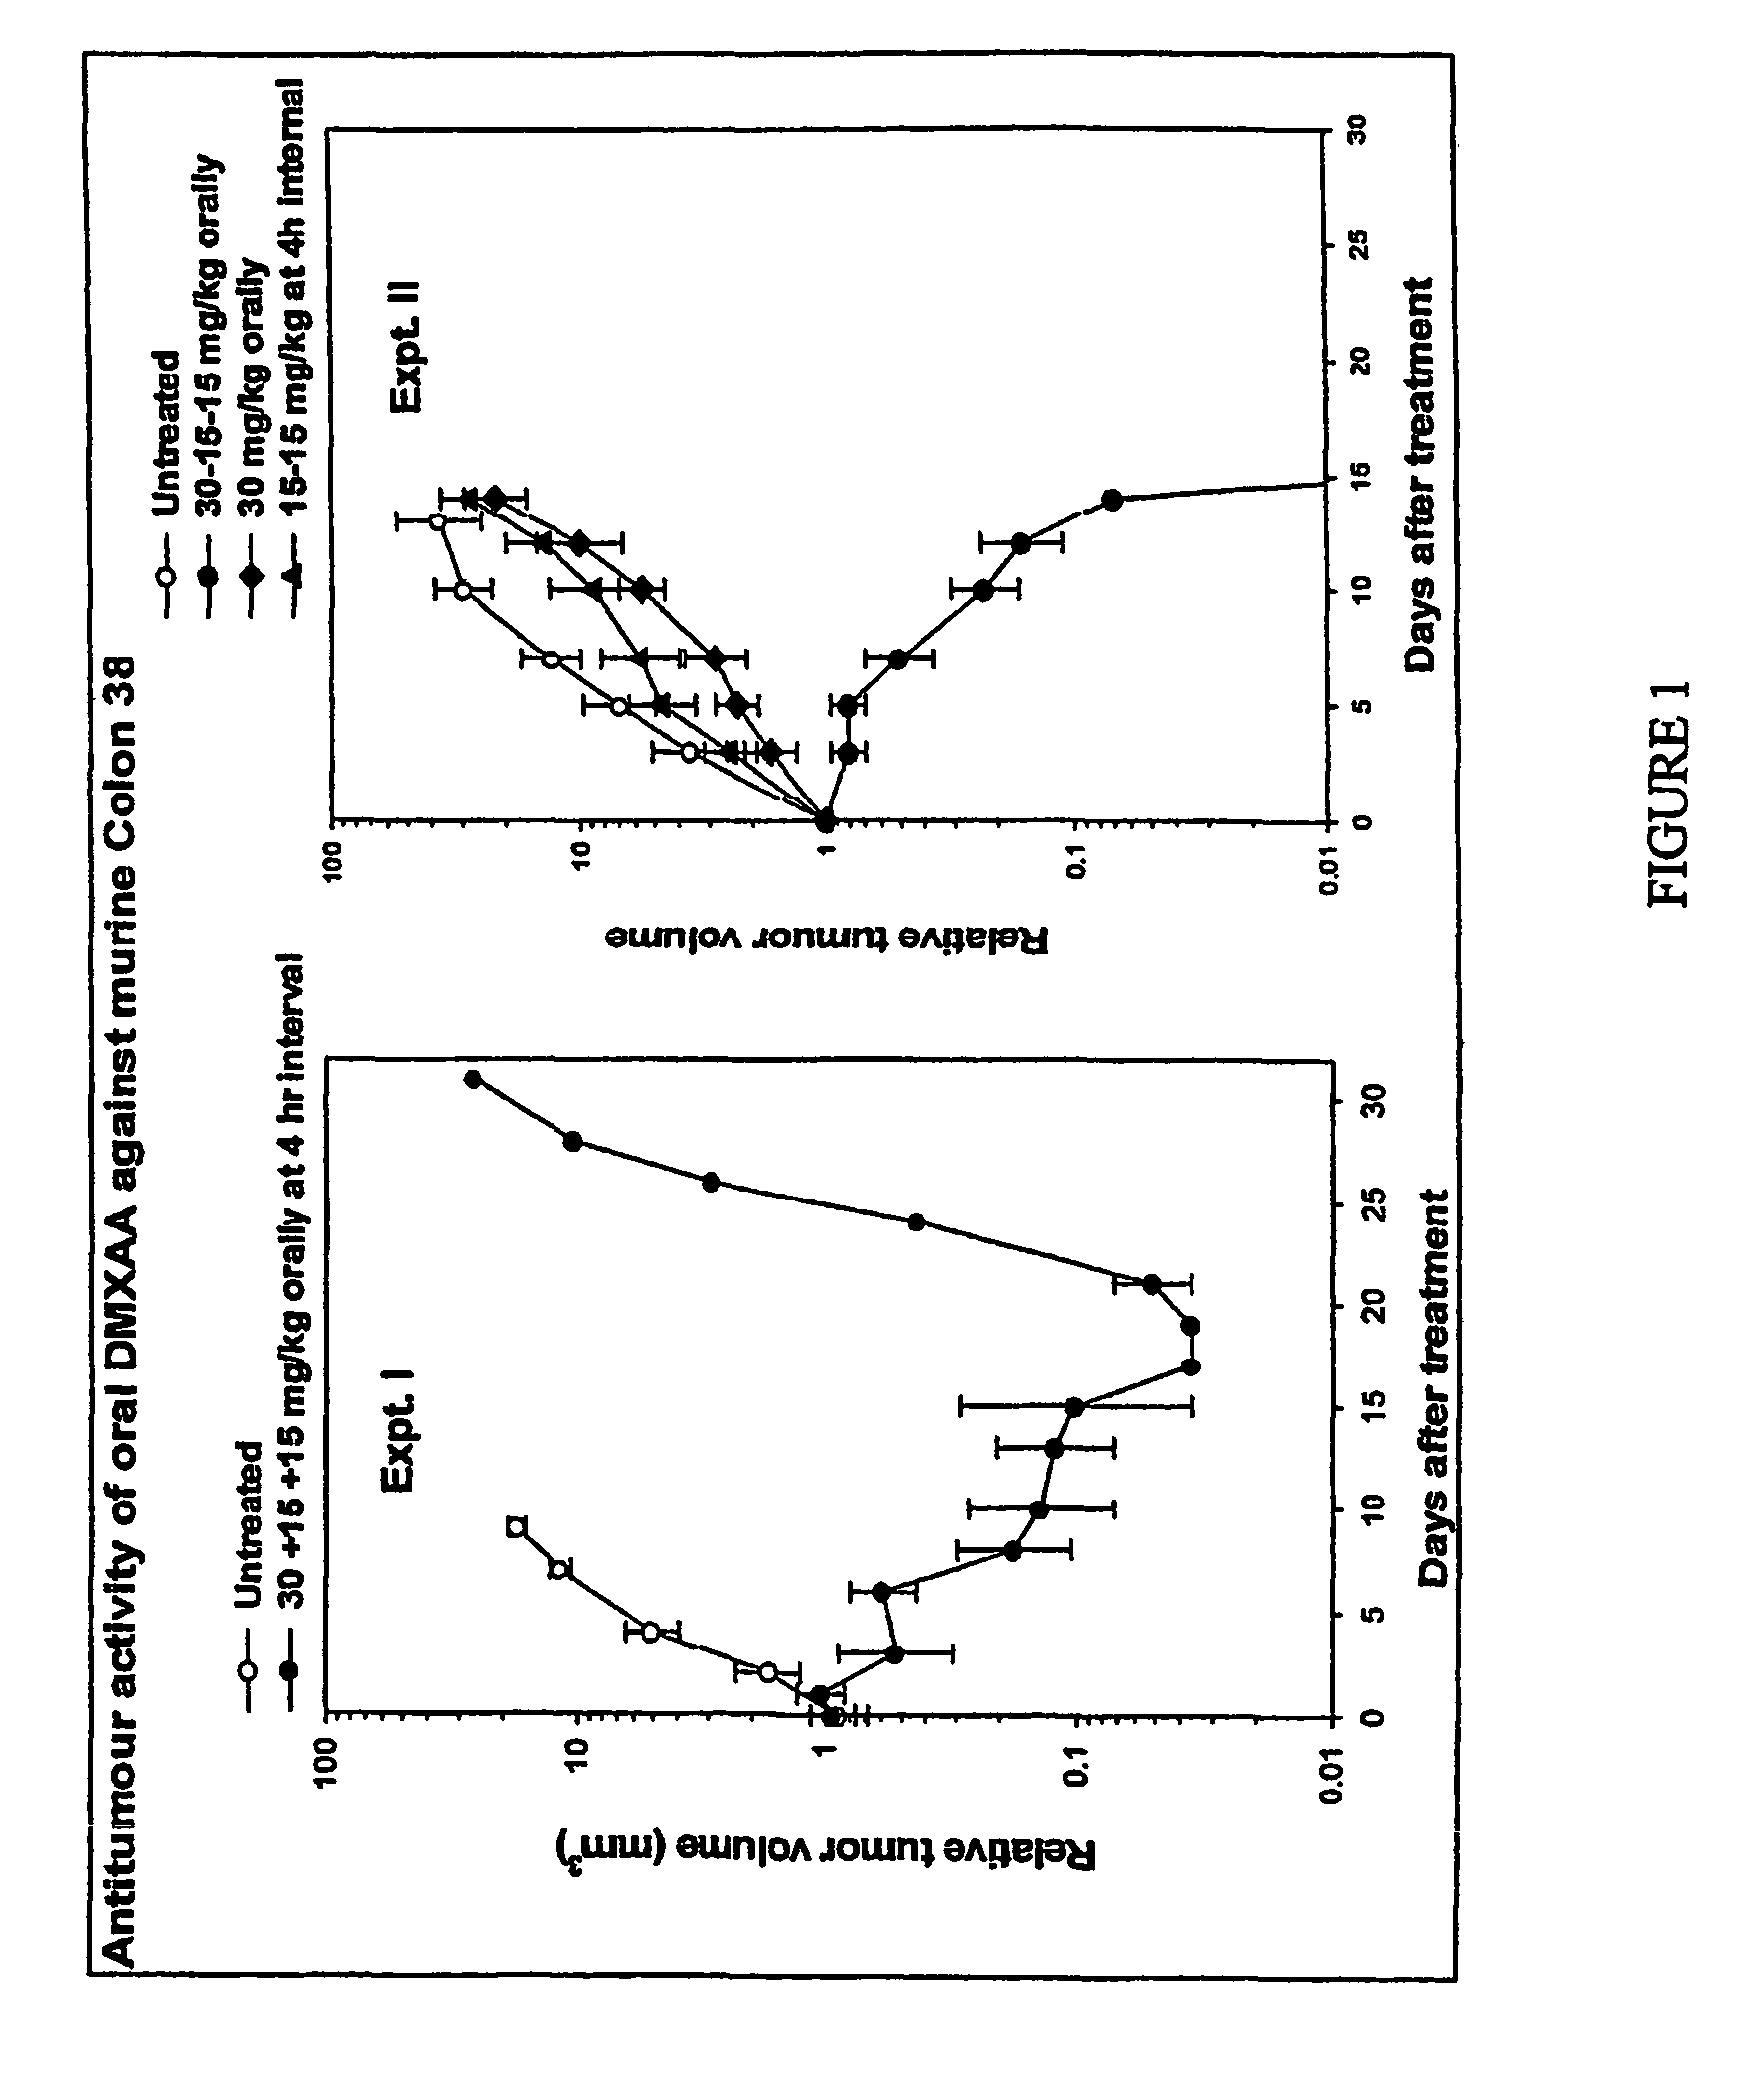
[0126]The tumour growth delay experiment was conducted using 2 drug regimes: untreated controls (n=5) and oral DMXAA (n=5) administered in 3 doses. The first dose (30 mg / kg), was administered at t=0 hours followed by two lower doses each of 15 mg / kg at t=4 hours and t=8 hours respectively. Tumour size was measured thrice weekly and the results normalised as described above. The results are shown in Table 1 (raw data), Table 2 (normalised data) and FIG. 1, Expt. I (plotted as a graph).
[0127]As shown in FIG. 1, Expt. I, in the control group, tumours continued to grow throughout the time-course of the experiment. In contrast, in the treatment group, average tumour size decreased throughout the first 17 days of the experiment with 4 / 5 mice cured completely within 24 days. In one animal, after initial tumour size reduction, tumour size began to increase approximately 17 days after treatment.
experiment ii
[0128]In this example, the tumour growth delay experiment was conducted using 4 drug regimes: untreated controls (Group 1, n=5); two 15 mg / kg doses of DMXAA separated by a 4 hour interval (Group 2, n=5); a single 30 mg / kg dose of DMXAA (Group 3, n=5); three doses of DMXAA in concentrations of 30+15+15 mg / kg administered at t=0, 4 and 8 hours respectively (Group 4, n=6). The 30 mg / kg dose is the maximum tolerated single dose Zhao et al (Cancer Chemother Pharmacol. 2002 January; 49(1):20-6). Tumour size was measured thrice weekly and the results normalised as described above. The results are shown in Table 3 (raw data), Table 4 (normalised data) and FIG. 1, Expt. II (plotted as a graph).
[0129]As shown in FIG. 1, Expt. II, in the control group, the single dose group, the 30 mg / kg dose group and the 2×15 mg / kg dose group, tumours continued to grow throughout the time-course of the experiment. In contrast, in the 30+15+15 mg / kg treatment group, average tumour size decreased throughout th...
experiment 3
Methods
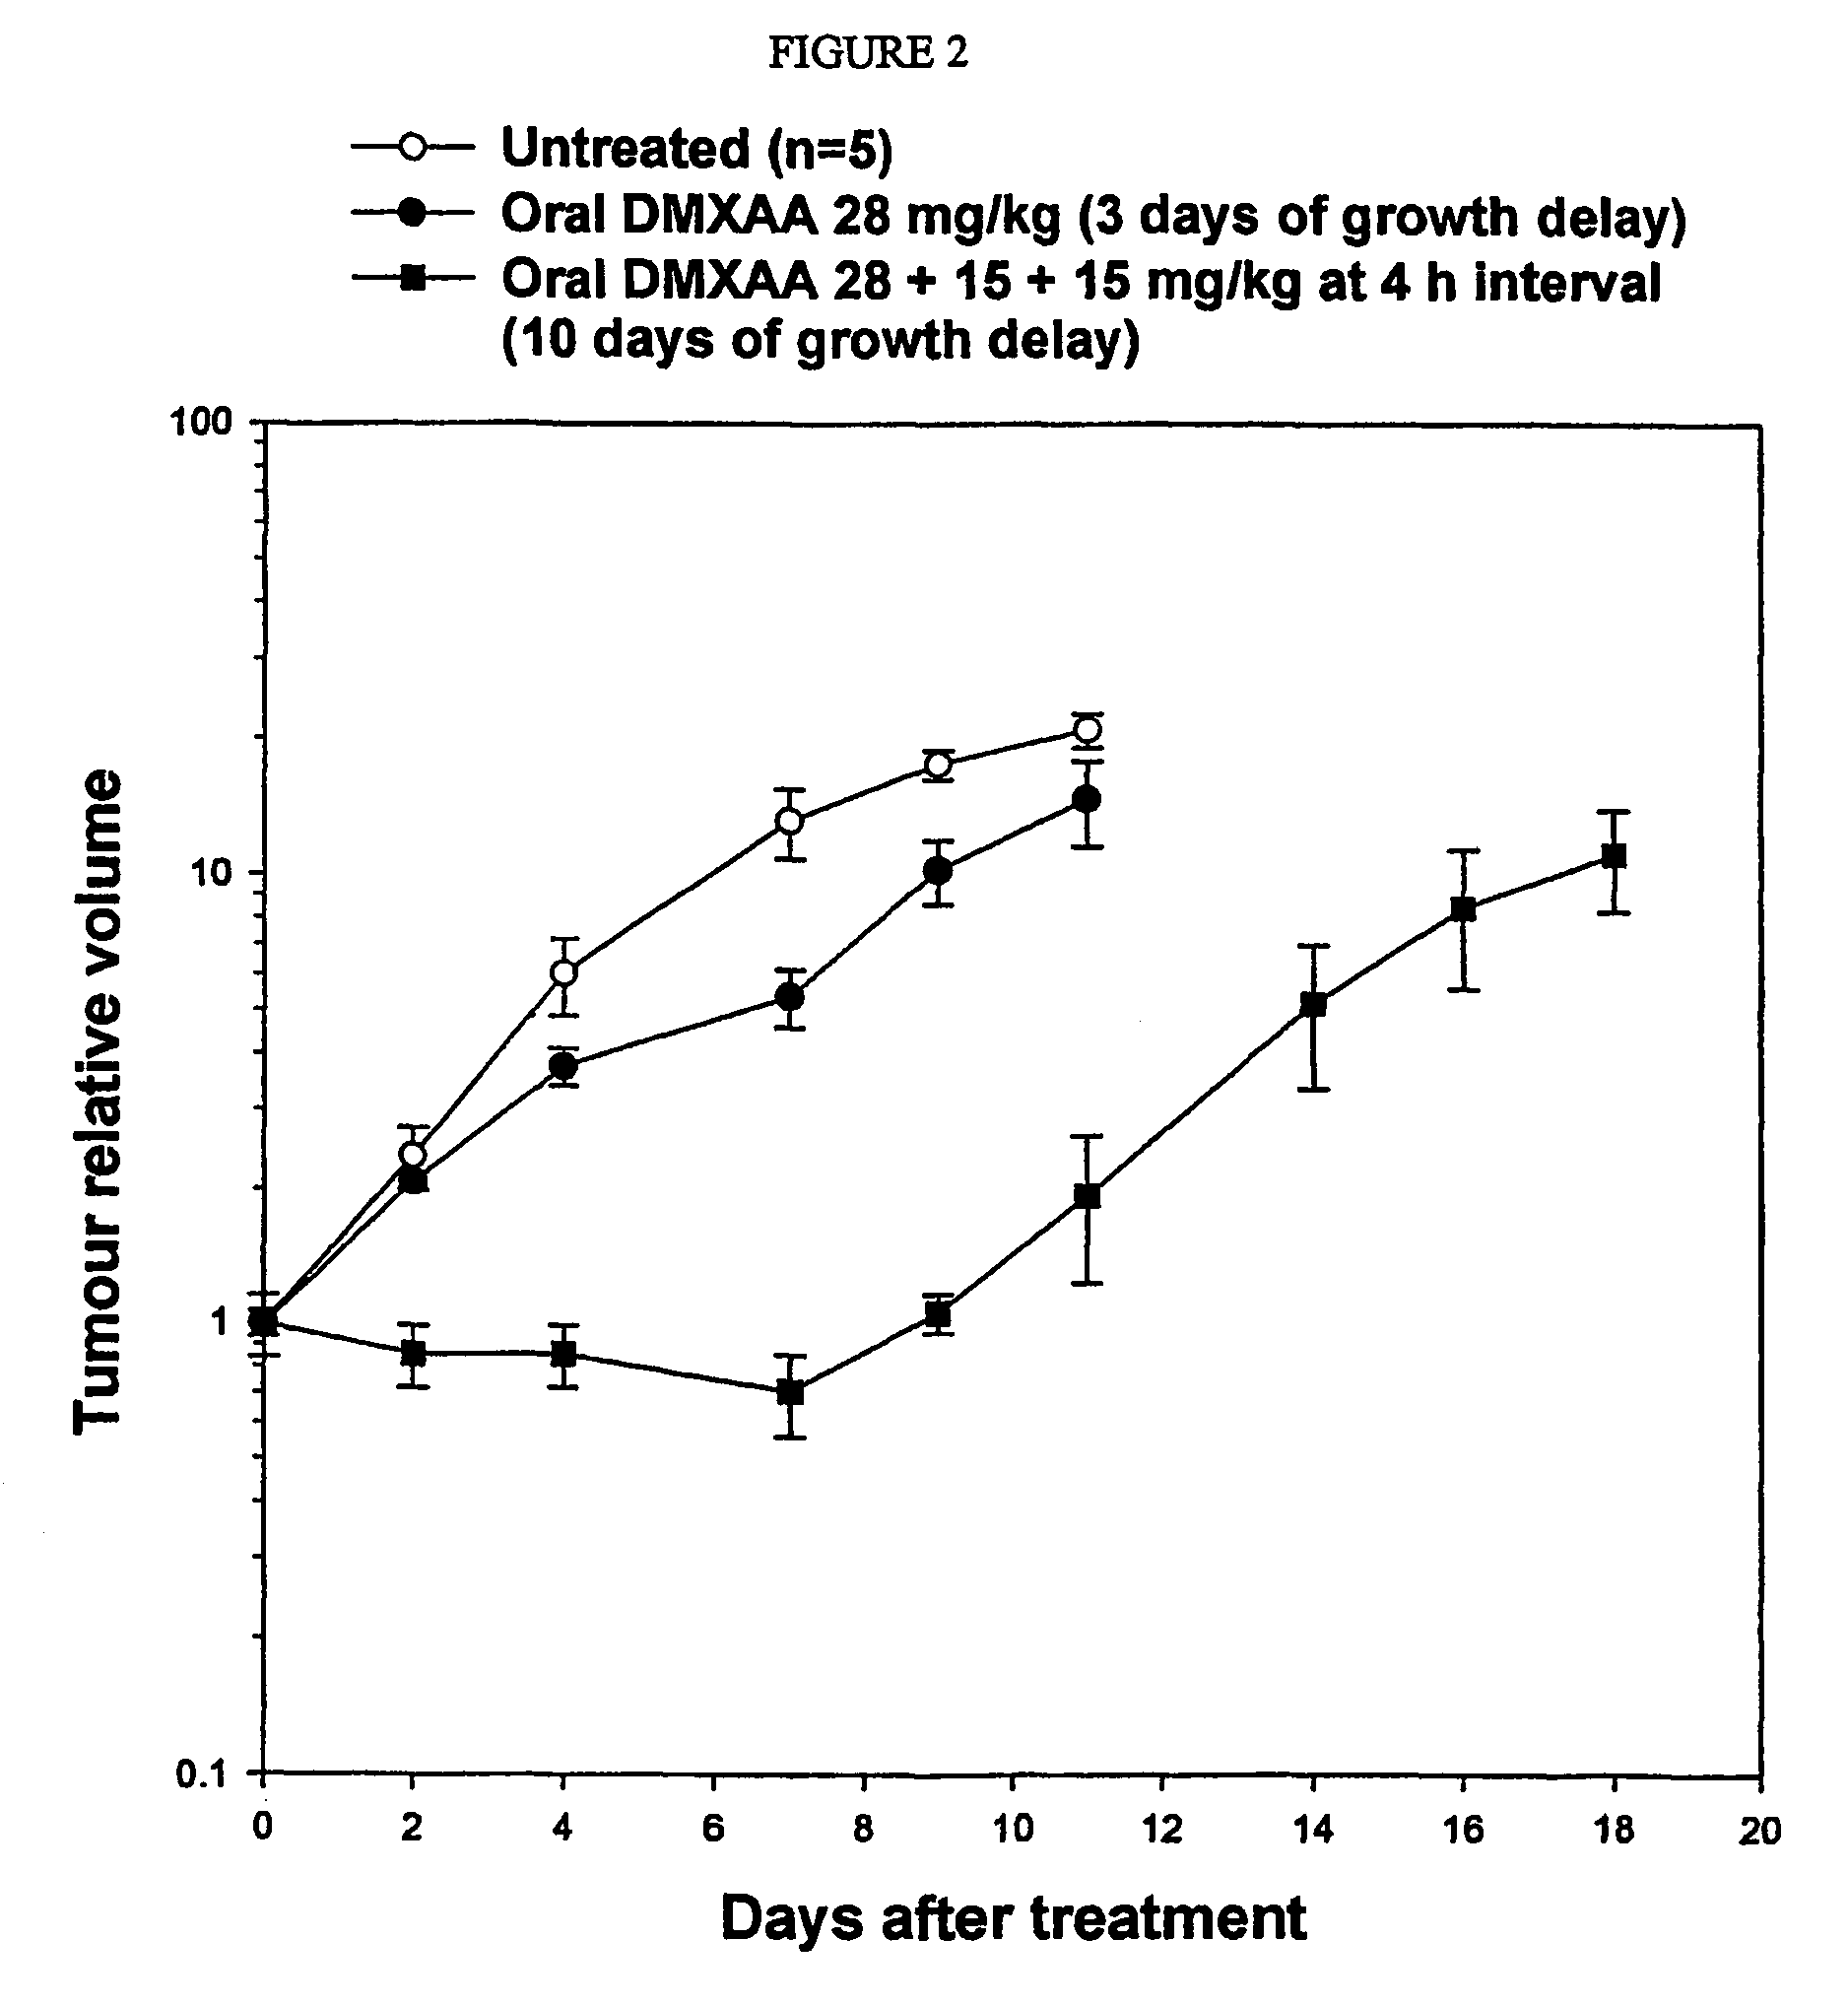
[0131]Nude mice were implanted with 5×10⁶ HT29 human colon cancer cells, subcutaneously. When tumours had reached a diameter of 6-8 mm, mice were randomised into groups of 5 and received either no drug (untreated controls), DMXAA (sodium salt) at a single oral dose of 28 mg / kg or DMXAA (sodium salt) at oral doses of 28 mg / kg followed by two additional doses of 15 mg / kg 4 and 8 hours after the initial dose. Tumours were then measured using callipers every 2-3 days and volumes calculated. Comparative tumour growth curves are plotted with respect to those at the onset of treatment (relative tumour volume).
PUM
| Property | Measurement | Unit |
|---|---|---|
| time | aaaaa | aaaaa |
| time | aaaaa | aaaaa |
| time | aaaaa | aaaaa |
Abstract
Description
Claims
Application Information
 - R&D
- Intellectual Property
- Life Sciences
- Materials
- Tech Scout
- Unparalleled Data Quality
- Higher Quality Content
- 60% Fewer Hallucinations
Browse by: Latest US Patents, China's latest patents, Technical Efficacy Thesaurus, Application Domain, Technology Topic, Popular Technical Reports.
© 2025 PatSnap. All rights reserved.Legal|Privacy policy|Modern Slavery Act Transparency Statement|Sitemap|About US| Contact US: help@patsnap.com


