Method and device for measuring concentration of specific component
a technology of concentration and specific components, applied in the direction of diagnostic recording/measuring, instruments, applications, etc., can solve the problems of affecting the accuracy of measurement, erroneous concentration information might be obtained, and stable measurement results cannot be obtained, so as to achieve easy and stable concentration measurement
- Summary
- Abstract
- Description
- Claims
- Application Information
AI Technical Summary
Benefits of technology
Problems solved by technology
Method used
Image
Examples
example 1
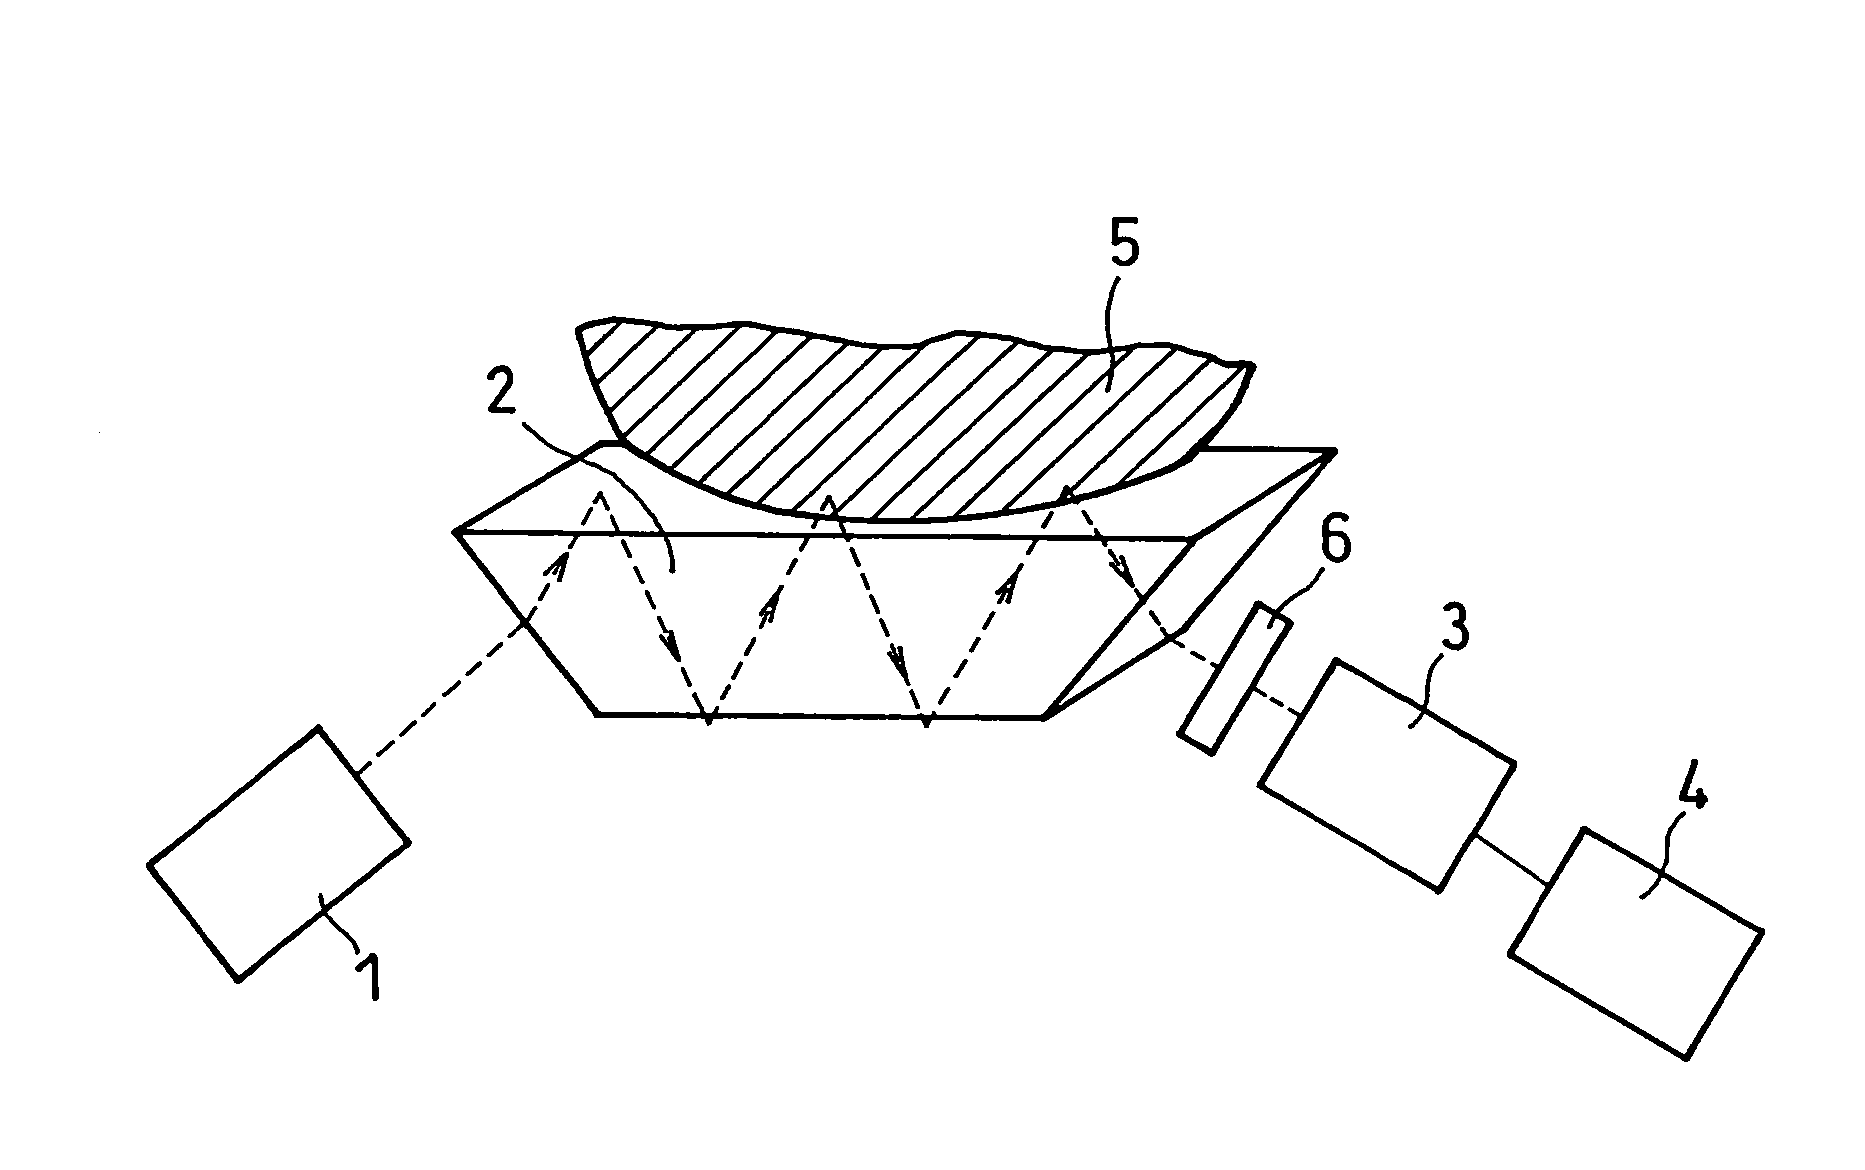
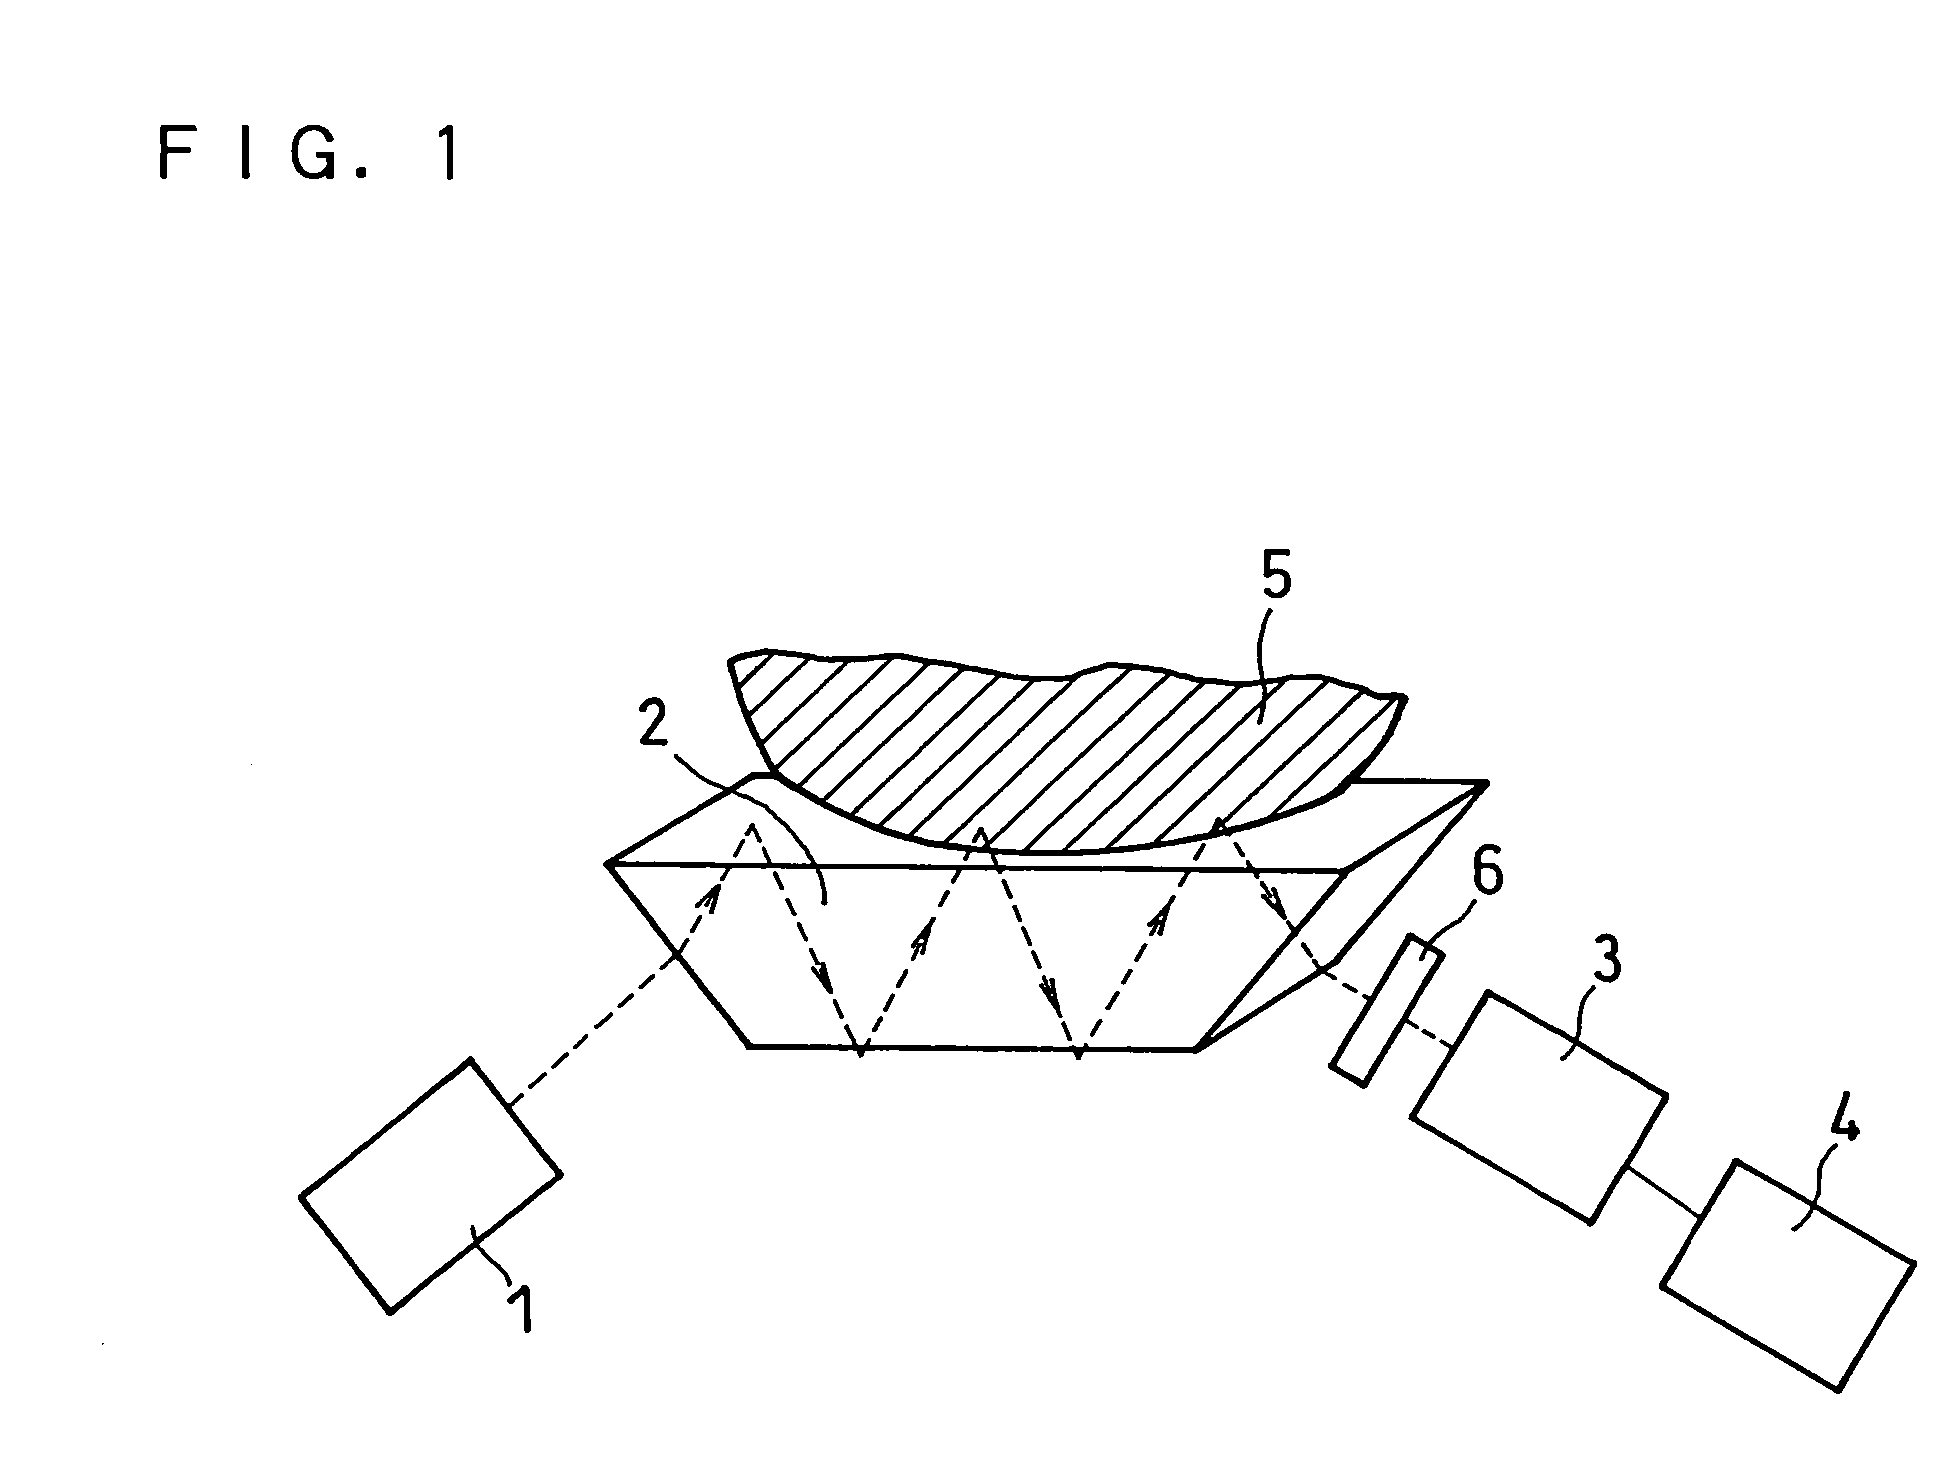
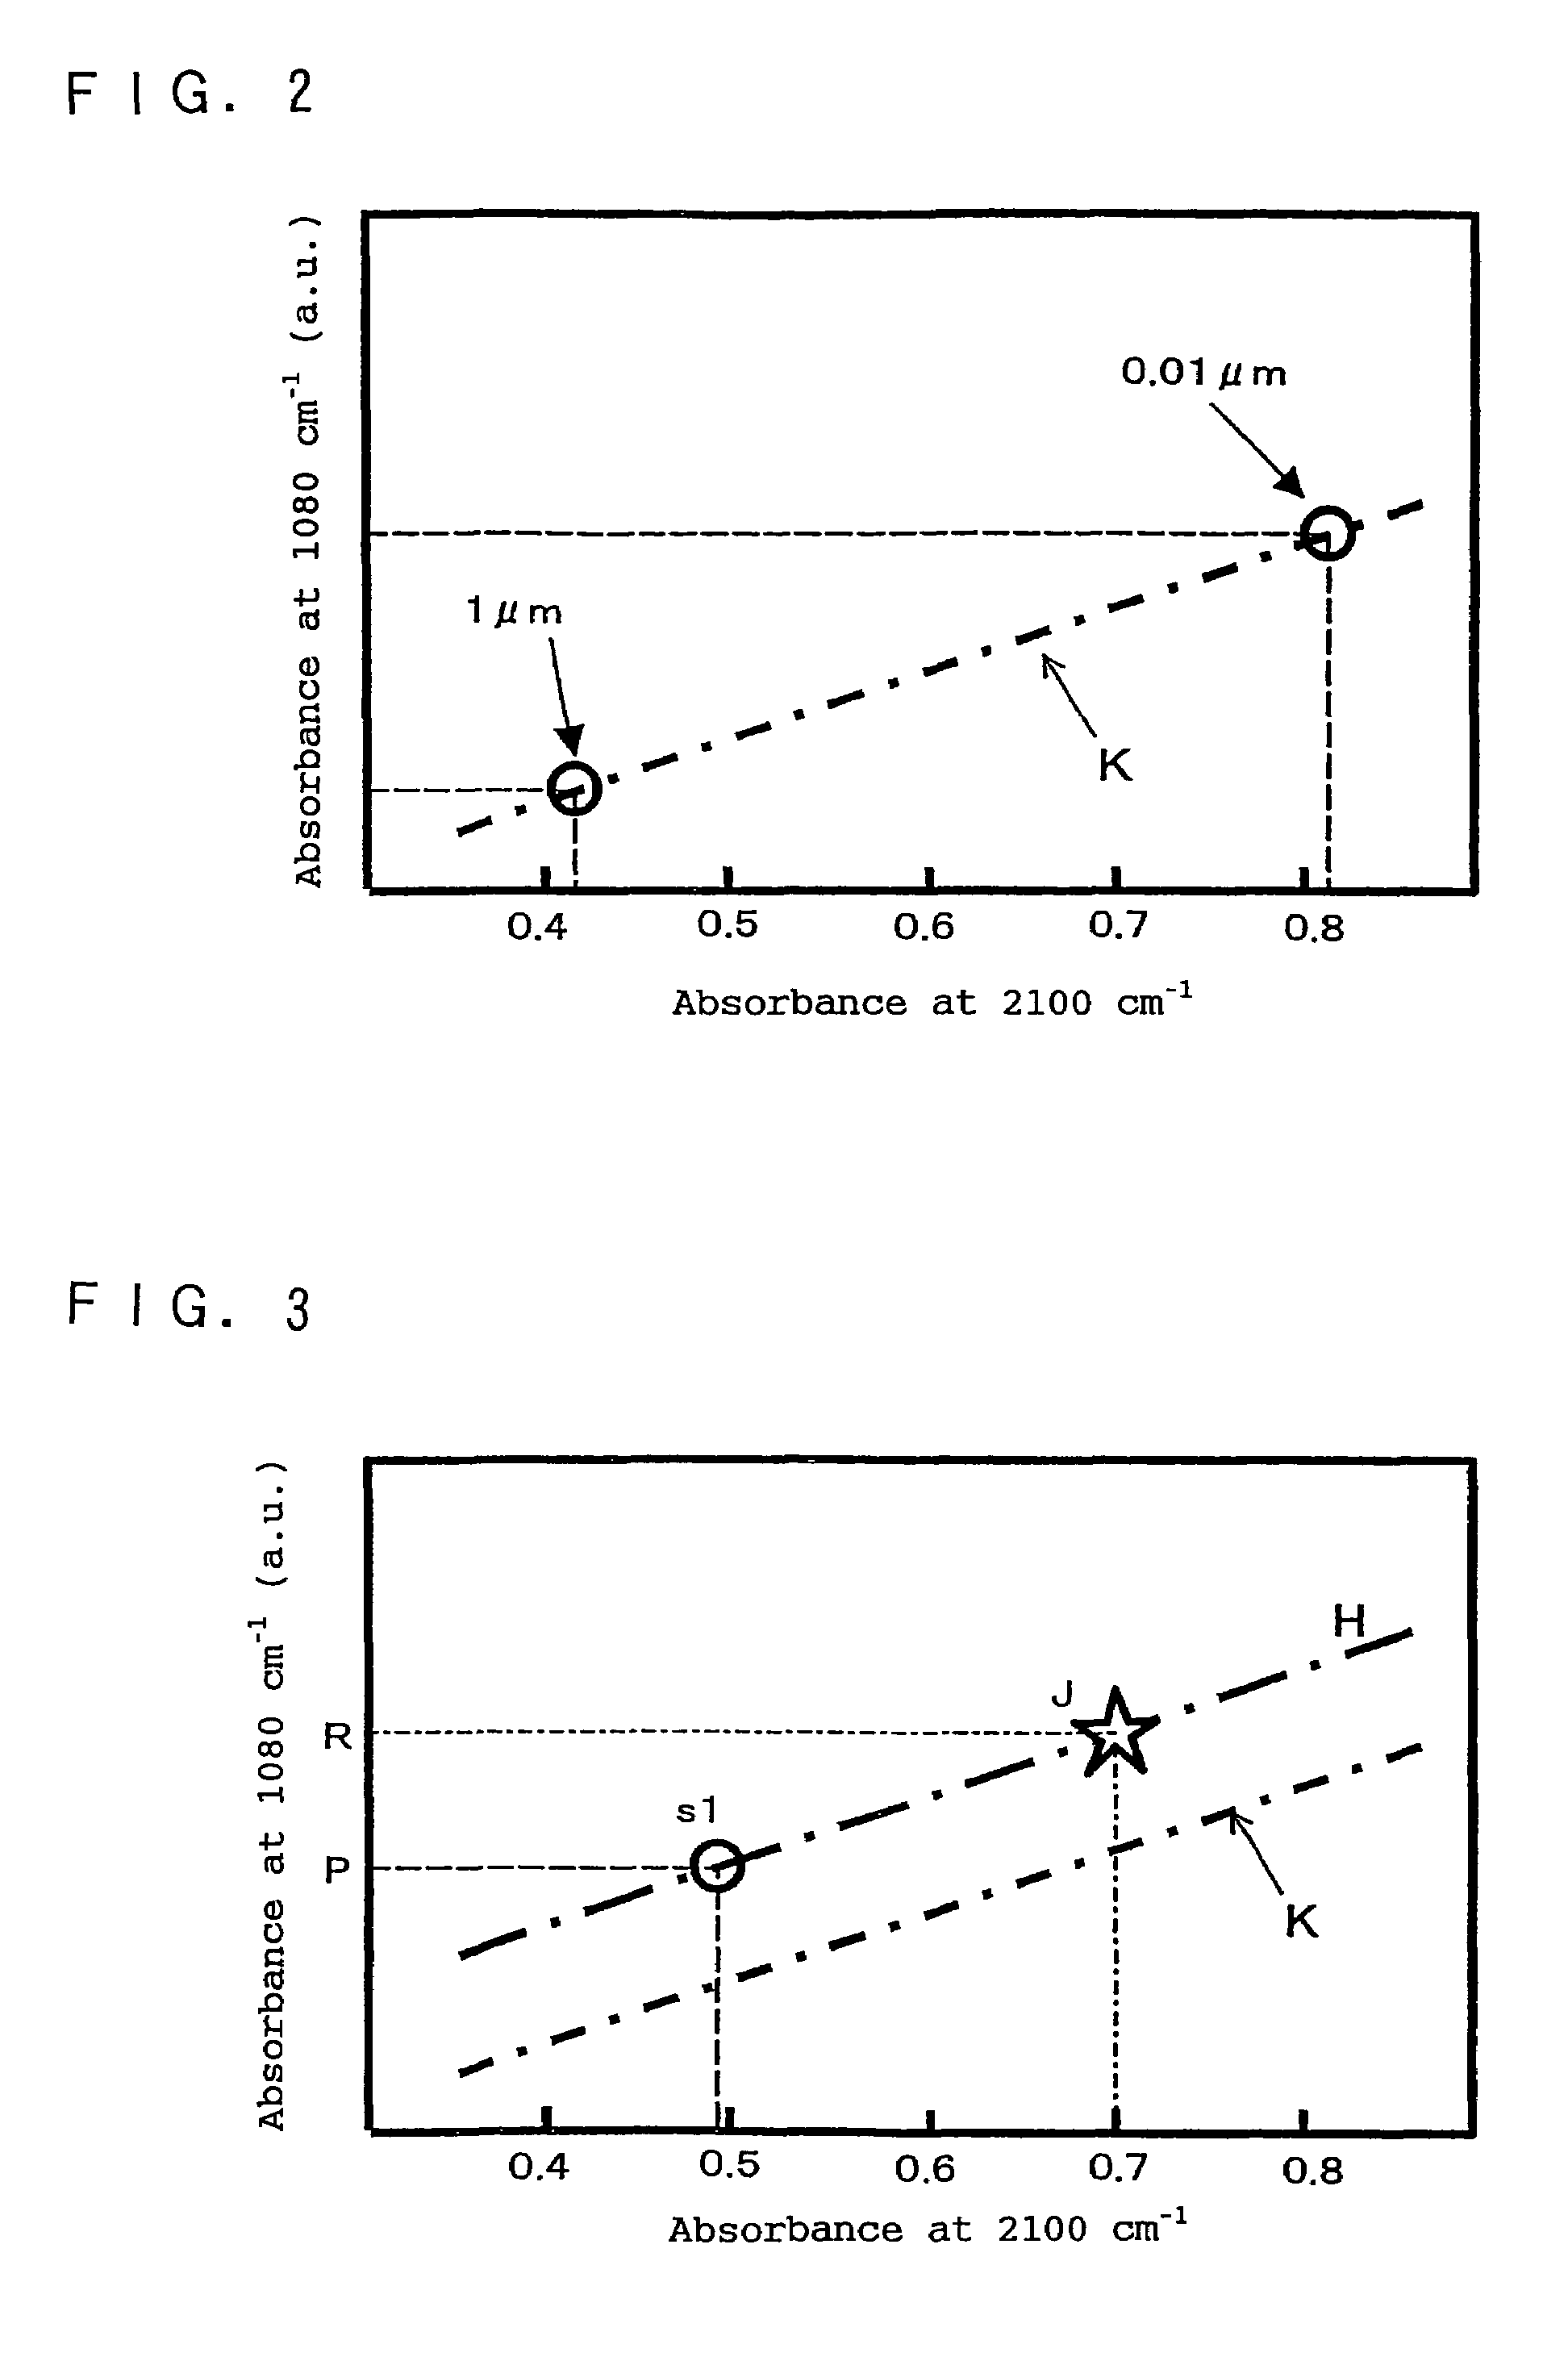
[0112]In this example, with the use of a measuring device shown in FIG. 1, the concentration of glucose was measured by the measuring method in accordance with the present invention. FIG. 3 is a graph used for explaining the process for correcting the wavenumber signal of glucose.
[0113]The measurement of this example was taken at lips as the measuring object 5. The wavenumbers used for preparing a calibration line K were 2100 cm−1 and 1080 cm−1.
[0114]The measuring device used in this example included an SiC light source as the light source 1, a germanium ATR element as the optical element 2, a pyroelectric sensor as the light detecting means 3 and a calculator as the signal processing means 4. Although not shown in the figure, a spectroscopic means was placed between the light source 1 and the ATR element 2.
[0115]Spectrum measurement was performed as follows. First, the lips as the measuring object 5 were made contact with the ATR element 2 of the measuring device. Then, light was i...
example 2
[0125]In this example also, the concentration of glucose was measured using the measuring method of the present invention and the measuring device shown in FIG. 1.
[0126]FIG. 4 shows two spectrums obtained from the first and second measurement carried out successively while the lip as the measuring object 5 was kept in contact with the ATR element 2. The thickness of the saliva layer gradually varied while the measuring object 5 was kept in contact with the ATR element 2 and thus the amount of the light reaching the lip differed, in other words, the signal information at the first and second measurement differed. For this reason, two different spectrums were obtained.
[0127]Then, the point represented by the absorbance a1 at 2100 cm−1 and the absorbance b1 at 1080 cm−1 in the first spectrum was referred to as “C1”, and the point represented by the absorbance a2 at 2100 cm−1 and the absorbance b2 at 1080 cm−1 in the second spectrum was referred to as “C2”. As shown in FIG. 5, the two p...
PUM
| Property | Measurement | Unit |
|---|---|---|
| wavenumbers | aaaaa | aaaaa |
| wavelength | aaaaa | aaaaa |
| thickness | aaaaa | aaaaa |
Abstract
Description
Claims
Application Information
 - R&D
- Intellectual Property
- Life Sciences
- Materials
- Tech Scout
- Unparalleled Data Quality
- Higher Quality Content
- 60% Fewer Hallucinations
Browse by: Latest US Patents, China's latest patents, Technical Efficacy Thesaurus, Application Domain, Technology Topic, Popular Technical Reports.
© 2025 PatSnap. All rights reserved.Legal|Privacy policy|Modern Slavery Act Transparency Statement|Sitemap|About US| Contact US: help@patsnap.com


