
Waveform complexity detector

Inactive Publication Date: 2005-08-23
AGILENT TECH INC
View PDF14 Cites 10 Cited by
  • Summary
  • Abstract
  • Description
  • Claims
  • Application Information

AI Technical Summary

Benefits of technology

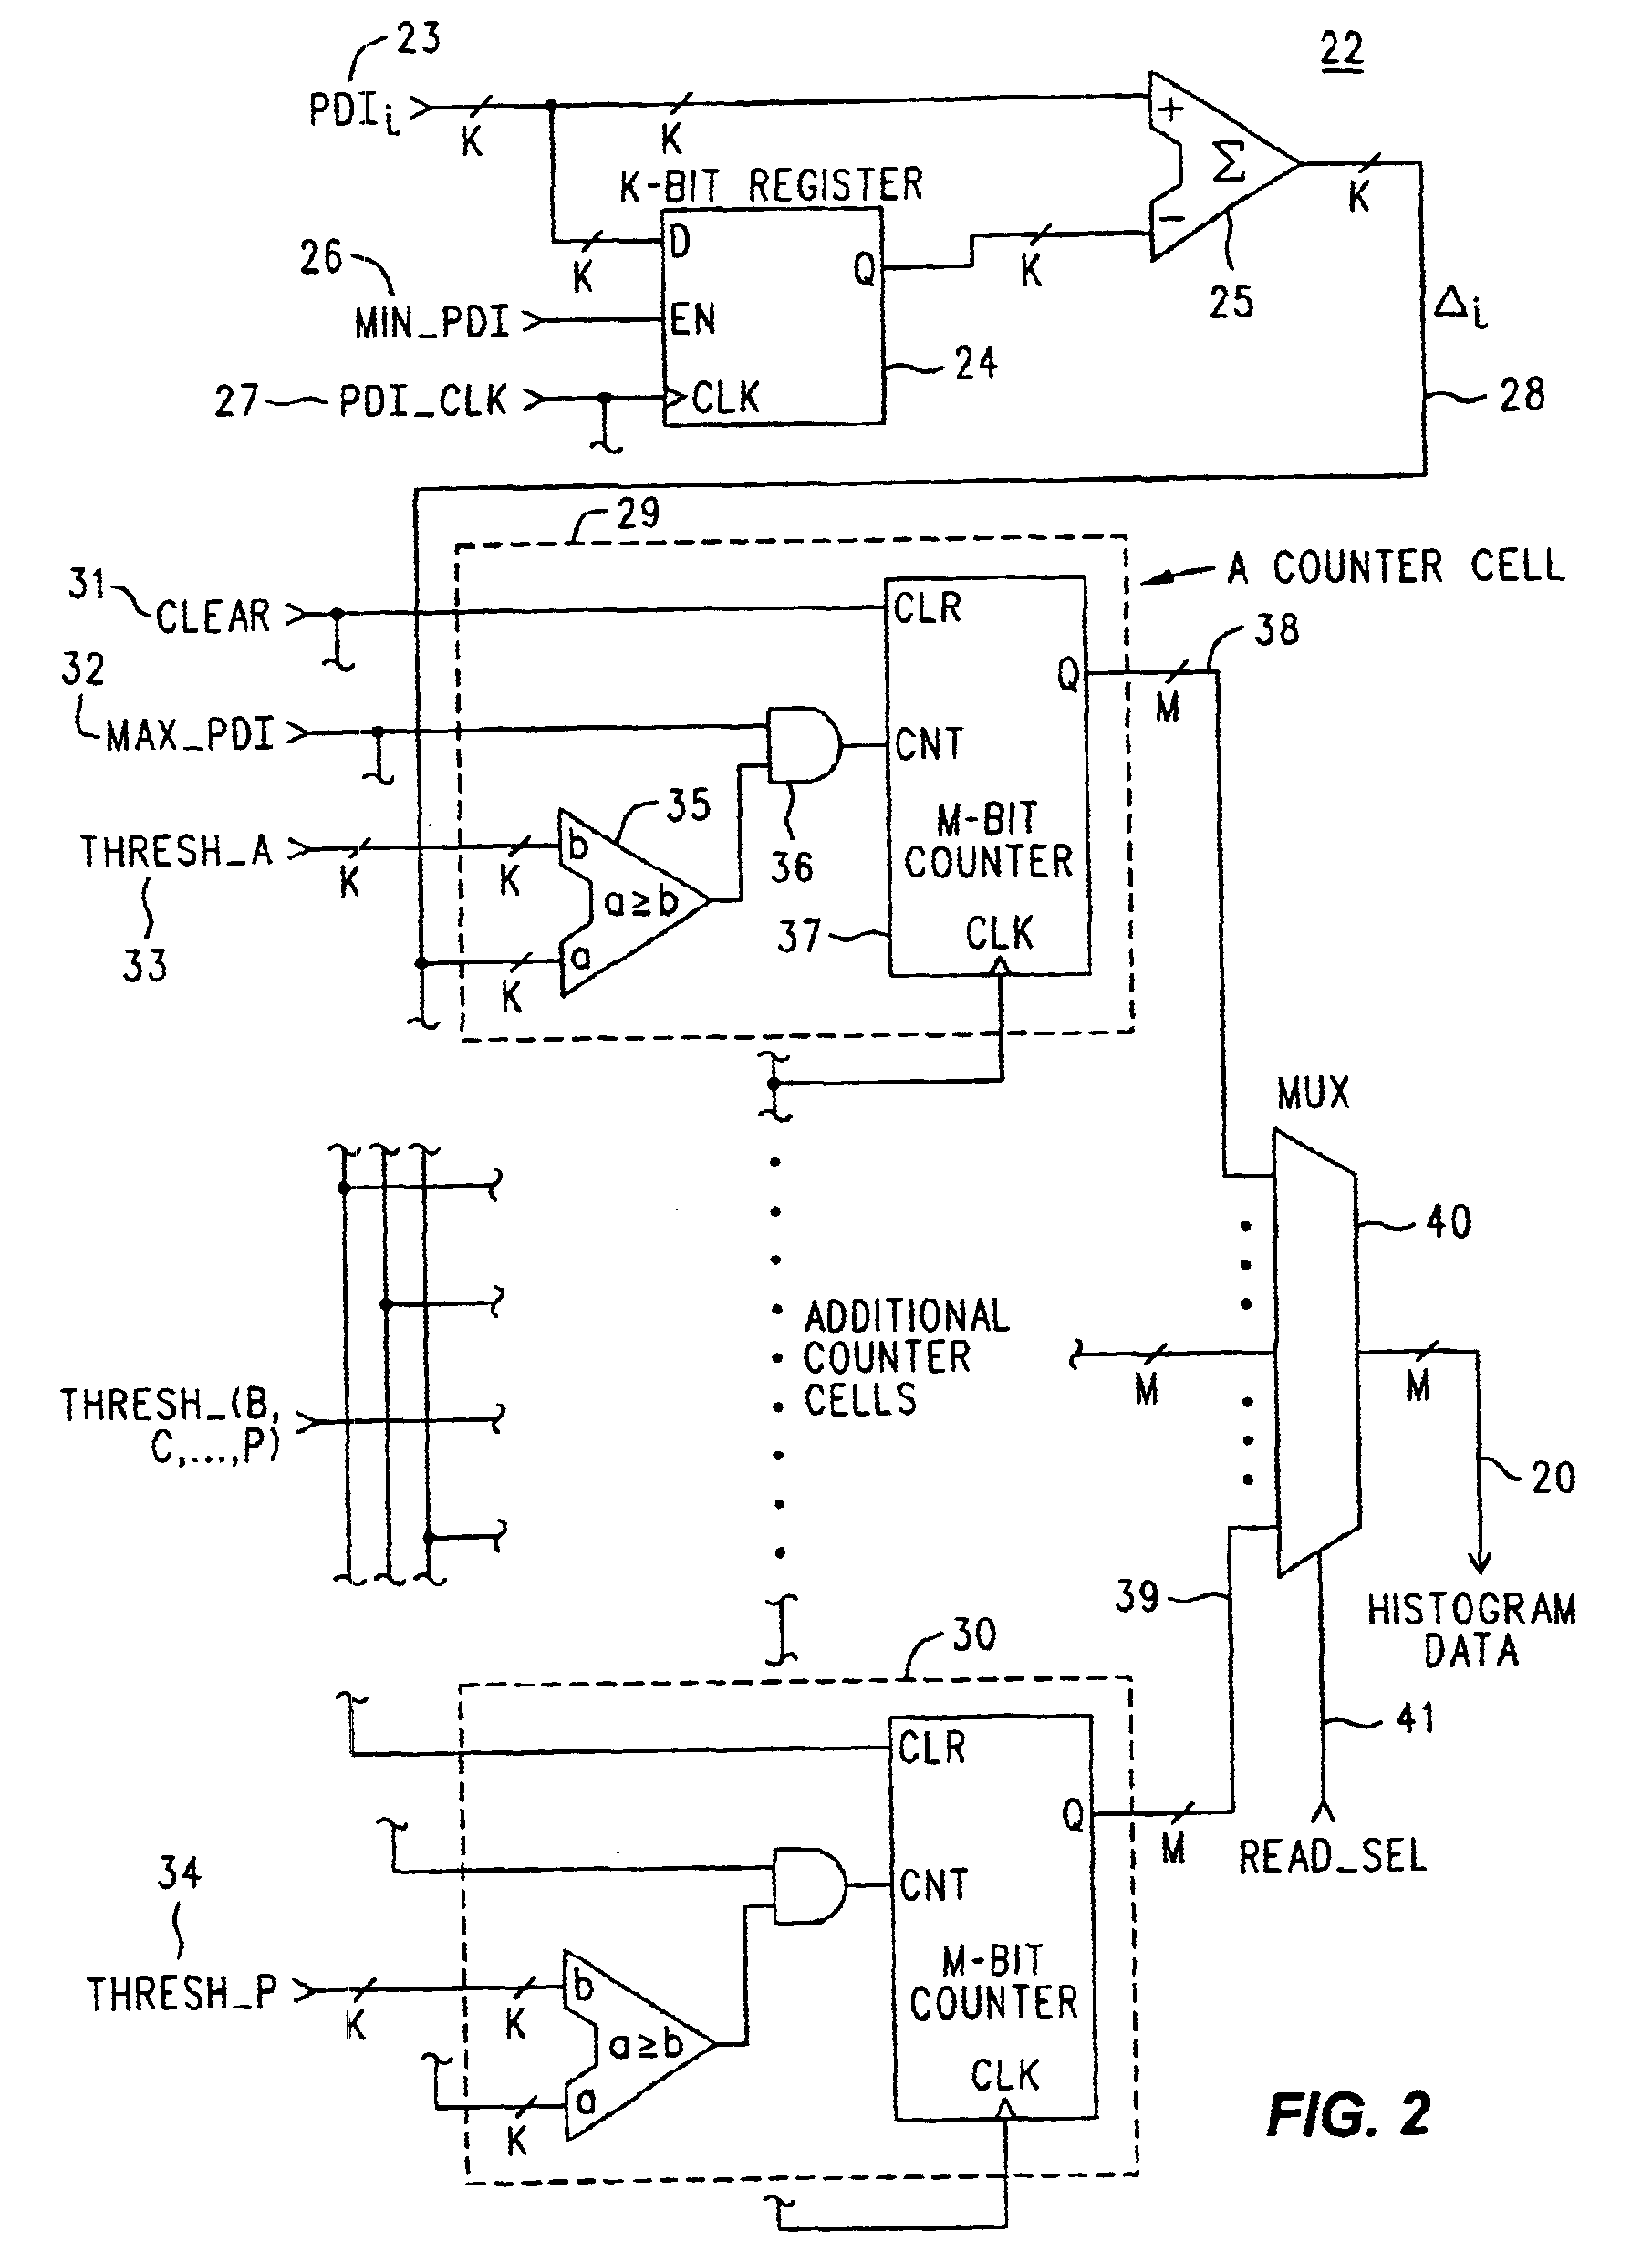
[0023]A suite of trial decimations is performed on a waveform that has been previously acquired and stored by test equipment. Each instance of the decimation process produces a sequence of packets that can be used for waveform rendering, waveform arithmetic, or other such process. Each sequence of packets for a trial decimation is also applied to a complexity detection circuit that produces an indication of the complexity of the resulting decimated waveform. Each packet in a sequence contains a decimation value to be used in place of acquisition values to be suppressed along a decimation sample width determined by a decimation factor. Each packet also includes the maximum and minimum values that occurred within the associated decimation sample width along the acquisition record. A number of counters (say, for example, sixteen) record for a trial decimation the number of instances when the differences in waveform extremes for the associated decimation sample widths exceed a corresponding number of (sixteen) selected thresholds. Complexity introduced by decimation will tend to produce waveforms having larger voltage excursions over the region of suppressed acquisition samples. The data in the counters is processed to produce a histogram corresponding to the decimation factor used. A suite of likely trial decimation factors is used. The histograms for trial decimations of varying trial decimation factors are compared to determine the relative amounts of complexity that varying degrees of decimation introduce. The resulting suite of histograms can be examined to assist in selecting an actual decimation factor that does not introduce significant additional complexity into the resulting decimated waveform. That selected actual decimation factor is then used for a subsequent post data-acquisition data-manipulation operation and / or in formatting a displayed subset of the acquired data. The sixteen counters may be configured to operate on one or two channels of data, to produce one sixteen-cell or two eight-cell histograms, respectively.

Problems solved by technology

Complexity introduced by decimation will tend to produce waveforms having larger voltage excursions over the region of suppressed acquisition samples.

Method used


Image

  • Waveform complexity detector
  • Waveform complexity detector
  • Waveform complexity detector

Examples


Embodiment Construction

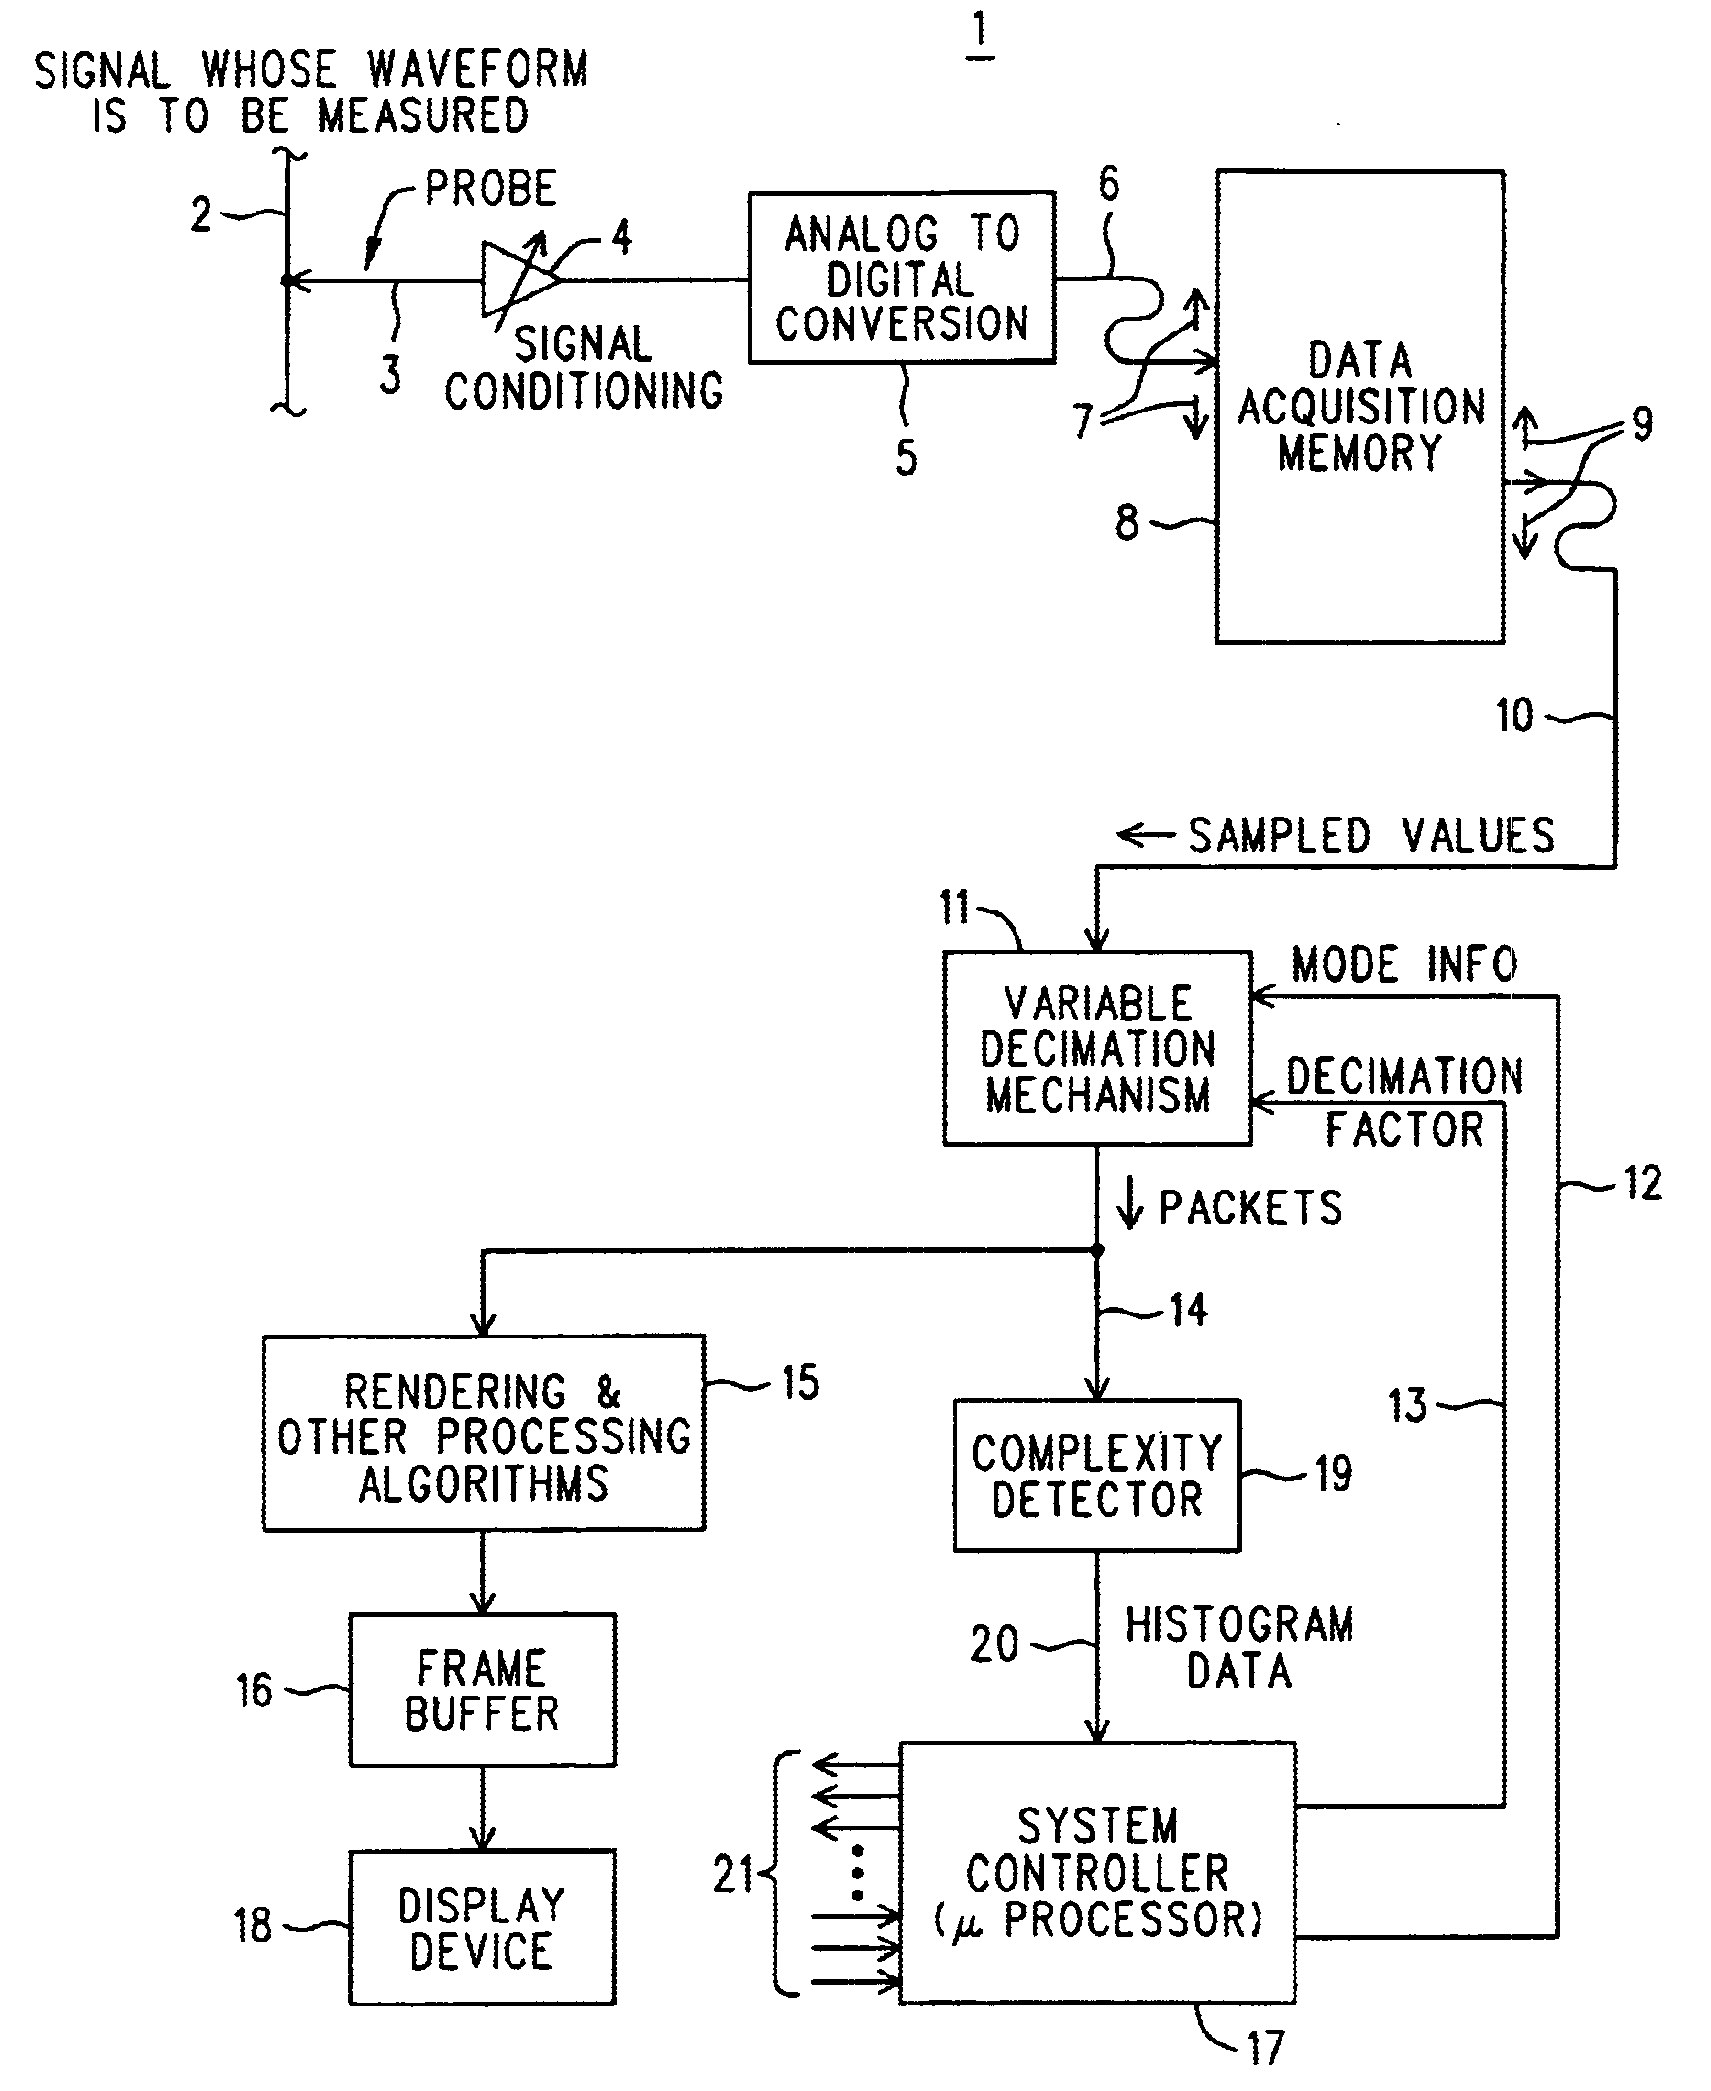
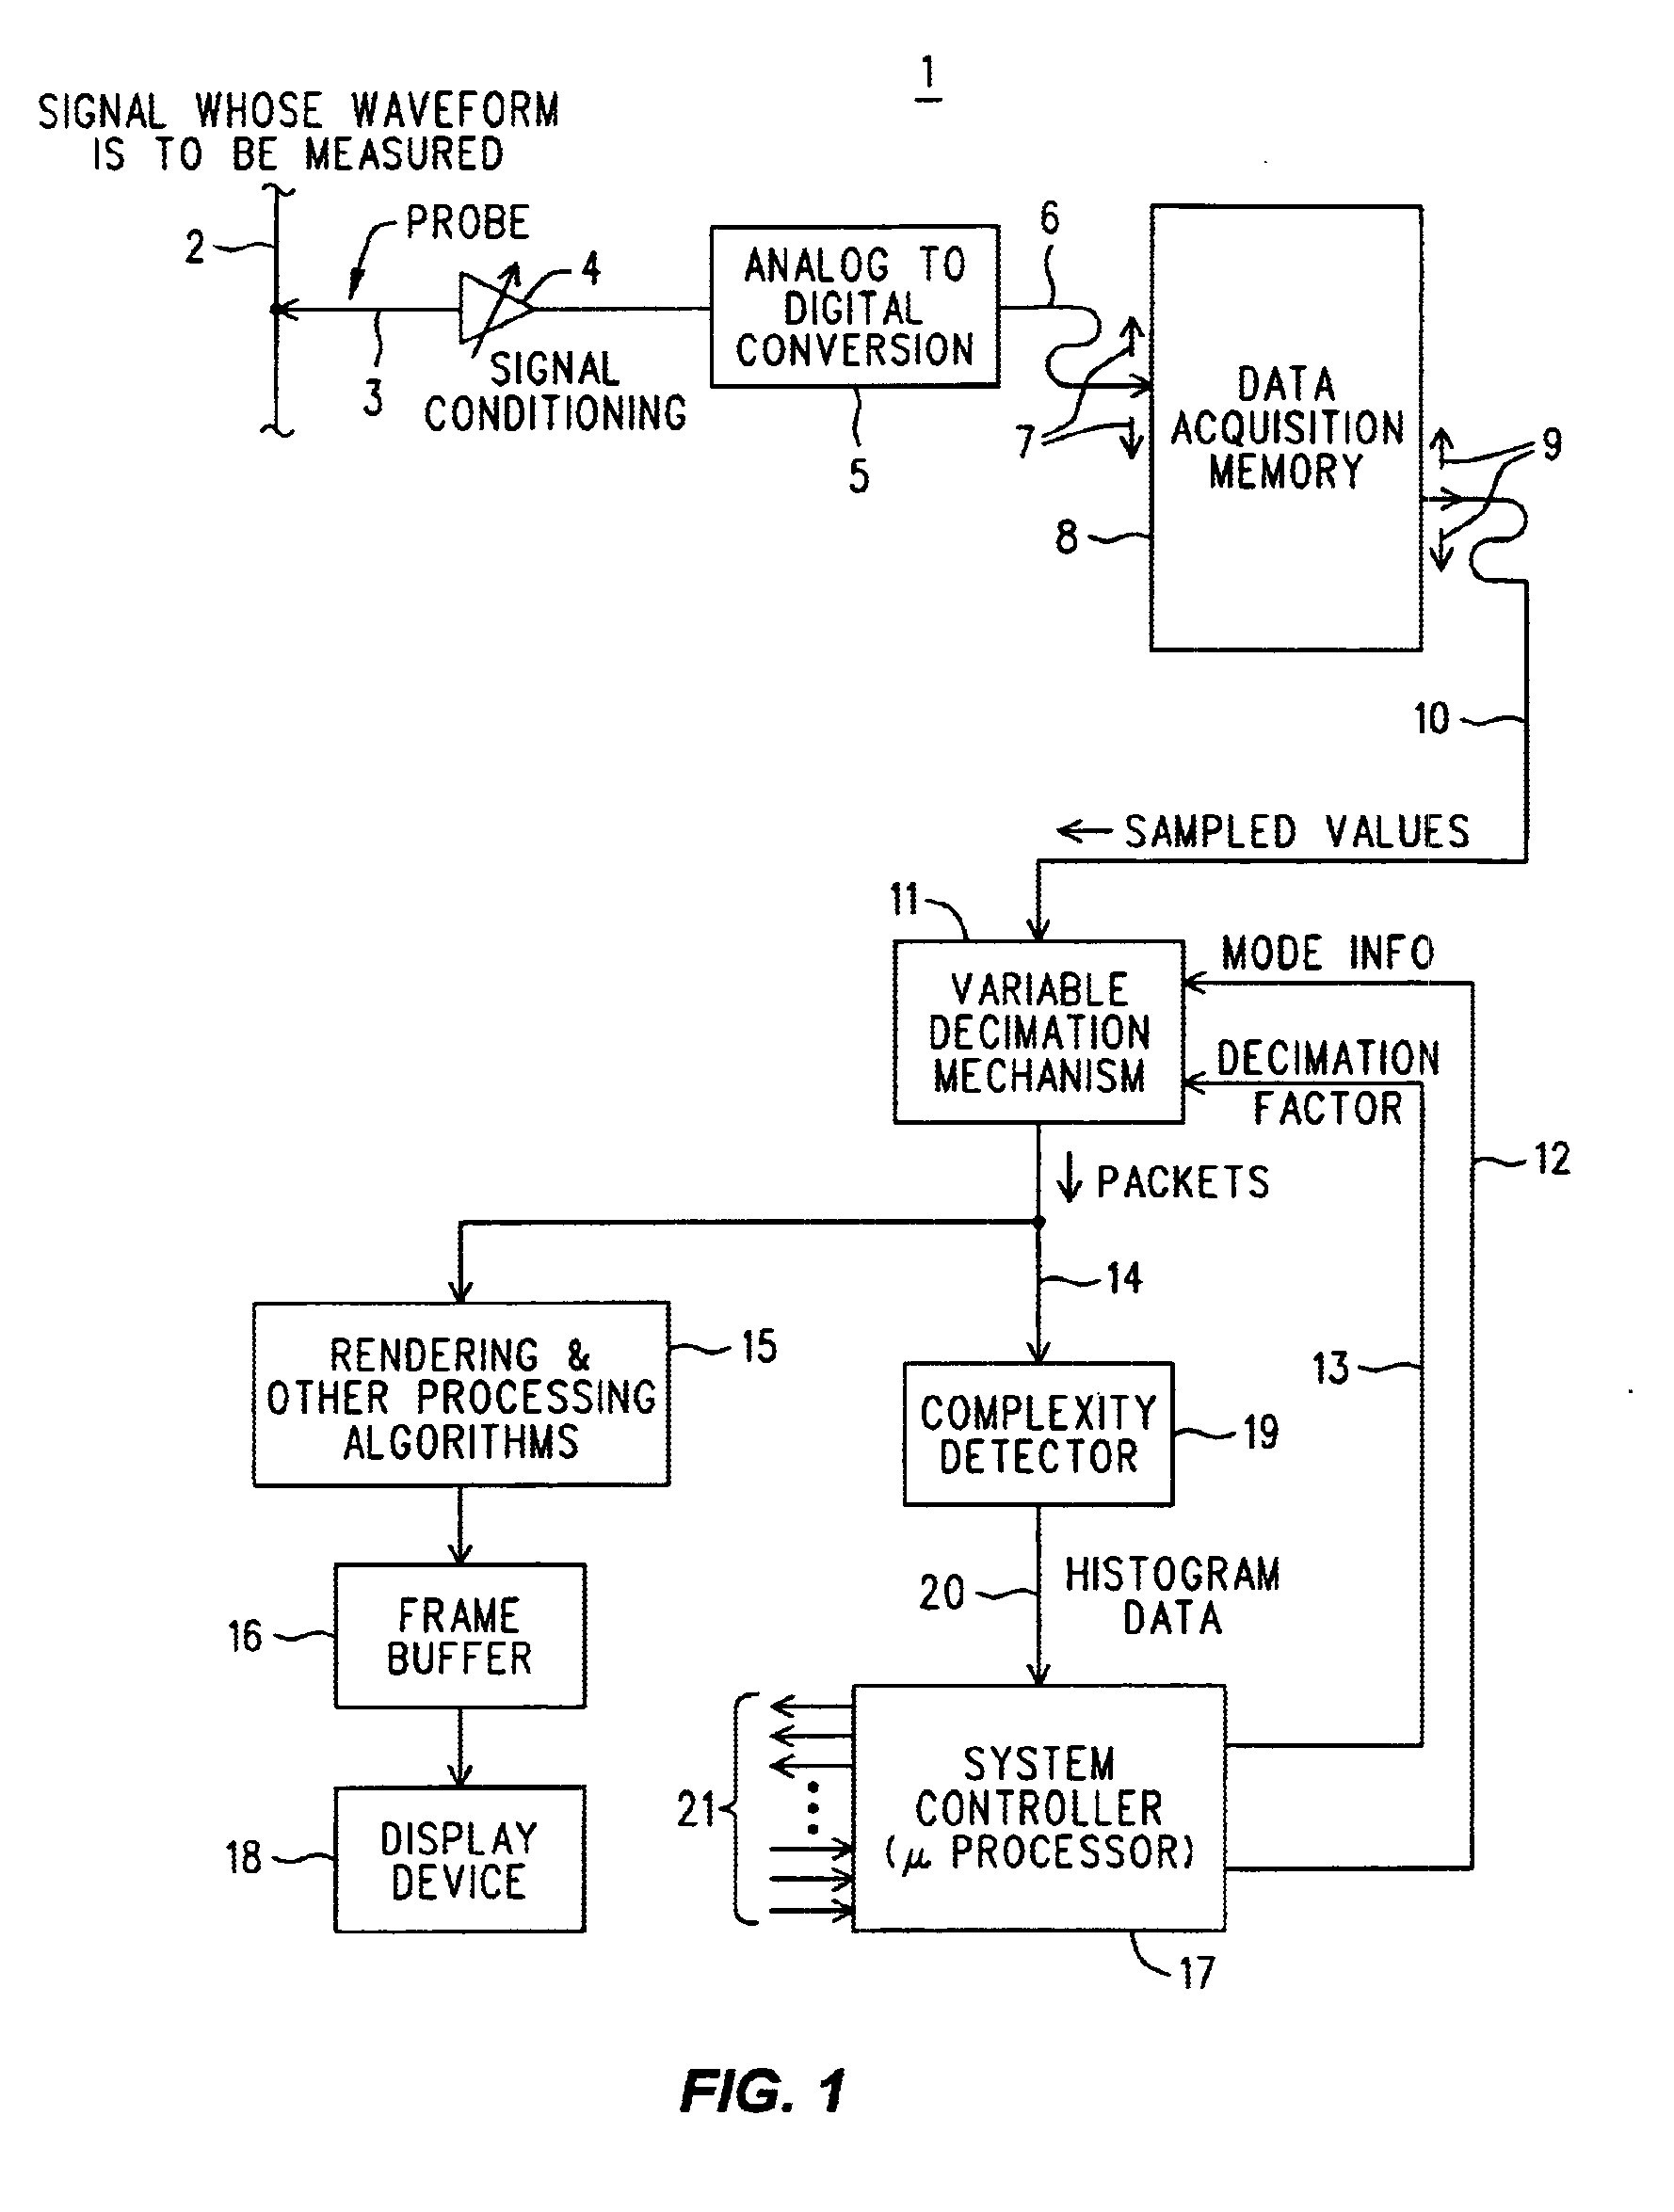
[0027]Refer now to FIG. 1, wherein is shown a simplified representation 1 of a block diagram of a digital waveform acquisition and display system, such as might be found in a digital oscilloscope, or other similar pieces of test equipment. Of course, when formulating FIG. 1 we had a particular topic in mind, and grouped various internal operations in ways that facilitate an explanation of that topic, so that certain expected functions may seem buried or suppressed (e.g., “Where do I set the trigger level?”). Fortunately, for the present purpose we don't need to examine every function one would normally expect to find in a 'scope, and that has allowed us to simplify the block diagram 1, the better to concentrate on the things that are of interest. Those things concern data flow through a variable decimation mechanism and the examination of the result with a complexity detector. We assume that the reader otherwise has at least a modest acquaintance with the basic conventional architec...


PUM


Abstract

Trial decimations are performed on an acquired waveform. Each trial produces a sequence of packets applied to a complexity detection circuit. Each packet contains a decimation value to be used in place of acquisition values to be suppressed along a decimation sample width. Each packet also includes the maximum and minimum values that occurred within the associated decimation sample. A plurality of counters record for a trial decimation the number of instances when the differences in waveform extremes exceed a corresponding plurality of selected thresholds. Complexity introduced by decimation will tend to produce waveforms having larger voltage excursions over the region of suppressed acquisition samples. The data in the counters is processed to produce a suite of histograms examined to select a decimation factor that does not introduce significant additional complexity.

Description

BACKGROUND OF THE INVENTION[0001]There are several classes of electronic test equipment that digitize waveform data that is later presented in one form or another on a display. Typically, the acquired sample data is digitized and then stored in a rather large memory (“deep” memory is the favorite industry term), while some subset of the acquired data stored therein is formatted and then presented in the display. It is typical to further store the formatted subset in, and display it from, a much smaller memory called a frame buffer whose addressability and data characteristics more closely match those of the display mechanism. Digital oscilloscopes, eye diagram analyzers, logic analyzer and timing analyzers come to mind immediately as generally operating in this way, although there may be others. Of these, we shall say at the outset that we are more interested in the class of equipment that digital 'scopes and eye diagram analyzers fall into, more than the class containing logic and ...

Claims


Application Information

Patent Timeline
Patent Type & Authority Patents(United States)
IPC IPC(8): G01R13/00G06F19/00G01R13/34
CPCG01R13/345
Inventor MONTIJO, ALLEN
Owner AGILENT TECH INC
Learn More