
Signal interpretation engine

a signal interpretation and engine technology, applied in the field of signal processing, pattern recognition, data interpretation, can solve the problems of not providing a system of analysis, classification or interpretation of source activity, and the type of algorithms typically limited to providing control

Inactive Publication Date: 2003-04-08
BRIGHT IDEAS
View PDF22 Cites 129 Cited by
  • Summary
  • Abstract
  • Description
  • Claims
  • Application Information

AI Technical Summary

Benefits of technology

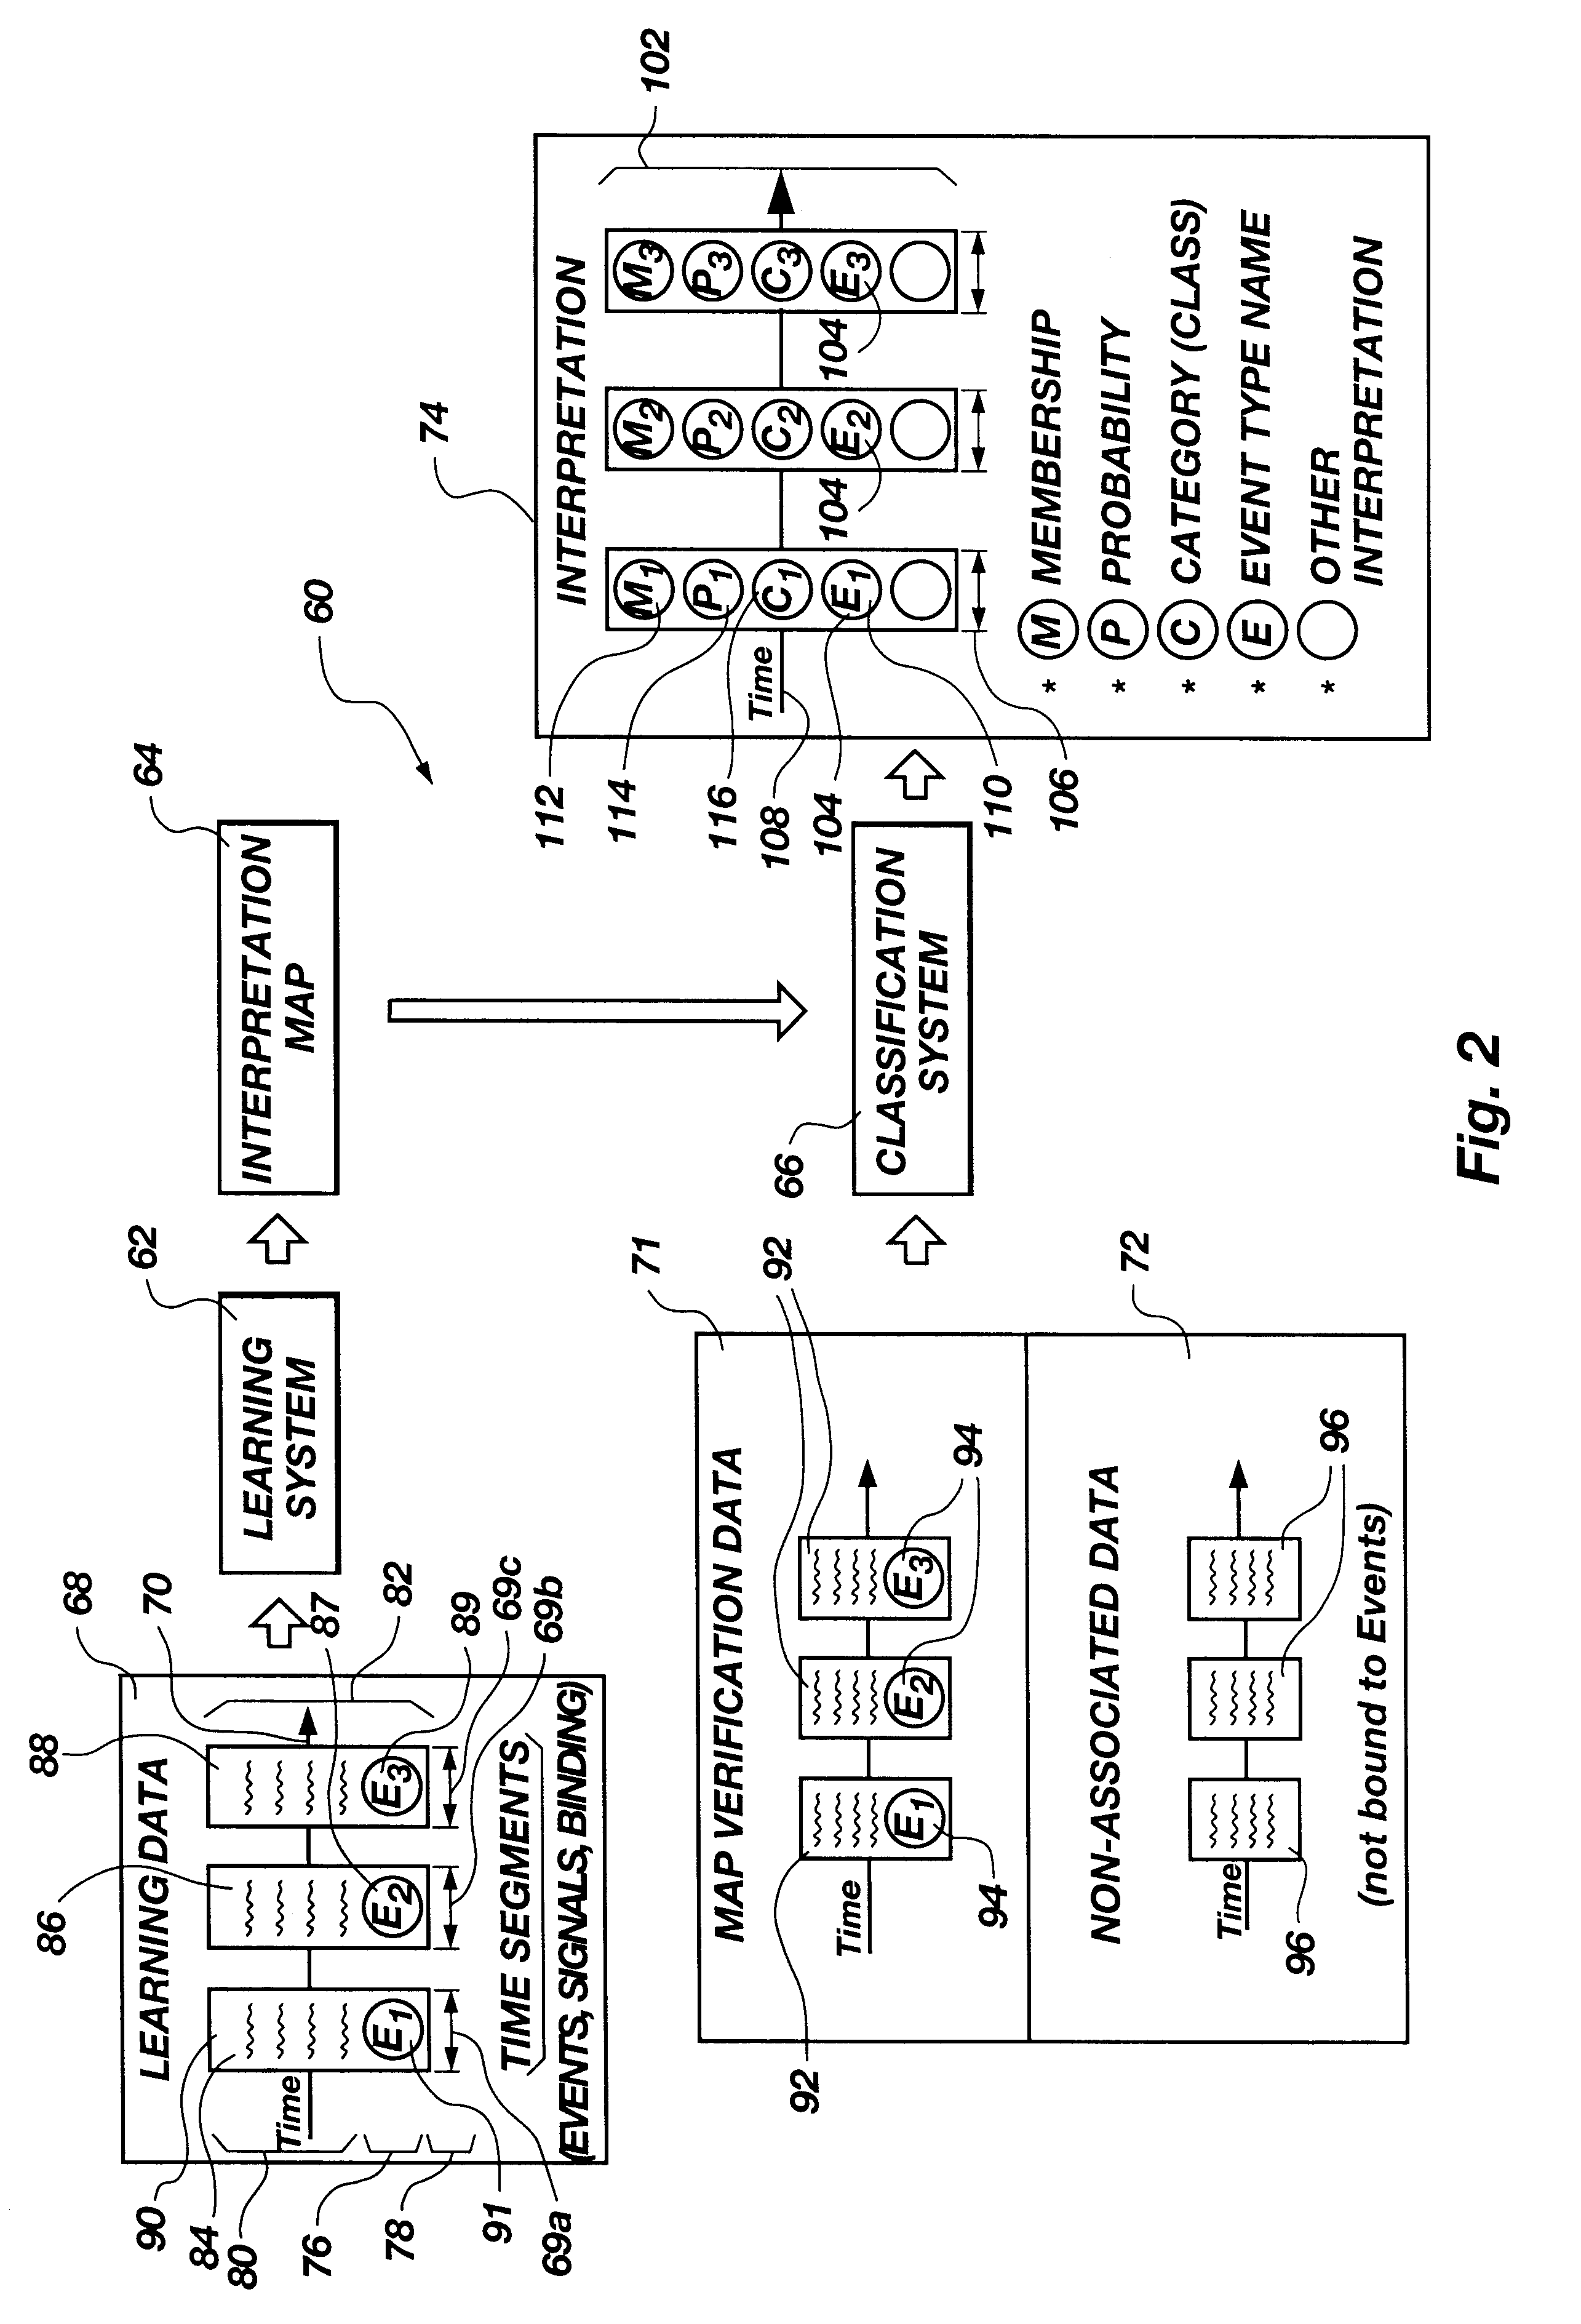
Further, the invention is a method of creating useful applications of the signal interpretation engine, the method comprising measuring and recording events and event types, measuring and recording signal data, establishing a correspondence between an event and a signal data epoch, labeling signal data epochs by event type, using labeled signal data epochs in a learning system to generate an interpretation map, using signal data and the interpretation map in a classification system to produce interpretations, and using the interpretations to provide a useful result.
It will also be appreciated that the present invention may process each signal piece or segment occurring over a time segment to determine a correlation between a known event and a particular, processed "feature segment." One presently preferred embodiment of the present invention also determines optimal ways to manipulate a signal for purposes of distinguishing an event from the signal.

Problems solved by technology

These types of algorithms are typically limited to providing control based on brainwave arousal level or Galvanic Skin Response (GSR), also known as skin conductivity.
The patent describes a method of getting closer to the source activity, but does not seem to provide a system of analysis or classification or interpretation of that source activity.

Method used


Image

  • Signal interpretation engine
  • Signal interpretation engine
  • Signal interpretation engine

Examples


example 2

Cancer Biofeedback Machine

Maps are used to help make cancerous tumors shrink and disappear by using tumor growth or decay measurements to label brainwaves, bodywaves or signals from the body, endocrine levels, behavior, environment, and stimulants such as drugs, diet, radiation, surgery, and exercise. The collection of multiple signal represented by brainwaves, bodywaves, endocrine levels, behavior, environment, stimulants, and other related entities area the "set of possibly correlating signal". This set of possibly correlating signal can be used in conjunction with a signal interpretation engine to aid in the therapy and cure of cancer. This can be accomplished by taking the following steps.

Step 1. Microchip sensors can be implanted inside a tumor or tumors or nearby them to detect changes in growth rate of the cancerous tissue by measuring temperature, chemical concentration potentials, electrical activity, and other physiological, physical, and chemical measures of tissue growth...

example 3

Stock Market Prediction Machine

The signal interpretation engine is used to predict whether a particular stock price will go up or down during a future period if predictive patterns exist within the collection of available signal such as stock prices, mutual fund prices, exchange rates, internet traffic, etc. The signal interpretation engine makes good predictions even if these patterns are distributed across multiple signal and through complex signatures in time and frequency. In order to predict whether a particular stock price will go up or down or predict some other future activity of a market measure, the following steps should be taken:

Step 1. Market historical data is used to create two prediction event lists for the two market features that are to be predicted. The two prediction event lists are made by first deciding which market feature is to be predicted, how far into the future it is to be predicted, and how much historical data is to be analyzed to make the prediction. F...

example 4

Spinal Cord Reconnection Machine

The signal interpretation engine is of significant use in the creation of "software spinal cord bridges" and in stimulating the growth and reconnection of spinal cord neural tissues. This is done by capitalizing on the signal interpretation engine's ability to identify, recognize and interpret subtle patterns of neural and muscular activity. A software spinal cord bridge or spinal cord reconnection machine is constructed as follows:

Step 1. Microchip or other electric sensors and stimulators are first placed on the surface of the patient's body (periphery, hands, arms, legs, feet, etc.), on the head (EEG sensors), and implanted within the body both above and below the spinal cord lesion or region of spinal cord damage at the basal ganglia and (if possible without damaging tissue) within the spinal cord itself. The sensors and stimulators should be tiny and numerous. Care should be taken to minimize detrimental effects so as to not further damage any ne...


PUM


Abstract

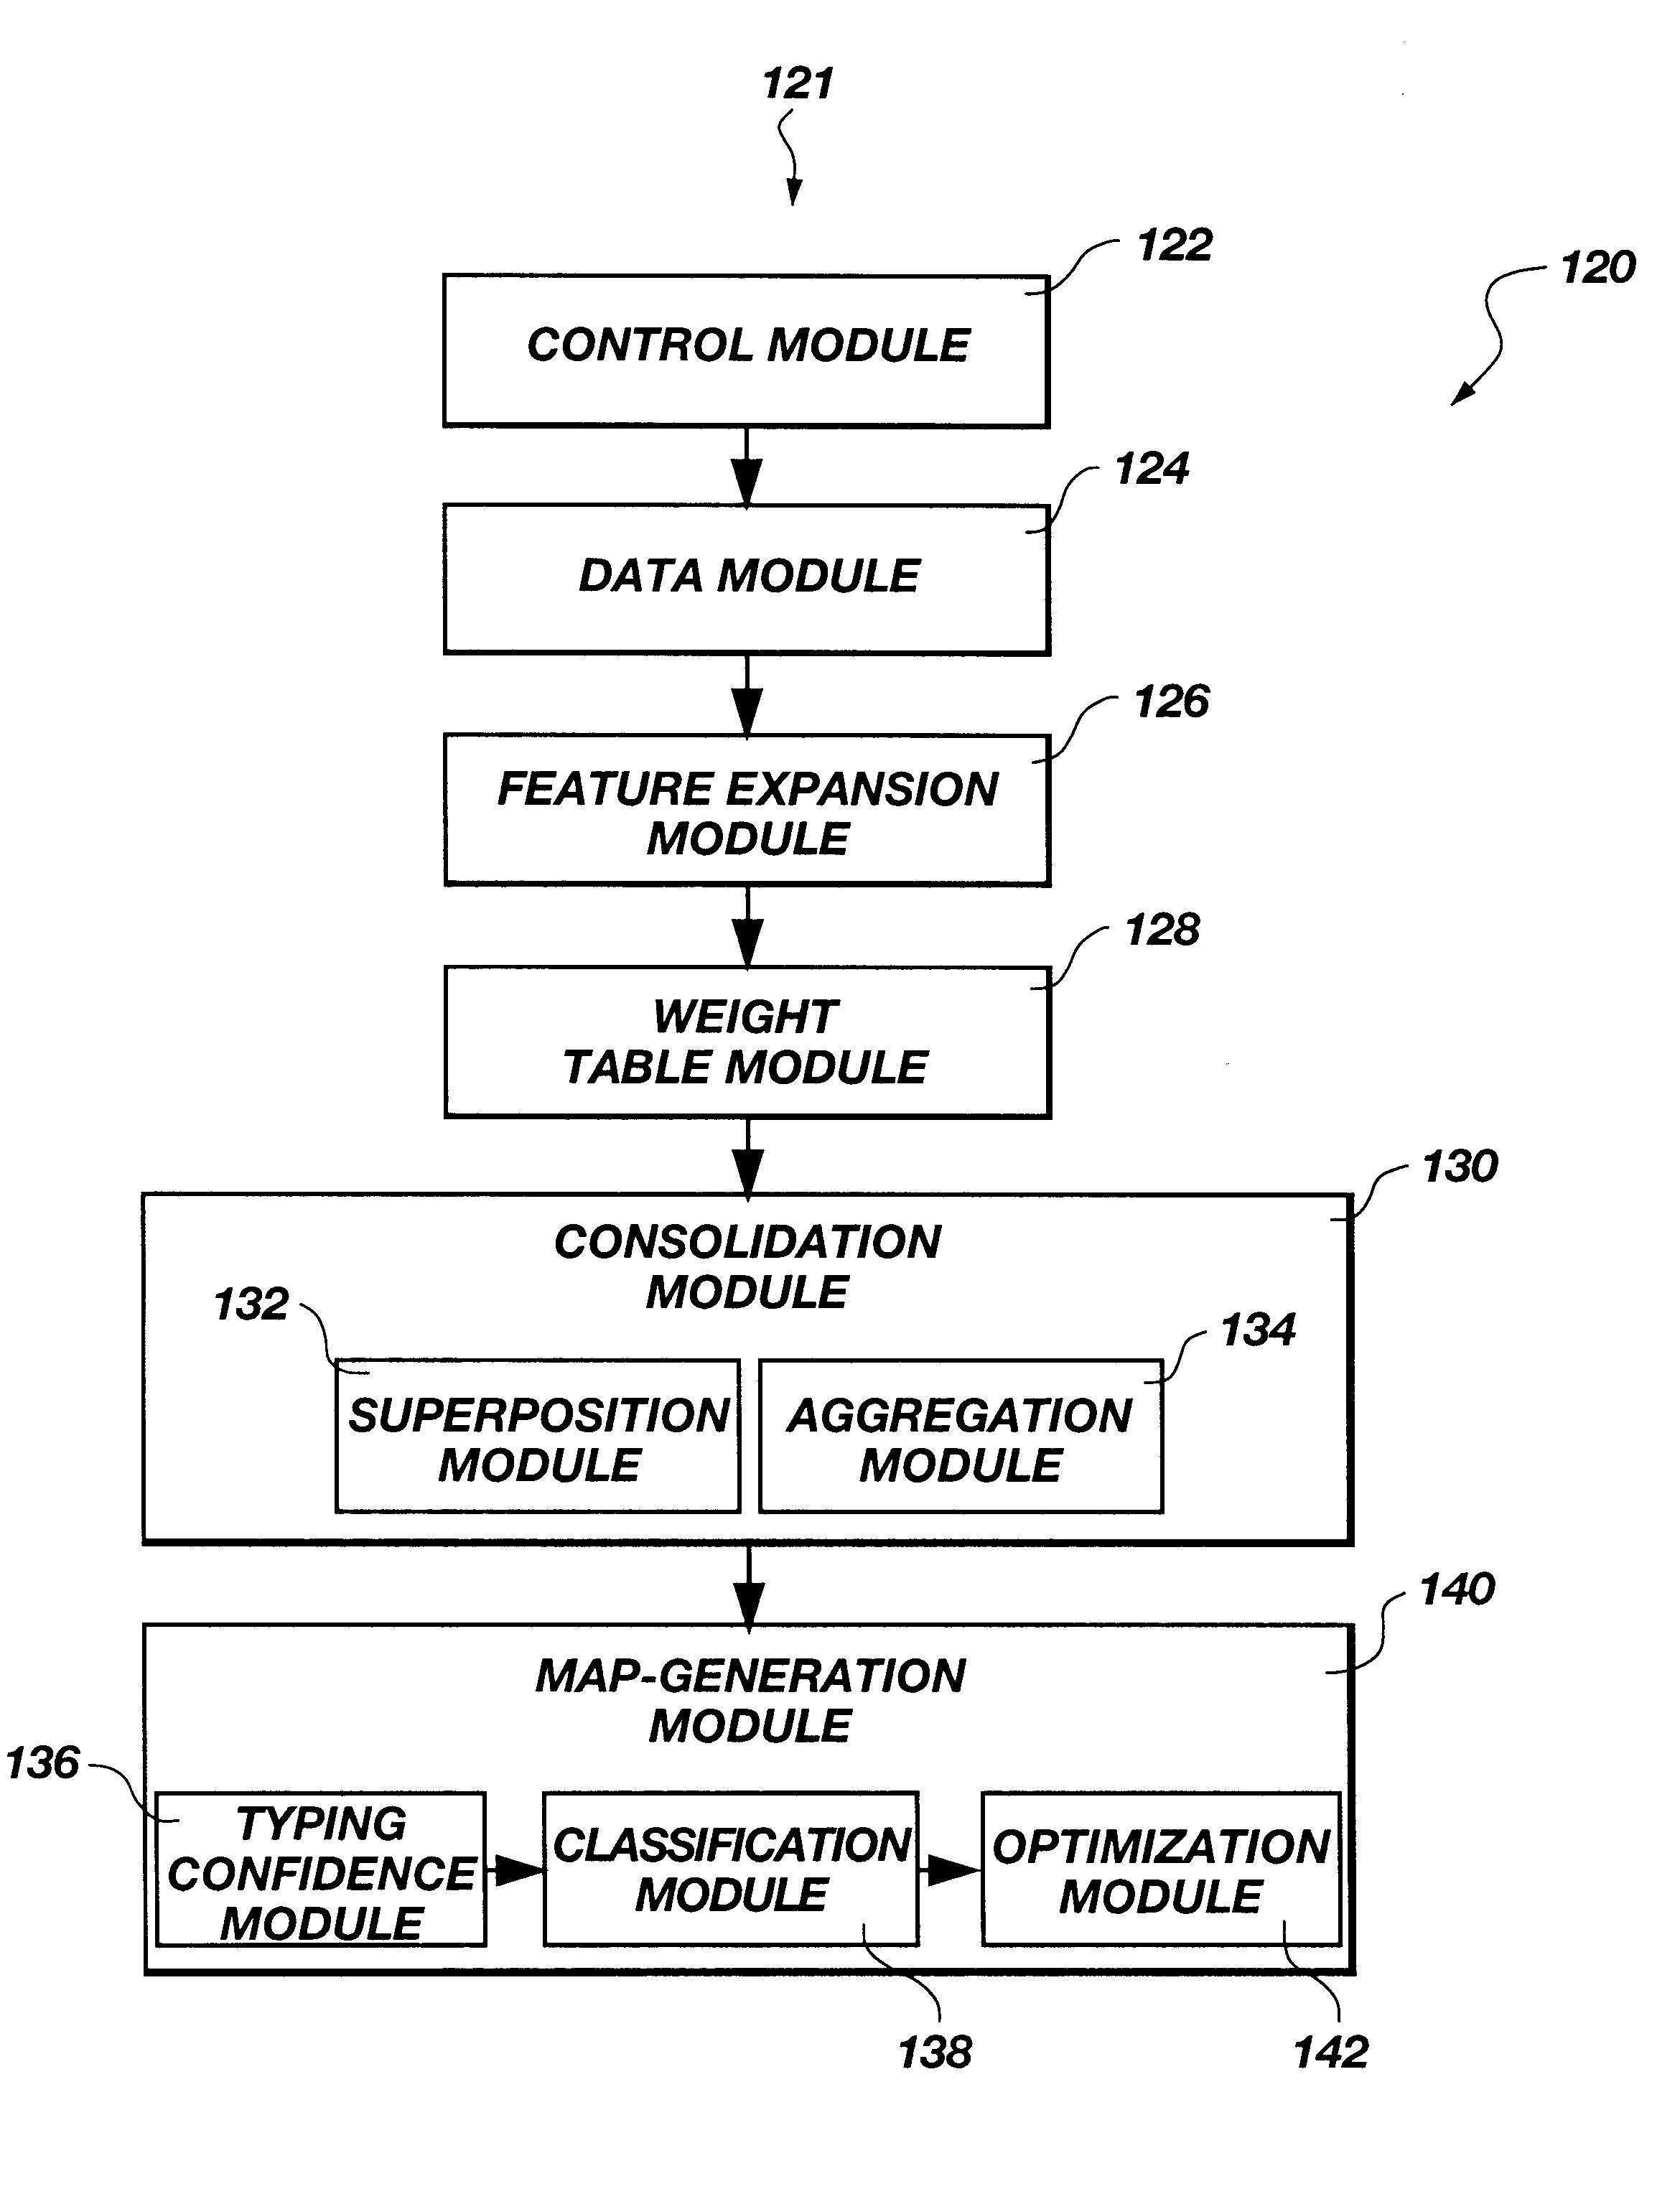
A signal interpretation engine apparatus and method are disclosed in certain presently preferred embodiment as including a computer programmed to run a plurality of modules comprising a feature expansion module, a weight table module, a consolidation module, and a map generation module. The feature expansion module contains feature operators for operating on a signal to expand the signal to form a feature map of feature segments Each feature segment corresponds to a unique representation of the signal created by a feature operator operating on the signal across an epoch. An epoch corresponds to an event occurring within a time segment. The weight table module provides a weight table having weight elements Each weight element has a weight corresponding to a feature segment of the feature map. The consolidation module provides a superposition segment by combining the feature segments of the feature map corresponding to the epoch by forming an inner product of the feature map and the weight table. The consolidation module also applies aggregators to consolidate the inner products or superposition segments into a distribution function representing an attribute over a domain reflecting a selected weight table, aggregator, and event type, corresponding to each value of the attribute. The map generation module produces an interpretation map that reflects a preferred weight table and aggregator to be applied to the signal data to characterize the event.

Description

1. The Field of the InventionThis invention relates to signal processing and, more particularly, to novel systems and methods for pattern recognition and data interpretation.2. The Background ArtEnvironmental data and stimuli have been the subject of much study for the purpose of organizing, interpreting and making useful for a future application the information that can be learned from the data.Some sources of data that have captured the interest of those skilled in the art include neural functions. A neurocognitive adaptive computer interface method and system based on on-line measurement of the user's mental effort is described in U.S. Pat. No. 5,447,166. This method appears to be a neural network algorithm trained on data from a group of subjects performing a battery of tasks to estimate neurocognitive workload. It seems to represent a very specific algorithm trained on group data to estimate another very specific cognitive feature of brainwaves. It does not appear to be a gener...

Claims


Application Information

Patent Timeline
Patent Type & Authority Patents(United States)
IPC IPC(8): A61B5/04A61B5/0476G01V1/28G01V1/30G06F17/00G06F19/00
CPCA61B5/04012A61B5/0476G01V1/282A61B5/7267G06F19/3443G06K9/00536G06K9/6253G01V1/30A61B5/04008A61B5/407G16H50/70A61B5/245A61B5/316A61B5/369G16Z99/00G06F2218/12G06F18/40A61B5/372
Inventor COOK, DANIEL REED
Owner BRIGHT IDEAS
Learn More