Method of checking the performance of a flow cytometer instrument and apparatus for executing said method as well as a standard kit therefore
- Summary
- Abstract
- Description
- Claims
- Application Information
AI Technical Summary
Benefits of technology
Problems solved by technology
Method used
Image
Examples
embodiment
Preferred embodiment
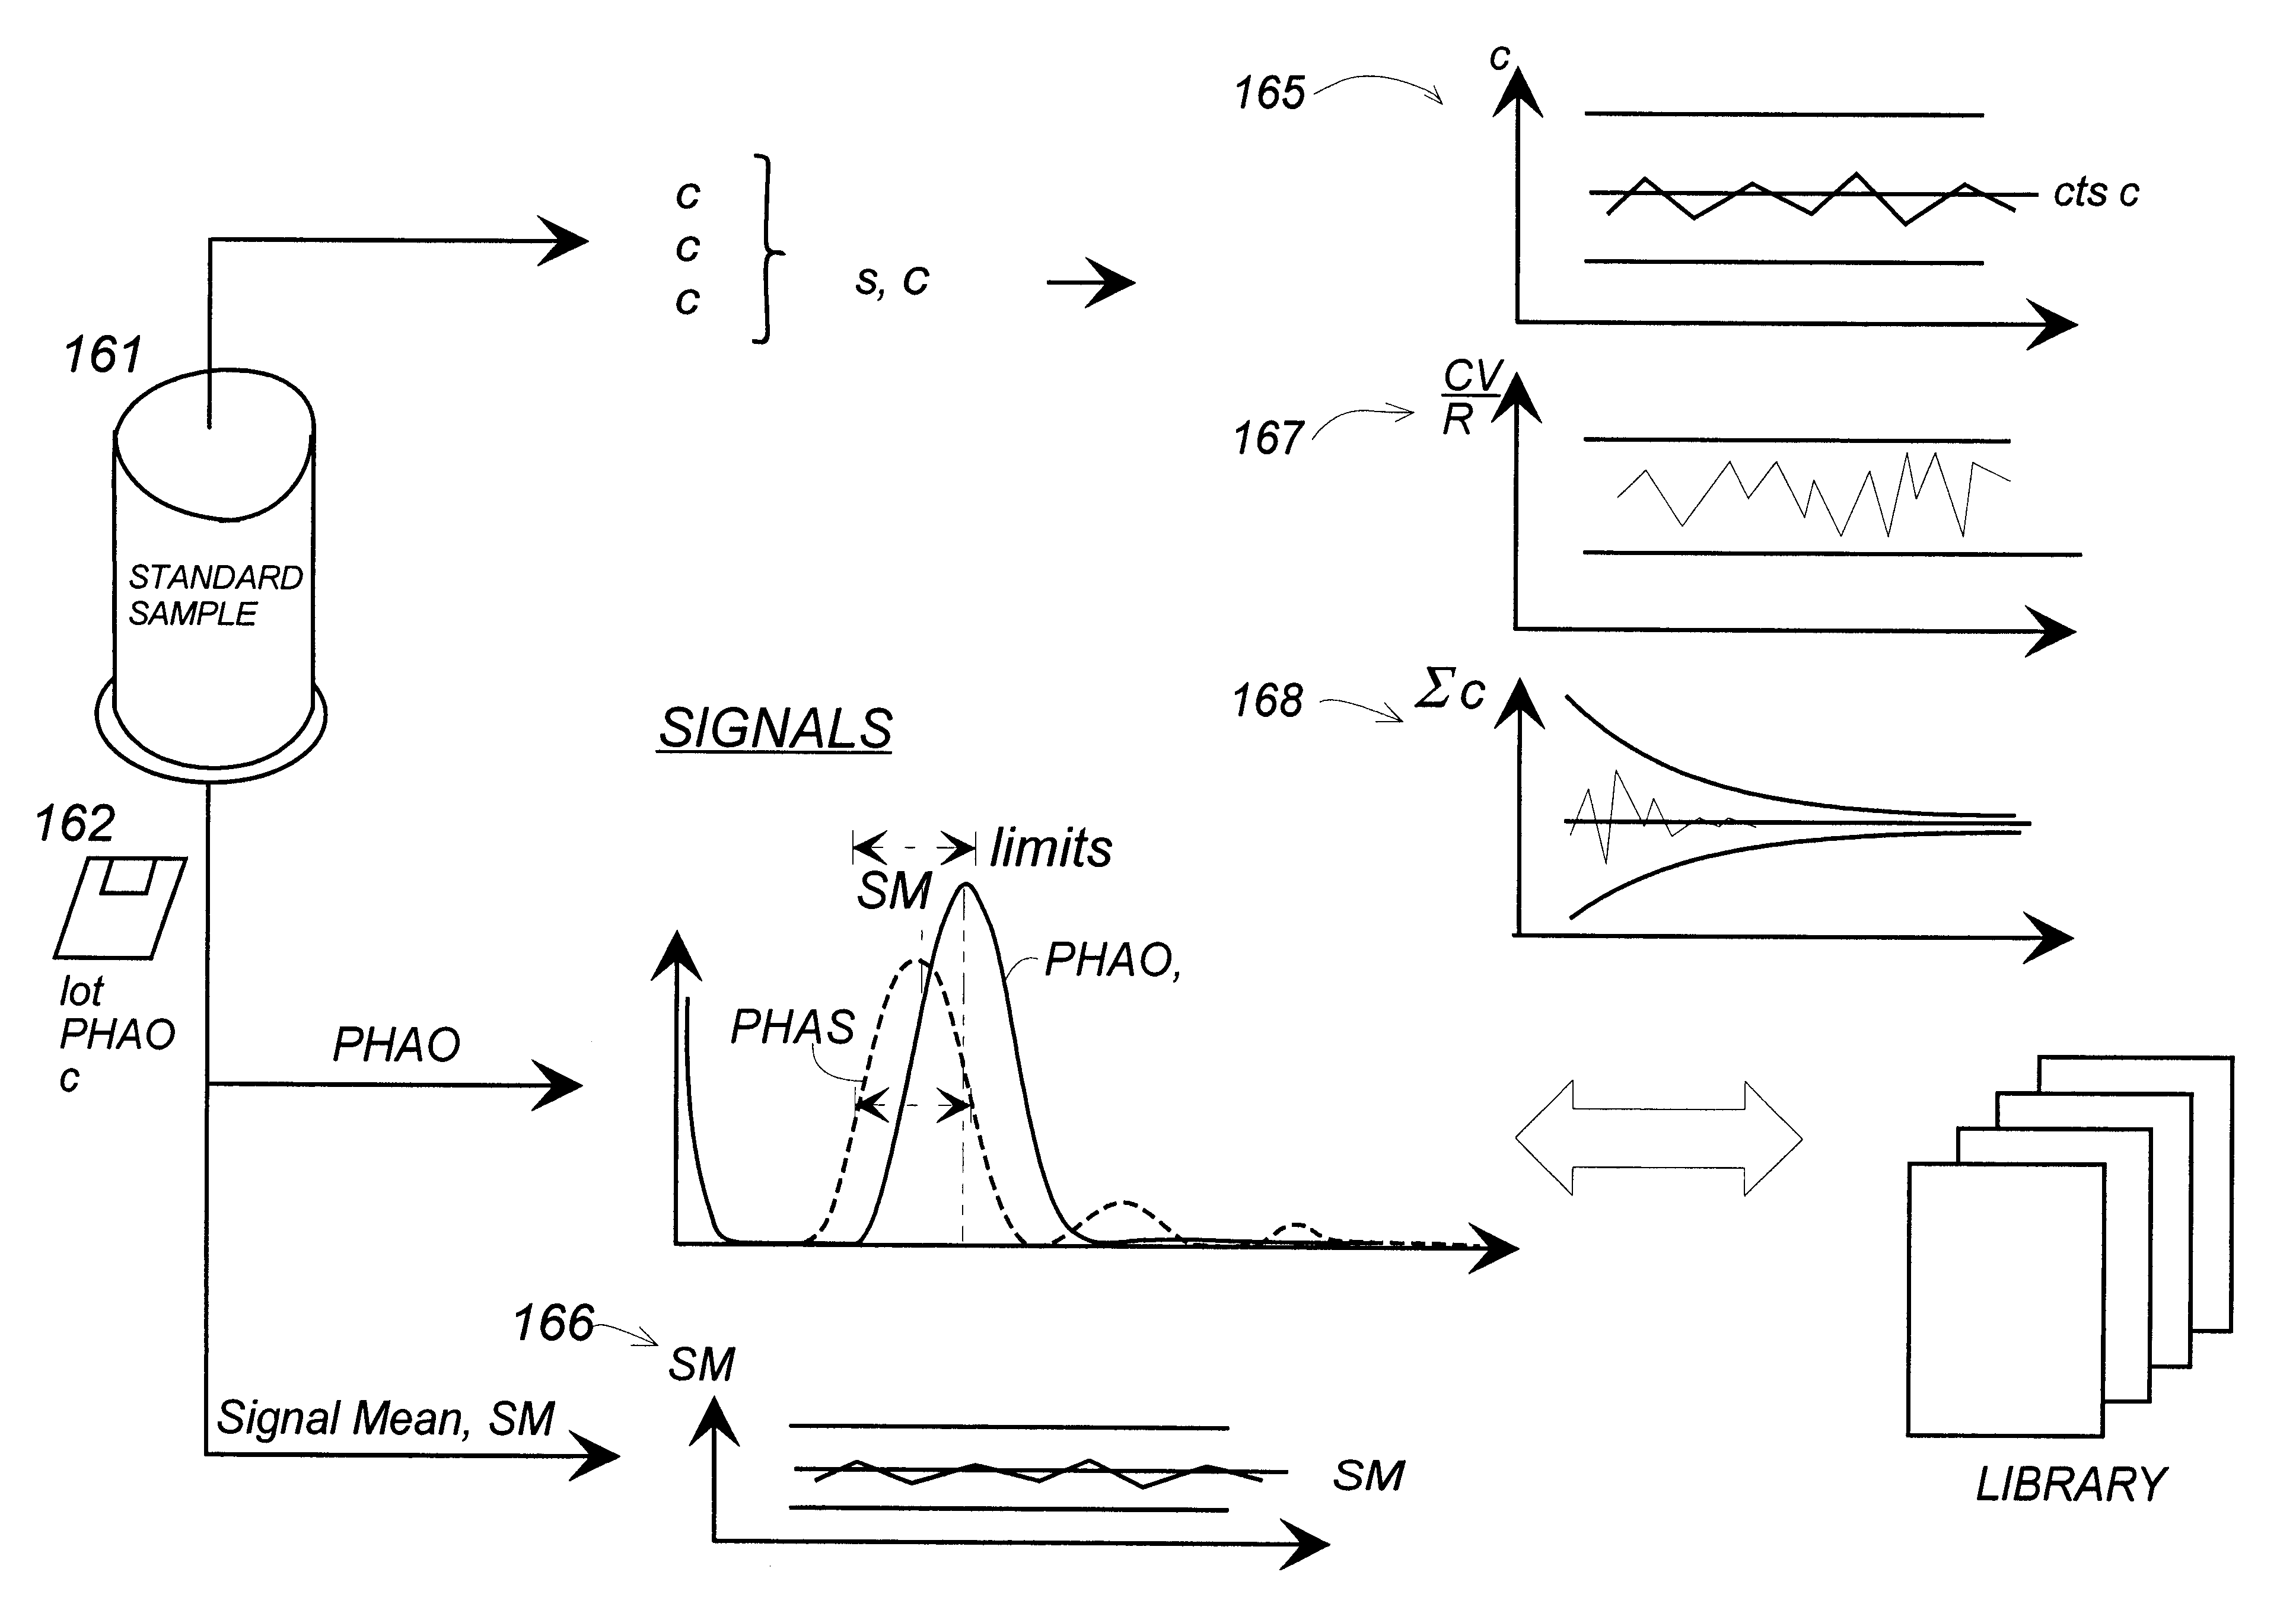
The principles of a preferred embodiment of the present invention is shown schematically in FIG. 16. The input to the instrument is a standard fluid sample 161 and an information carrier such as a disk 162, comprising information on the lot and software.
The following actions / operations are carried out:
Every 2 hours a computer prompt tells the user to insert a standard sample 161 (from a lot delivered by the supplier)
the flow cytometer measures the standard sample a plurality of times, e.g. three times, i.e. obtains three counts, c.sub.1, c.sub.2, c.sub.3, each of which represents the number of particles passing by during a predetermined measurement period of a few seconds, e.g. 2 sec, (preferably, a period according to normal operation mode of the instrument). The count is assigned a consecutive record or registration number, e.g. No 58.1, 58,2, 58.3, 59.1 . . .
The data processing equipment including appropriate software calculates
the number of particles c.sub.1,...
example
When the user gets a message or remark, e.g. as indicated in table 1 for the records 19, 49, 51, 58 and 59, he should as soon as possible study the latest measurement results. The software is "windows.RTM."-based, providing for display of several "windows". FIG. 9 shows a list of "check measurements" or results of the same kind shown in table 3. The highlighted sample No. 58 has got a remark. Accordingly, the user has asked for a display of "Result details for 58". The result details are displayed in table form (also shown in table 2 page 15) including six rows (comprising the three measurements (rep 1, rep2, rep3), an average value, CV% (a theoretical standard deviation), and the lot average), and eight columns (comprising the values found for the count, R, Signal Mean, (58), Signal Width (8), Z (a value which quantifies the discriminating space (separation) between noise and signals), Discriminator, Noise Level, and Remarks). In a third window the lot data are displayed. Further, ...
PUM
 Abstract
Description
Claims
Application Information
 - R&D
- Intellectual Property
- Life Sciences
- Materials
- Tech Scout
- Unparalleled Data Quality
- Higher Quality Content
- 60% Fewer Hallucinations
Browse by: Latest US Patents, China's latest patents, Technical Efficacy Thesaurus, Application Domain, Technology Topic, Popular Technical Reports.
© 2025 PatSnap. All rights reserved.Legal|Privacy policy|Modern Slavery Act Transparency Statement|Sitemap|About US| Contact US: help@patsnap.com


