
Method and apparatus for minimizing the number of samples needed to determine cell area coverage reliability in a radiotelephone system

a radiotelephone system and cell area coverage technology, applied in the field of wireless communication, can solve the problems of inherently error-prone hata method for estimating path loss, the accuracy required to estimate the effective cell radius, and the method is much less accurate than

Inactive Publication Date: 2000-03-21
NORTEL NETWORKS LTD
View PDF5 Cites 64 Cited by
  • Summary
  • Abstract
  • Description
  • Claims
  • Application Information

AI Technical Summary

Problems solved by technology

The well known Hata method for estimating path loss is inherently error-prone and is valid over only a very limited range under certain specific conditions.
The limiting factor in determining the quality of RF cellular coverage is the accuracy that is required to estimate the effective cell radius.
This method is shown to be much less accurate than the second approach, producing estimates that are easily biased by the nonuniform sampling commonly found in drive test data.
These two problems cannot be considered independently, and the consequence of doing so can lead to inaccurate estimates of RF performance.
Both of these factors tend to introduce uncorrelated errors since the regression is computed for range measurements across all angles, which greatly reduces most spatial correlation effects.
The cell radius is the limiting factor in determining the reliability of RF coverage.
1. Select an acceptable level of inaccuracy, .DELTA.R, in the cell radius estimate. Typical values are in the range of 5% to 10% (of the cell radius). Choosing values smaller than 5% can lead to drive routes that are unnecessarily long. Choosing values much larger than 10% may lead to unacceptable levels of error in RF coverage.
2. Estimate the minimum distance, D, that must be driven to validate the RF coverage from equation (8). Note that this distance is the same in each cell, regardless of the cell radius.
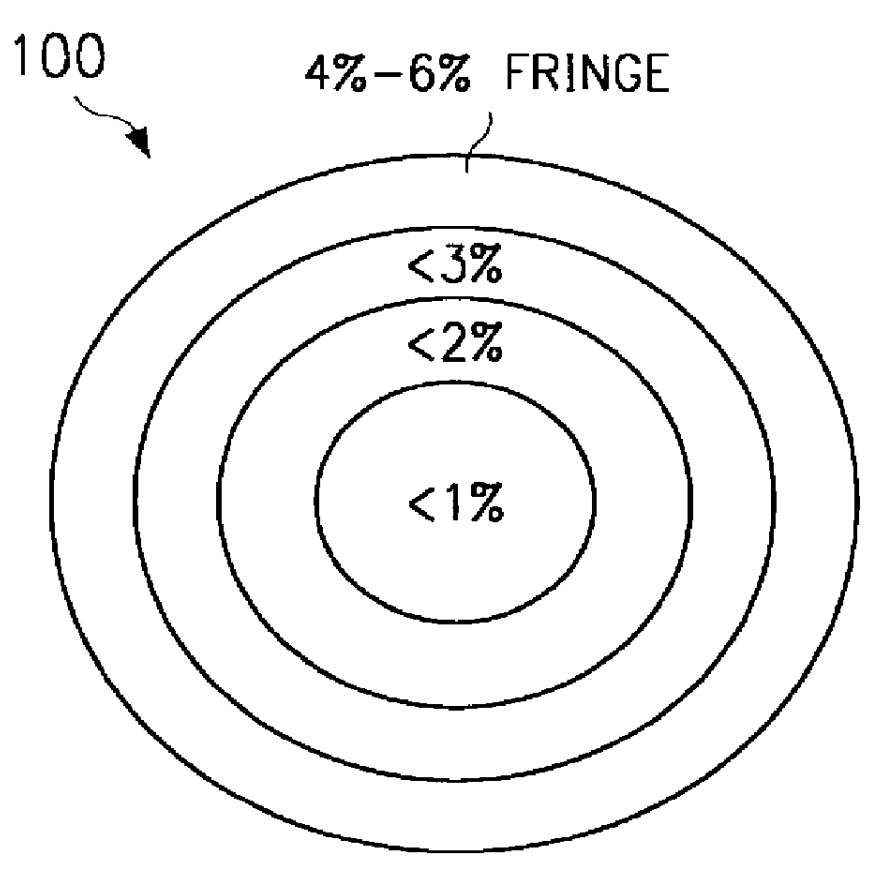
3. Estimate the required "density" of signal strength measurements. A useful metric of sampling density is the minimum percentage of cell area that must be driven, A.sub.min, shown in FIG. 13 and equation (11). Note that A.sub.min is primarily determined by the estimate of cell radius, as well as the desired inaccuracy, .DELTA.R. However, other factors such as the complexity of the propagation environment, projected traffic, etc., can also affect the density of required RF measurements. All of these factors directly influence the orientation of the drive routes by constraining them within areas that must be: (a) heavily drive tested (b) moderately drive tested or (c) lightly drive tested.
4. Select a key number important road segments within the cell whose combined lengths add up to the minimum required drive distance, D, defined in equation (8). If ubiquitous coverage is the objective, the majority of signal strength measurements should be taken in the vicinity of the cell edge (both inside and, if necessary, outside of the cell edge). In benign propagation environments, there is generally not much to be gained by driving in the direct vicinity of the base station (e.g., within 50% of the cell radius) since this area produces few signal strength outages.
For small cells, it is also likely that the length of all of the road segments within the cell will not be sufficient to meet the minimum drive distance requirement, D. For these cases, signal strength samples must be taken outside of the cell boundary.

Method used


Image

  • Method and apparatus for minimizing the number of samples needed to determine cell area coverage reliability in a radiotelephone system
  • Method and apparatus for minimizing the number of samples needed to determine cell area coverage reliability in a radiotelephone system
  • Method and apparatus for minimizing the number of samples needed to determine cell area coverage reliability in a radiotelephone system

Examples


Embodiment Construction

Relationship Between Cell Edge and Cell Area Reliability

Let the received power, P.sub.r, at the edge of a cell, R, be given by

P.sub.r (R)=A'-B log.sub.10 R+X (a1)

where X is a normal zero mean random variable with variance s.sup.2.

Similarly, the received power at a distance, r, is

P.sub.r (r)=A'-B log.sub.10 r+X (a2)

where it will be assumed that r<R. The outage probability, P.sub.out (r), at a particular range, r, from the base station is given by ##EQU16## and the corresponding service reliability is

1-P.sub.out (r)=P(A'-B log.sub.10 r+X>P.sub.THRESH) ##EQU17##

Then from equation (a4), the edge reliability on a contour of range, r, is

1-P.sub.out (r)=Q(a+b ln r) (a5)

The fraction of usable area, F.sub.u, (i.e., area reliability) within the cell can be found by integrating the contour reliability across range ##EQU18##


PUM


Abstract

A robust method for determining the boundaries of cells and the associated reliability of the RF coverage within these boundaries is presented. The invention accurately determines the average range from the base station to the cell edge from RF signal strength measurements with a linear regression approach. The accuracy of this estimate is quantified both as a range uncertainty (e.g. + / -100 meters) and as a cell coverage reliability (i.e. area / edge) through 1) simulation, 2) analysis of real data, and 3) theoretical analysis. It is shown that if the estimate of the cell radius meets the desired accuracy, then the corresponding estimates of coverage reliability (both area and edge) are more than sufficiently accurate. It is recommended that radio survey analyses incorporate this test as part of the coverage validation process.

Description

1. Field of the InventionThe present invention relates generally to wireless communications and in particular to cellular telephony.2. Description of the Related ArtFrequently wireless network designers and equipment suppliers are tasked with providing reliability estimates for coverage of cellular systems. Service providers want to know how reliable their coverage is and want to be able to offer more reliable service to their customers.Two standard ways to express cell reliability are illustrated in FIG. 1. They are contour (or cell edge) reliability as illustrated in FIG. 1a, which gives the reliability of a user who travels the contour of the cell edge; and cell area reliability as illustrated in FIG. 1b, which gives the reliability of a user who may be anywhere within the confines of the entire cell boundary--not just on the cell edge. Both standards are often specified by a user or service provider.The coverage probabilities requested by a user typically range from 70% to 99%. ...

Claims


Application Information

Patent Timeline
Patent Type & Authority Patents(United States)
IPC IPC(8): H04Q7/36H04W16/18
CPCH04W16/18
Inventor BERNARDIN, CHARLES P.YEE, MENG F.
Owner NORTEL NETWORKS LTD
Learn More