Colorectal cancer screening examination and early detection method
a screening examination and early detection technology, applied in the field of colon cancer screening examination and early detection method, can solve the problems of low participation rate in screening programs, few have found their way into clinical validation phase, and less are used as reliable therapeutic targets or diagnostic markers
- Summary
- Abstract
- Description
- Claims
- Application Information
AI Technical Summary
Benefits of technology
Problems solved by technology
Method used
Image
Examples
example 1
istics of Study Population
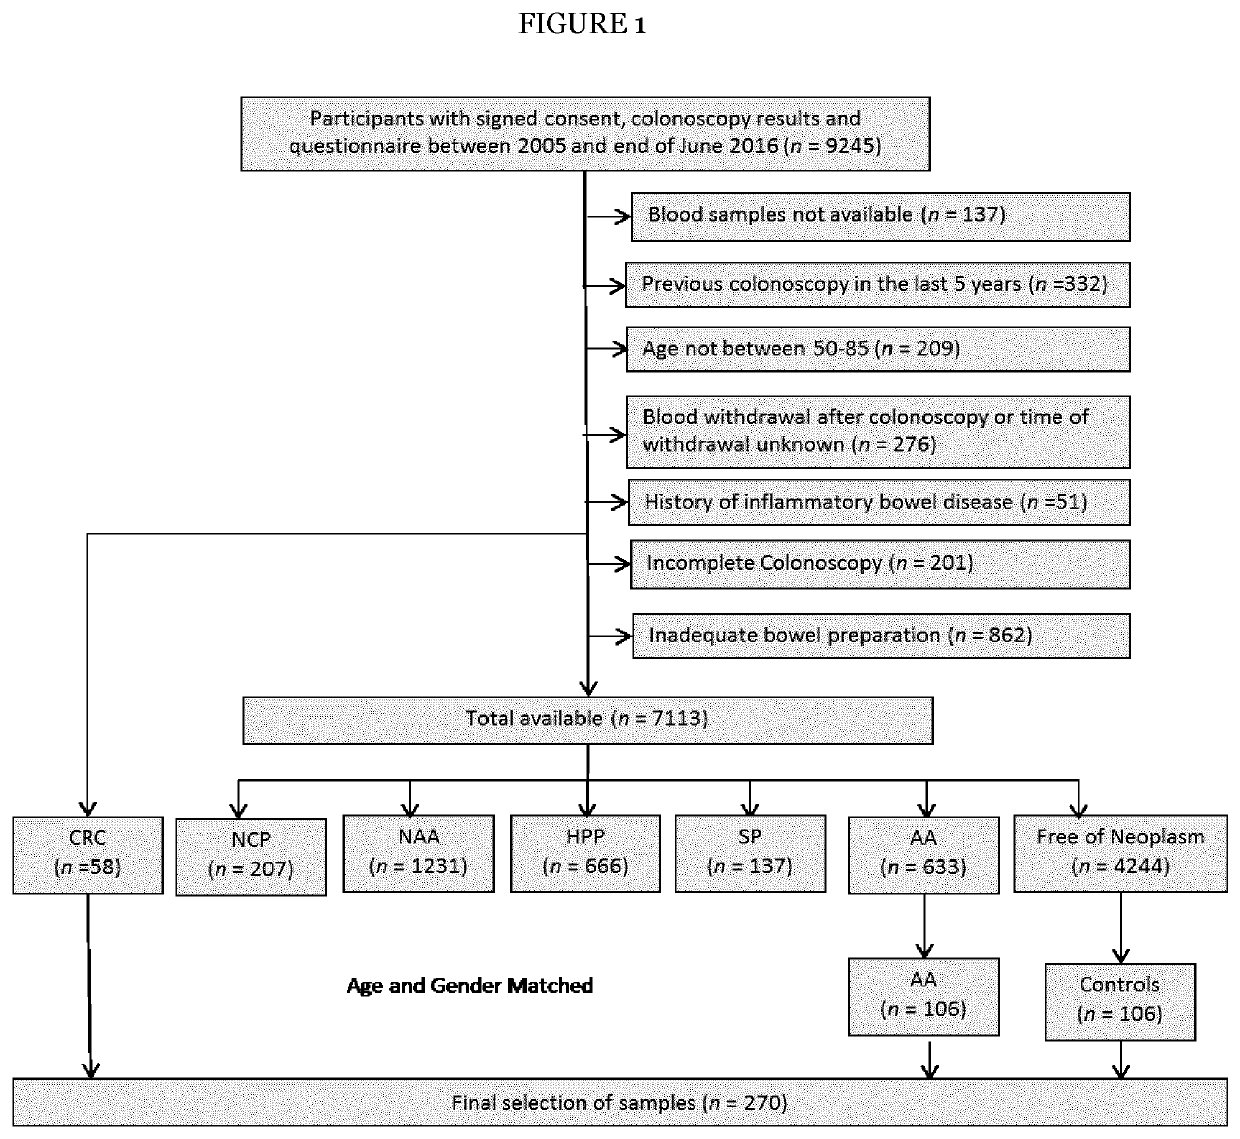
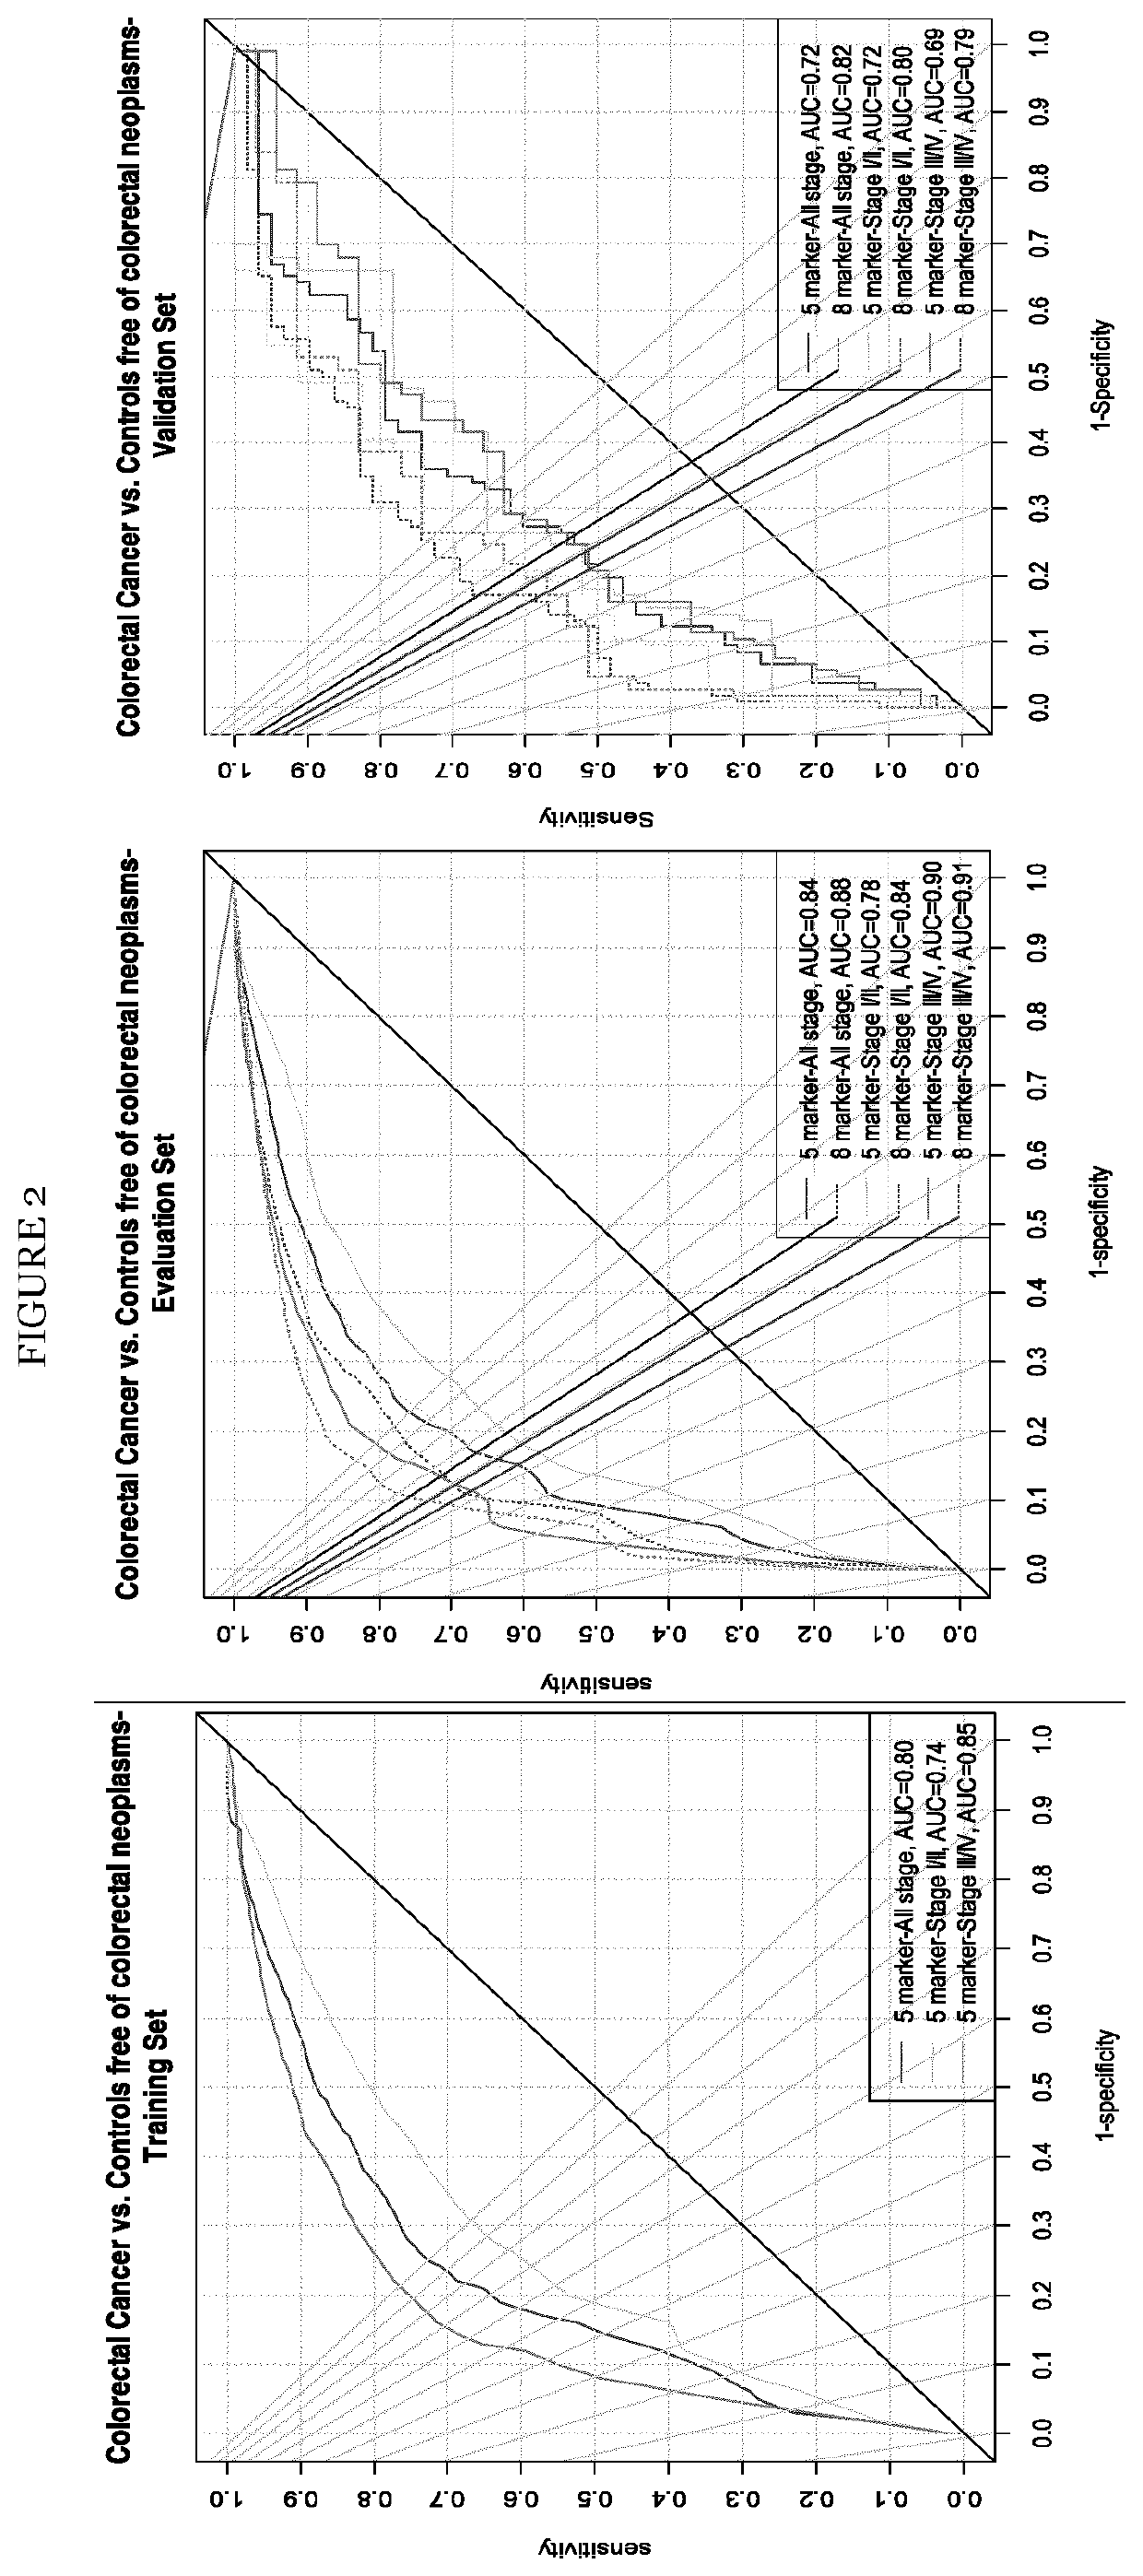
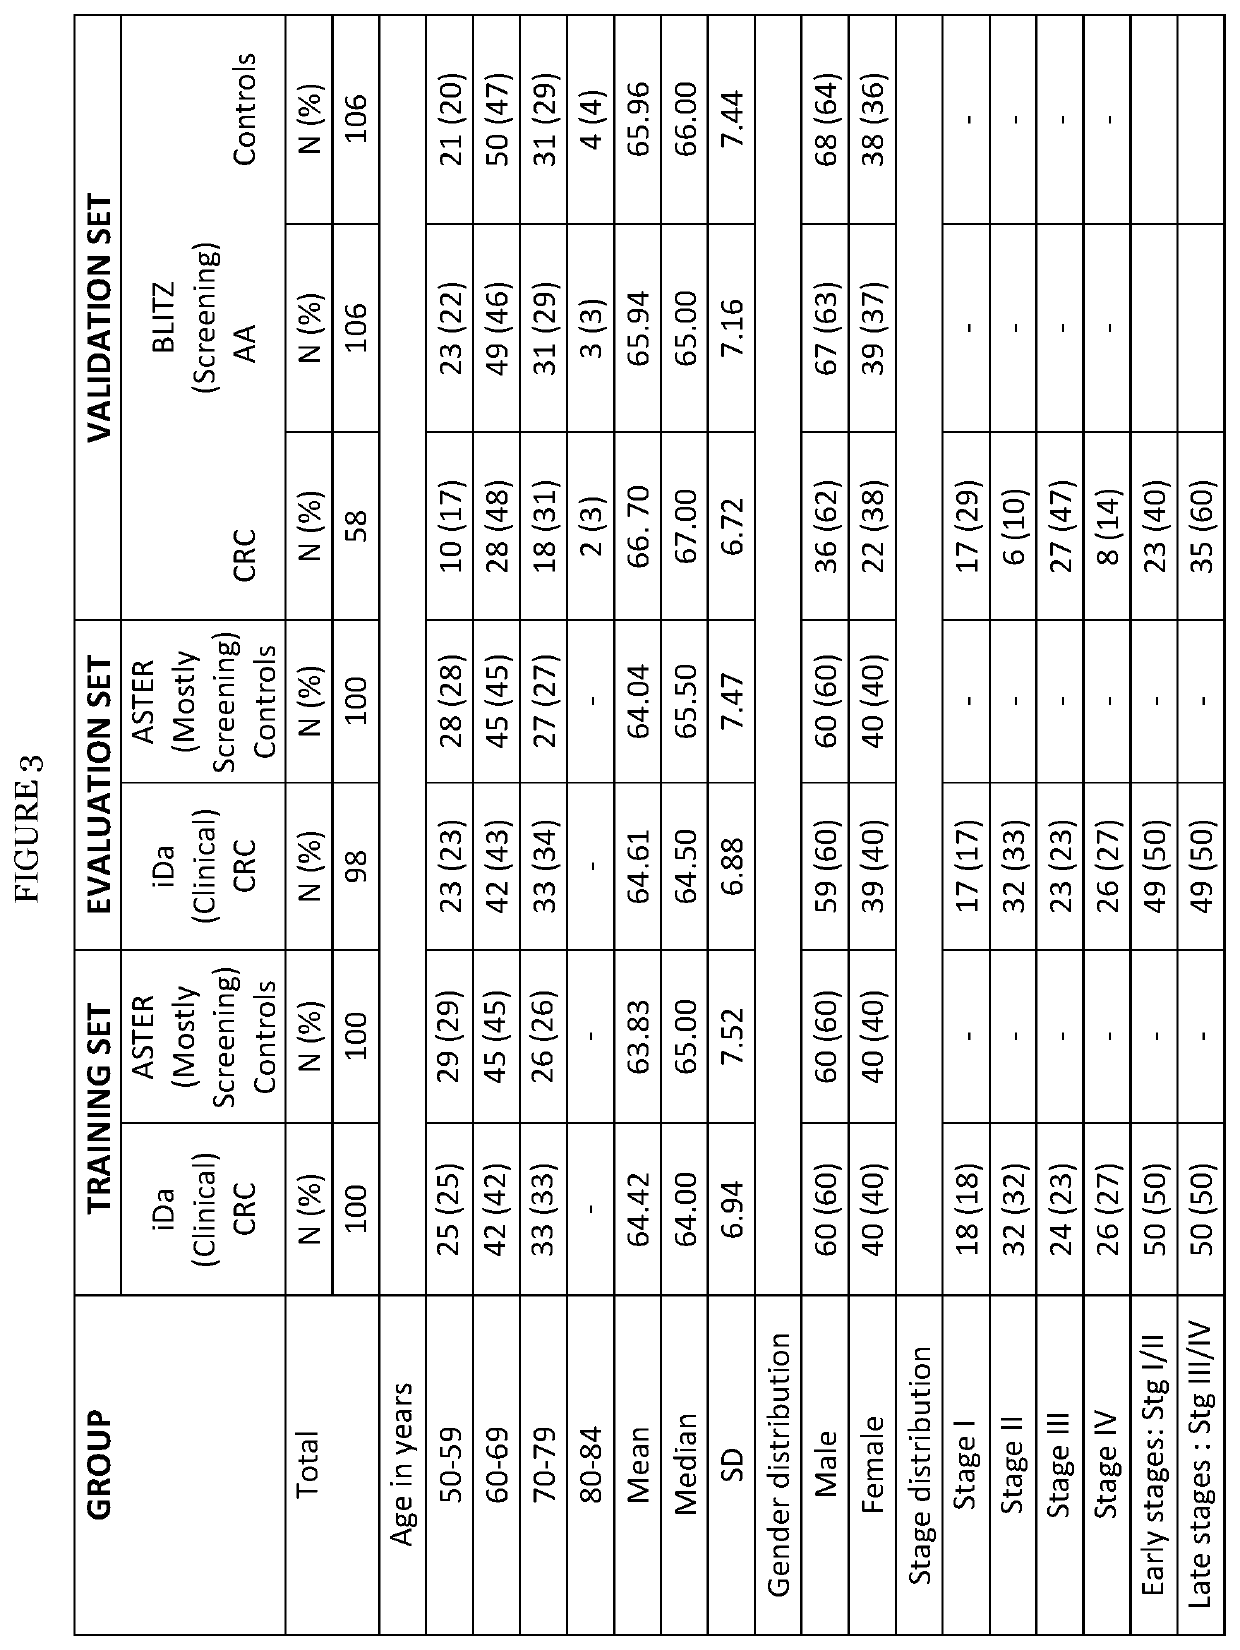
[0085]The STARD diagrams displaying selection of study participants enrolled in iDa, ASTER and BLITZ are provided in FIG. 1, respectively. The discovery set A used for LC-MRM / MS consisted of 100 clinically recruited CRC cases and 100 controls free of neoplasms and for discovery set B using PEA of 98 CRC cases and wo controls free of neoplasms, from iDa and ASTER studies, respectively. The three stage specific prediction algorithms were then externally evaluated and validated in a validation set comprising CRC cases and sex and age matched controls without colorectal neoplasms selected from participants of screening colonoscopy. Because the sex and age distribution of participants with AA or those of controls free of neoplasm actually differs from the corresponding distributions among CRC cases in true screening practice, observations from participants with AA and controls without neoplasms were weighted in the analysis in such a way that their sex and age d...
example 2
l Markers
[0086]The diagnostic performances of all the above mentioned protein markers across the three different sets are listed in Table 2 in FIG. 4. After adjustment for multiple corrections, the number of proteins with significant differences between CRC and controls were (N=6, 7 and 1) in discovery sets A and B and validation set, respectively. The AUCs ≥0.60 were observed for (N=6, 7 and 3) and sensitivities >25% at 90% specificity for (N=6, 7 and 3) protein biomarkers in discovery sets A and B and validation set, respectively. Of the eleven protein biomarkers commonly quantified by both platforms the best individual diagnostic performance was observed for PON3 in discovery set A with an AUCBS of 0.72 (95% CI, 0.63-0.81), in discovery set B with an AUCBS of 0.74 (95% CI, 0.65-0.84) and in validation set for TR with an AUCBS of 0.72 (95% CI, 0.64-0.85). As seen from Table 2 in FIG. 4 the diagnostic performance of nine out of eleven markers was similar in both discovery sets A an...
example 3
on Analysis
[0087]The results of the Pearson's product-moment correlation analysis for protein biomarkers measured across the same sample from discovery sets A and B consisting of 190 participants (CRC=96 and controls=94) revealed that the correlation coefficient was highest for PON3 (0.79) and was 0.6 for eight out of eleven biomarkers. The good concordance observed for protein biomarkers not only confirms the diagnostic potential of these markers, but also indicates the robustness of the findings.
PUM
 Abstract
Description
Claims
Application Information
 - R&D
- Intellectual Property
- Life Sciences
- Materials
- Tech Scout
- Unparalleled Data Quality
- Higher Quality Content
- 60% Fewer Hallucinations
Browse by: Latest US Patents, China's latest patents, Technical Efficacy Thesaurus, Application Domain, Technology Topic, Popular Technical Reports.
© 2025 PatSnap. All rights reserved.Legal|Privacy policy|Modern Slavery Act Transparency Statement|Sitemap|About US| Contact US: help@patsnap.com


