
Brain functional connectivity correlation value adjustment method, brain functional connectivity correlation value adjustment system, brain activity classifier harmonization method, brain activity classifier harmonization system, and brain activity biomarker system

a brain functional connectivity and value adjustment technology, applied in image enhancement, instruments, recognition of medical/anatomical patterns, etc., can solve the problems of site-to-site differences of measurement data at each measuring site, difficult to collect massive brain image data from healthy people, and difficult to achieve objective determination of healthy peopl

Pending Publication Date: 2021-12-30
ATR ADVANCED TELECOMM RES INST INT
View PDF0 Cites 6 Cited by
  • Summary
  • Abstract
  • Description
  • Claims
  • Application Information

AI Technical Summary

Benefits of technology

The present invention allows for adjusting and correcting brain activity measurement data at different facilities, leading to the harmonization of brain activity classifiers and the ability to determine healthy or diseased states based on objective data. The result is a brain activity biomarker system and program that can aid in the diagnosis and treatment of neurological and mental diseases.

Problems solved by technology

It is noted, however, that it is difficult to collect massive brain image data from healthy people and significantly more difficult from patients.
Further, when measurements are done at a plurality of sites in order to massively collect data, the site-to-site differences of measurement data at each measuring site will be a problem.

Method used


Image

  • Brain functional connectivity correlation value adjustment method, brain functional connectivity correlation value adjustment system, brain activity classifier harmonization method, brain activity classifier harmonization system, and brain activity biomarker system
  • Brain functional connectivity correlation value adjustment method, brain functional connectivity correlation value adjustment system, brain activity classifier harmonization method, brain activity classifier harmonization system, and brain activity biomarker system
  • Brain functional connectivity correlation value adjustment method, brain functional connectivity correlation value adjustment system, brain activity classifier harmonization method, brain activity classifier harmonization system, and brain activity biomarker system

Examples


first embodiment

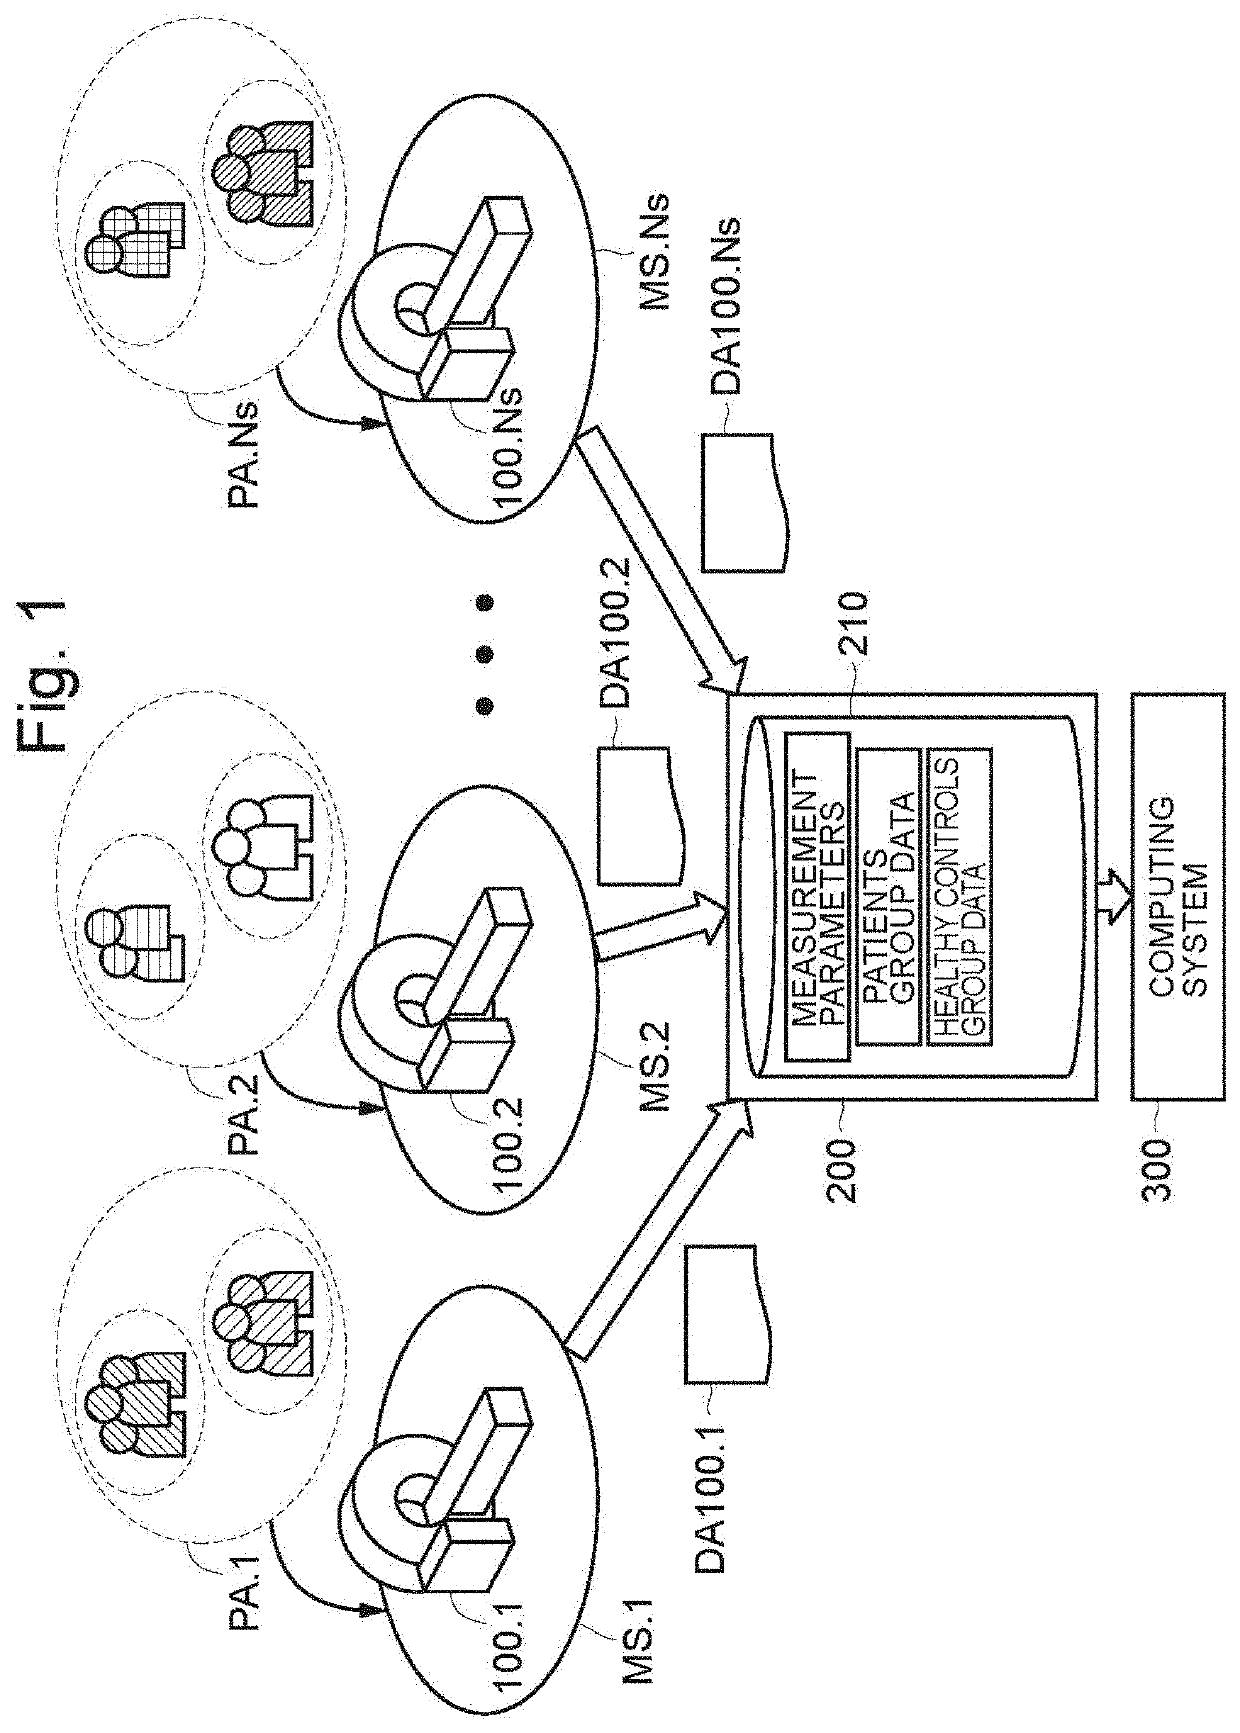
[0115]FIG. 1 is a schematic diagram illustrating a harmonization process on data measured by the MRI measurement systems installed at a plurality of measurement sites.

[0116]Referring to FIG. 1, it is assumed that MRI devices 100.1 to 100.Ns are installed at measurement sites MS.1 to MS.Ns (Ns: number of sites), respectively. At measurement sites MS.1 to MS.Ns, measurements of subject cohorts PA.1 to PA.Ns are taken. Each of the subject cohorts PA.1 to PA.Ns includes at least two cohorts to be classified, for example, a patient cohort and a healthy cohort. Though not limiting, a patient cohort includes patients of mental diseased and, more specifically, a cohort of “patients of major depressive disorder.”

[0117]Further, it is assumed that at each measurement site, in principle, measurements of subjects are taken through measurement protocols as standardized as possible considering different specifications of MRI devices.

[0118]Though not specifically limited here, the measurement proto...

second embodiment

[0457]In the configuration described in the first embodiment, the brain activity measuring devices (fMRI devices) measure data of brain activities obtained at a plurality of measuring sites, and based on the brain activity data, generation of biomarkers and estimation (prediction) of diagnosis labels by the biomarkers are realized by distributed processing.

[0458]It is noted, however, that the following process steps may be executed in a distributed manner at different sites:

[0459]i) the measurement of brain activity data for training a biomarker through machine learning (data collection);

[0460]ii) the process of generating a biomarker through machine learning and the process of estimating (predicting) diagnosis labels by the biomarker for a specific subject (estimation process); and

[0461]iii) the measurement of brain activity data of the specific subject above (measurement of subject's brain activities).

[0462]FIG. 28 is a functional block diagram showing an example when the data col...

third embodiment

[0485]In the foregoing description, it is assumed that the traveling subjects travel to every measurement site and have measurements equally, and thereby measurement biases are evaluated.

[0486]FIG. 29 shows a circuiting scheme of the traveling subjects in accordance with a third embodiment. In the third embodiment, as shown in FIG. 29, it is assumed that the traveling subject TS1 makes the rounds of the “hub measurement sites MS.1 to MS.Ns” as hubs.

[0487]Among these hub measurement sites MS.1 to MS.Ns, assume that there are subordinate sites MS2.1 to MS2.n under the hub measurement site MS.2. If a new measurement site “MS.2.n+1” is added to the sites under hub measurement site MS.2, a traveling subject TS2 makes the rounds of the sites under the hub measurement site MS.2. The same applies to other hub measurement sites.

[0488]Specifically, a configuration is also possible wherein the measurement biases of hub measurement site MS.2 are fixed to the values evaluated concerning the trav...


PUM


Abstract

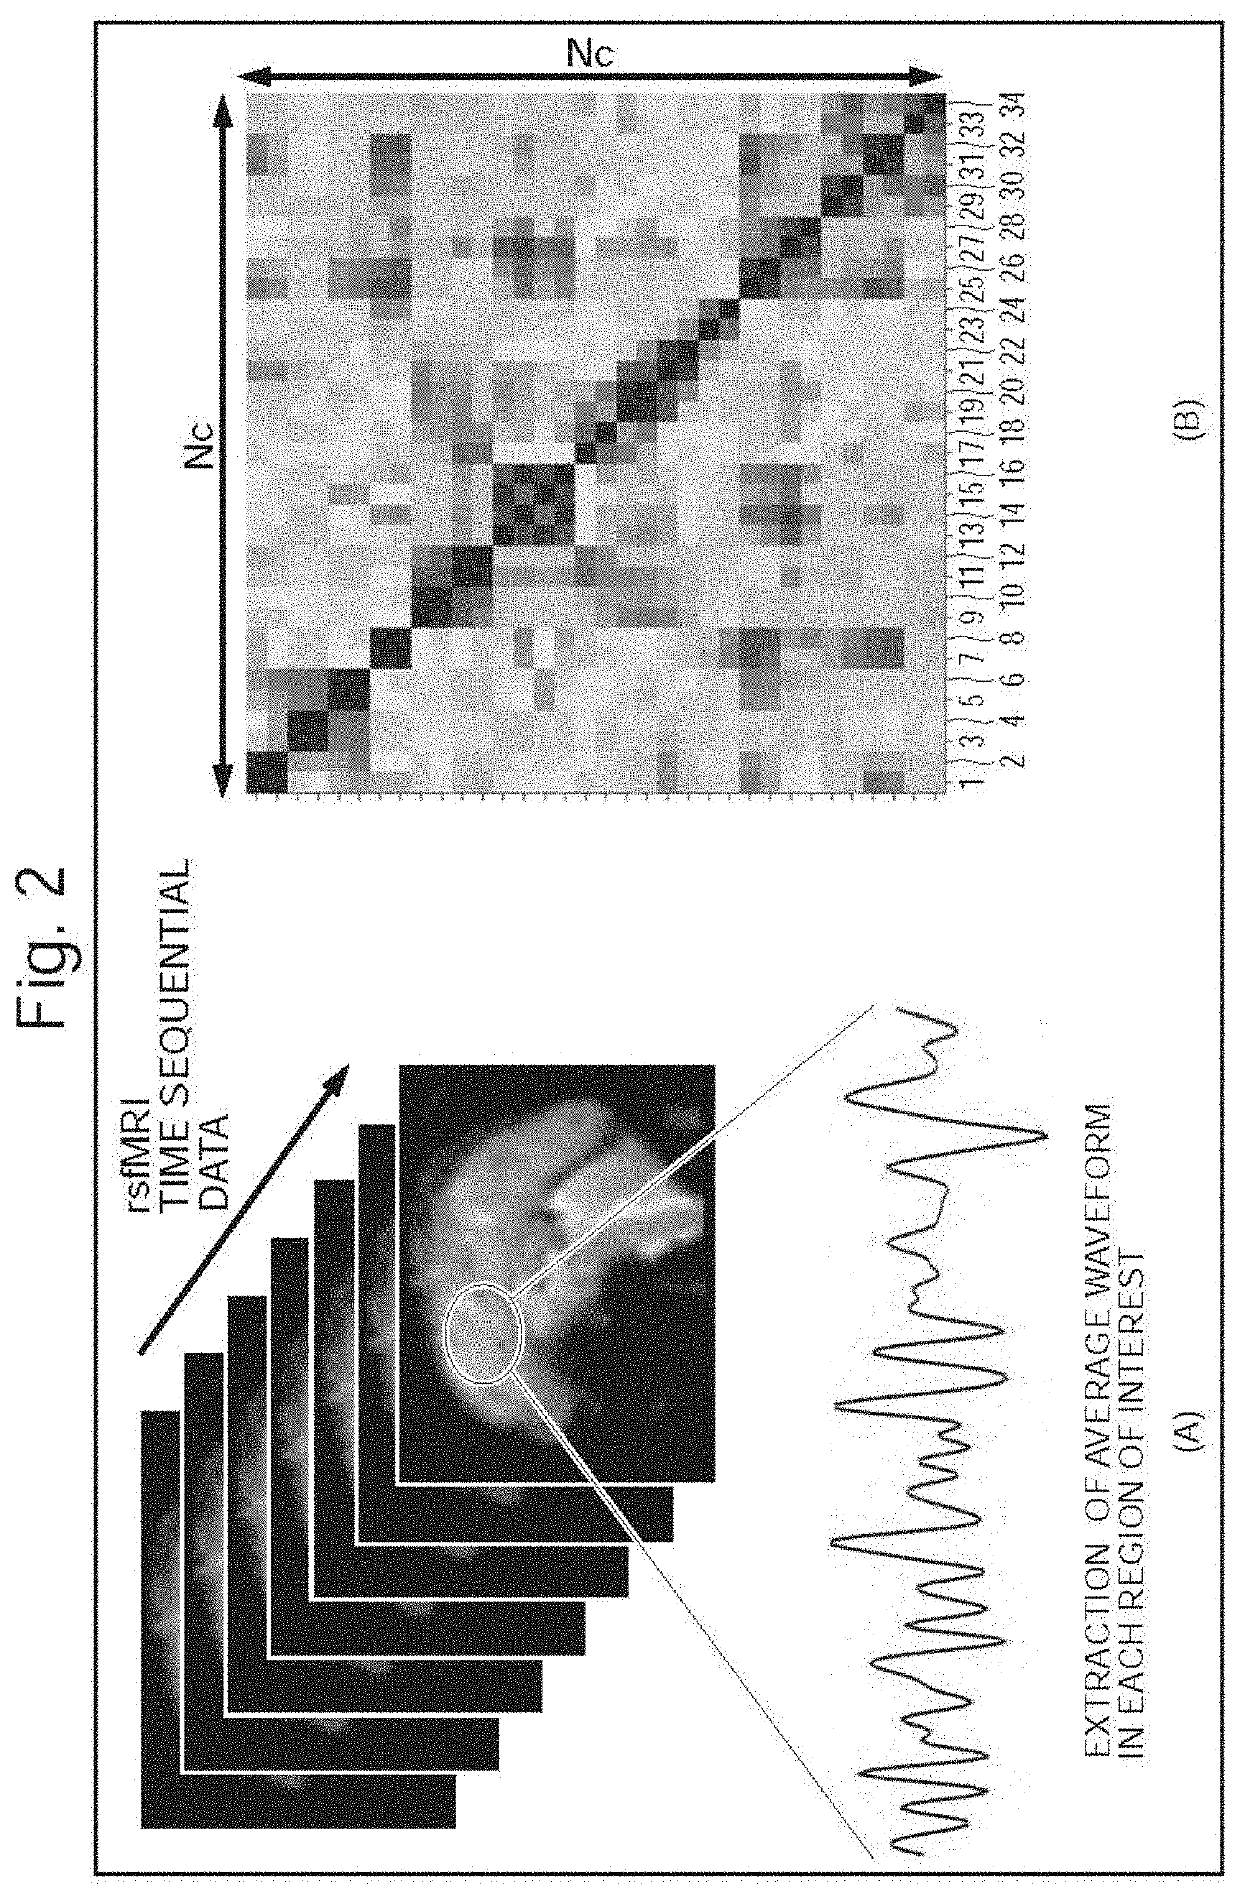
A harmonization system for a brain activity classifier harmonizing brain measurement data obtained at a plurality of sites to realize a discrimination process based on brain functional imaging: obtains data, for a plurality of traveling subjects as common objects of measurements at each of the plurality of measurement sites, resulting from measurements of brain activities of a predetermined plurality of brain regions of each of the traveling subjects; calculates, for each of the traveling subjects, prescribed elements of a brain functional connectivity matrix representing the temporal correlation of brain activities of a set of the plurality of brain regions; using a generalized linear mixed model, calculates measurement bias data 3108 for each element of the brain functional connectivity matrix, as a fixed effect at each measurement site with respect to an average of the corresponding element across the plurality of measurement sites and across the plurality of traveling subjects; and thereby executes a harmonizing process.

Description

TECHNICAL FIELD[0001]The present invention relates to a technique of adjusting brain functional connectivity correlation values measured by brain function imaging by a plurality of devices, a method of harmonizing brain activity classifiers using brain function imaging, a system for harmonizing brain activity classifiers and brain activity biomarker system. The present application claims the convention priority on Japanese Patent Application No. 2018-192842 filed on Oct. 11, 2018 and Japanese Patent Application No. 2019-034887 filed on Feb. 27, 2019, and herein incorporates the entire descriptions of these Japanese patent applications.BACKGROUND ART[0002](Biomarker)[0003]When biological information is converted into a numerical value or quantified as an index for quantitatively comprehending any biological changes in a living body, it is called a “biomarker.”[0004]The FDA (the United States Food and Drug Administration) defines a biomarker as “a characteristic that is objectively me...

Claims


Application Information

Patent Timeline
IPC IPC(8): A61B5/00A61B5/055G06T7/00
CPCA61B5/0042A61B5/055A61B5/7264G06T2207/30016A61B2576/026G06T2207/10088G06T7/0016G06V2201/03A61B5/165A61B5/7267A61B5/14542G06V10/762G06F18/2136G06F18/23
Inventor YAMASHITA, AYUMUYAMASHITA, OKITOIMAMIZU, HIROSHIKAWATO, MITSUO
Owner ATR ADVANCED TELECOMM RES INST INT
Learn More