Methods of disease detection and characterization using computational analysis of urine raman spectra

a technology of urine raman and computational analysis, applied in the field of disease detection and characterization, can solve the problems of inflammatory response to tumor tissue, dead/dying renal tissue, and compromising the integrity of the renal circulation,

Pending Publication Date: 2021-07-15
VIRGINIA TECH INTPROP INC
View PDF0 Cites 11 Cited by
  • Summary
  • Abstract
  • Description
  • Claims
  • Application Information

AI Technical Summary

Benefits of technology

[0007]Differentiating diseases is possible by examining all or some of the following factors: 1) type and amount of protein in the urine, 2) the decrement in GFR, 3) the presence of absence of blood (heme) and inflammatory cells/debris, 4) unique molecular signatures regions indicative of urea, creatinine, peptidoglycan, phosphatidylinositol, fatty acids and lipids, phosopholipids, cholesterol, glycogen, carotenoids, collagen, carbohydrates, nitrates and phosphates, uremic toxins (guanidine and indoxyl sulfate), and nucleic acids (DNA and RNA), 5) changes in metabolism indicated by protein metabolism and breakdown products (including the amount and types of amino acids), 6) spectral signature Raman bands that differ from those in urine of healthy individuals, and/or 7) the actual number of Principal Components needed to differentiate disease groups. Such disease-associated abnormalities are detectable in urine and can be associated with one or more diseases. An outline of the disease-associated factors that are applicable to various diseases is provided in Table 1.
[0008]Methods of the invention include obtaining from urine a Raman “spectral fingerprint” of a particular disease, individual, or response to therapy and comparing that to the Raman “spectral fingerprint” of urine from healthy persons and those with specific diseases to identify/characterize disease. Embodiments of the invention include classifying a sample or specimen, such as from a subject, according to whether the subject has a particular state, condition and/or disease (which terms may be used interchangeably throughout this specification and claims), wherein the classifying can include whether the sample, specimen

Problems solved by technology

Here are three examples: 1) the presence of infection in the urinary tract will change the pH, viscosity, concentration, and molecular composition of urine; 2) the presence and growth of neoplasms in the kid

Method used


Image

  • Methods of disease detection and characterization using computational analysis of urine raman spectra
  • Methods of disease detection and characterization using computational analysis of urine raman spectra
  • Methods of disease detection and characterization using computational analysis of urine raman spectra

Examples


Embodiment Construction

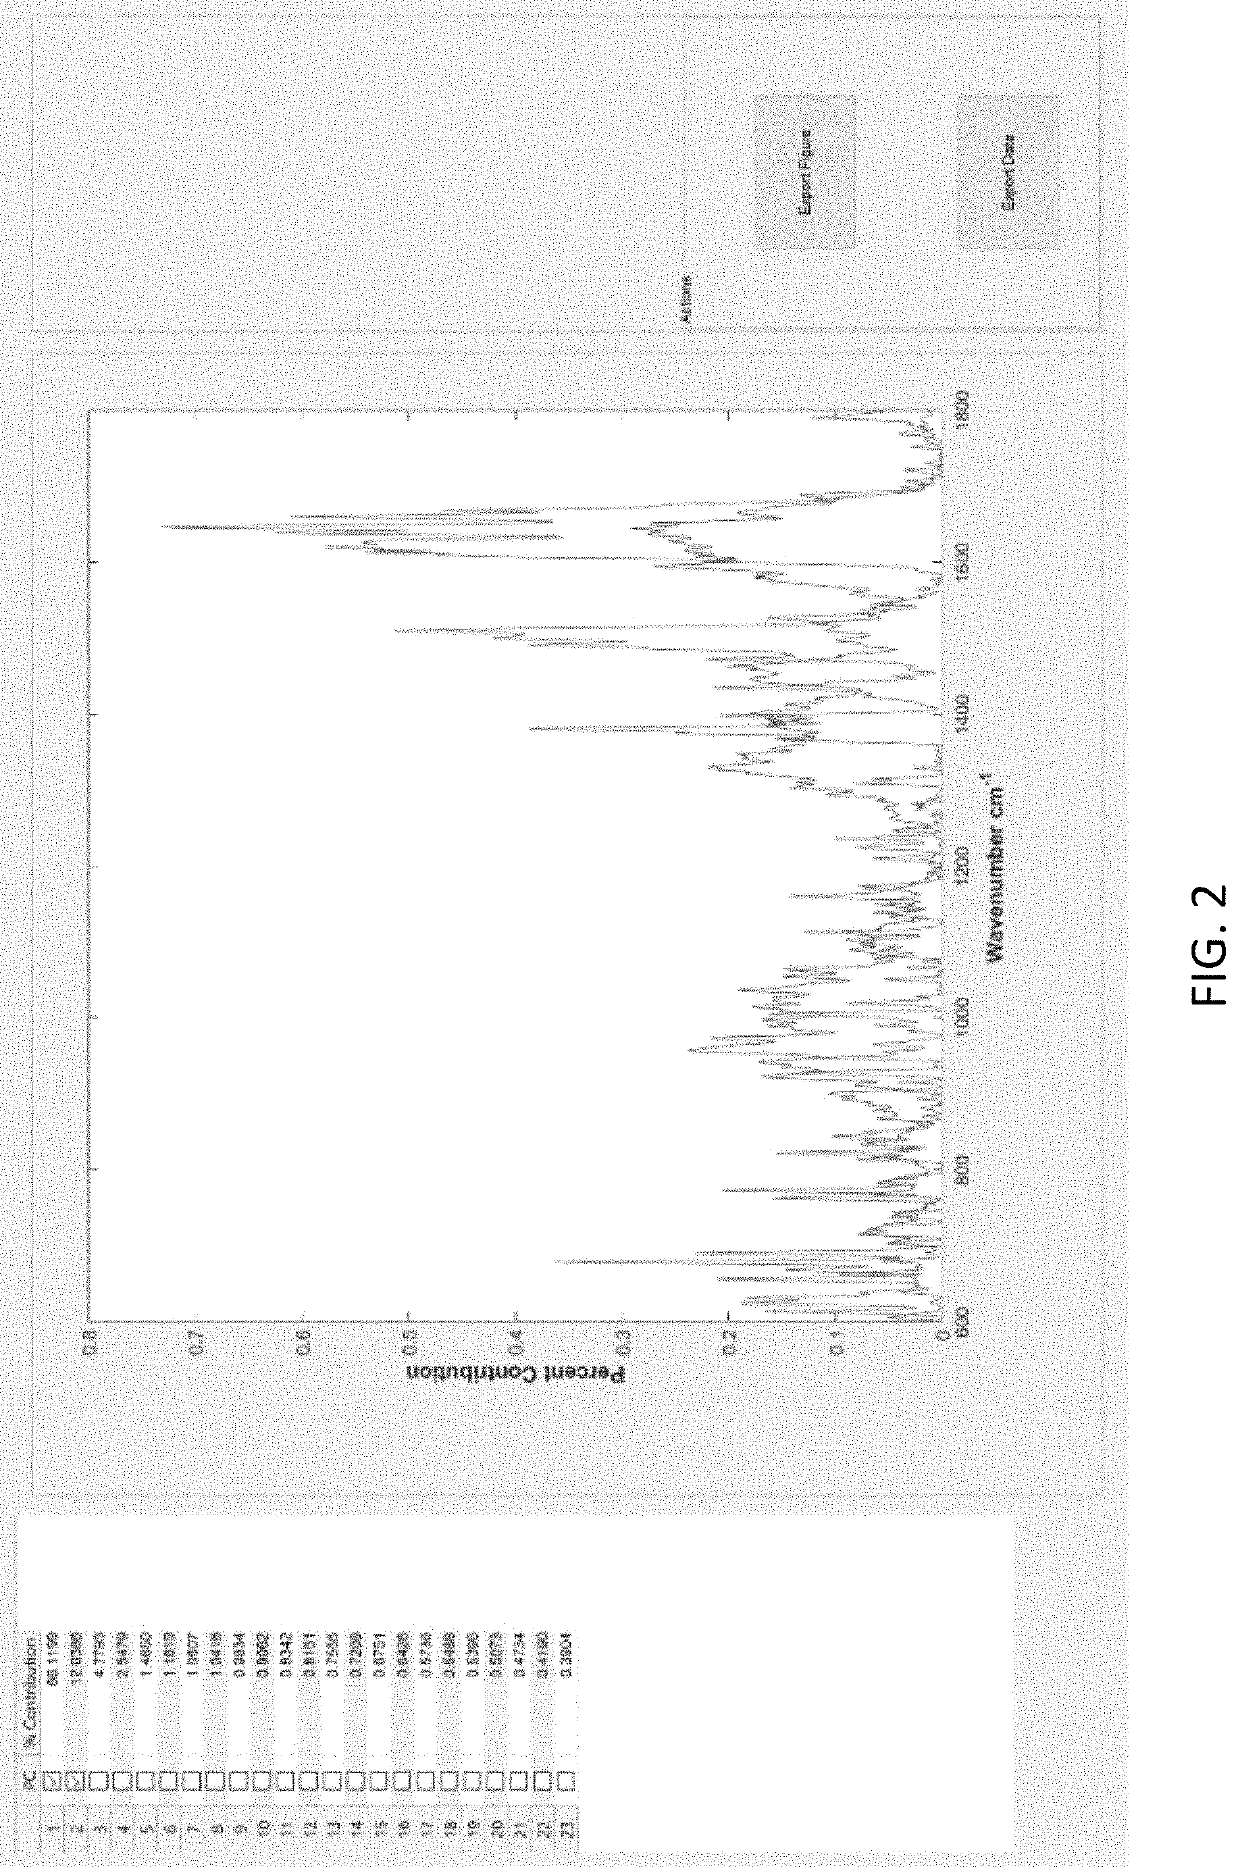
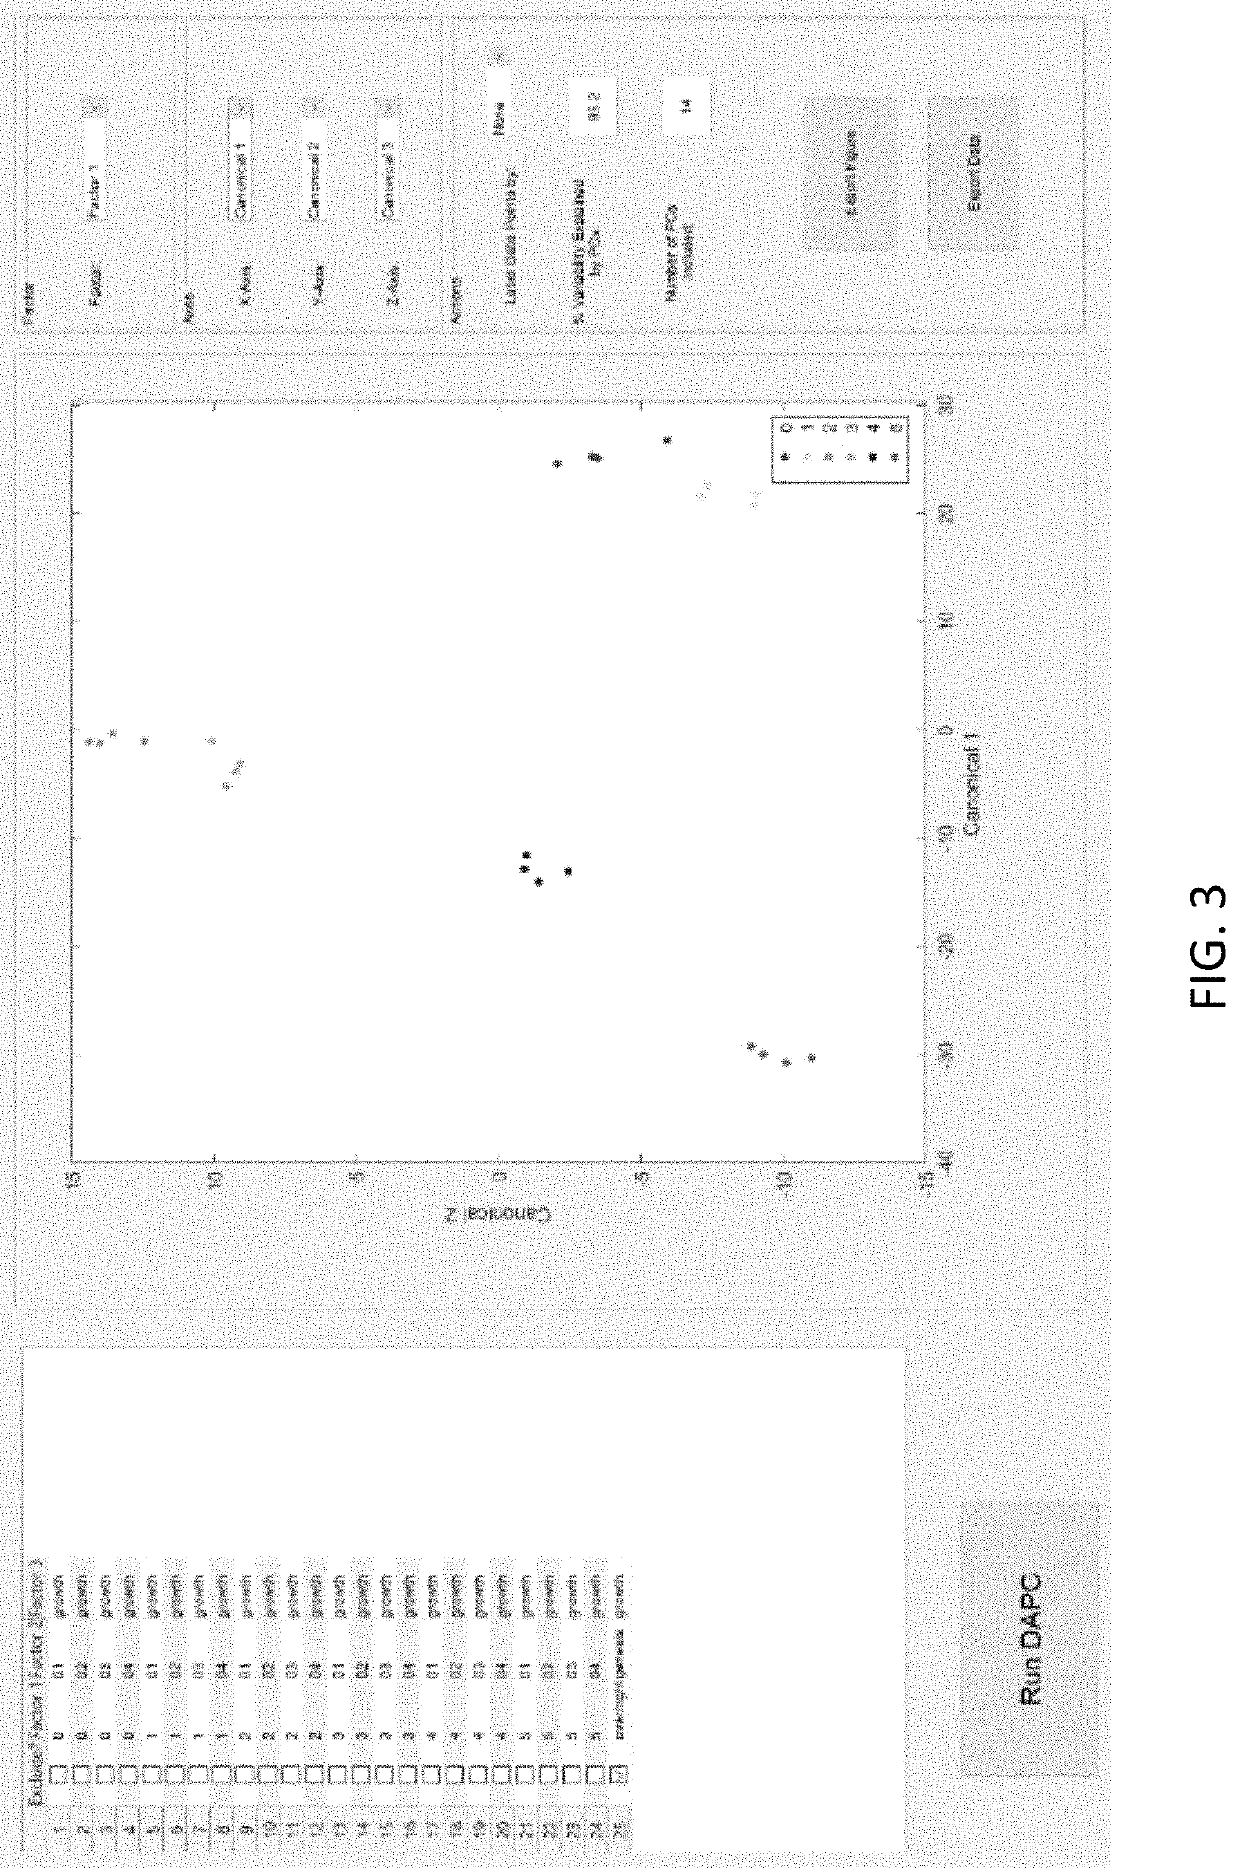
[0052]Embodiments of the invention provide various disease detection and characterization methods using computational analysis of Raman spectra. These methods are used to detect disease-specific multi-molecular patterns associated with specific diseases. The multi-molecular patterns result in a Raman “spectral fingerprint,” that can be compared with that of urine from healthy persons or those with specific diseases. Specific methods include: a) optionally truncating spectra to a desired wavenumber range; 2) applying baseline correction e.g., with the Goldindec algorithm, or with ISREA and StaBAL; 3) vector or specific band normalization; 4) principal component analysis (PCA); 5) discriminant analysis of principal components (DAPC); 6) identification of wavenumber loadings for PCA and DAPC; 7) calculation of total canonical distance (TCD); and 8) performing leave-one-out analysis of chemometric DAPC models to report predictive capabilities in terms of accuracy, sensitivity (true-posi...


PUM


Abstract

Disease detection and characterization using computational analysis of Raman spectra is used to detect disease-specific multi-molecular patterns “spectral fingerprint” associated with specific diseases, cellular physiologic derangements, or altered metabolism from systemic reactions to disease. Comparison of the Raman spectral fingerprint of urine from subjects with specific diseases and those not (healthy persons) provides the means to identify key disease-associated changes in urine molecular composition. Methods include applying baseline correction to spectra of a desired wavenumber range e.g., with the Goldindec algorithm, or with ISREA and StaBAL; vector or specific band normalization; and one or more of principal component analysis (PCA); discriminant analysis of principal components (DAPC); principal least squares (PLS) regression, machine learning with neural networks (NN); identification of wavenumber loadings; calculation of total canonical distance (TCD); total spectral distance (TSD), total principal component distance (TPD); ANOVA; pairwise comparisons; and performing leave-one-out or multi-fold cross-validation analysis of chemometric models (DAPC, PLS, NN) to report predictive capabilities in terms of accuracy, sensitivity (true-positives), and specificity (true-negatives), positive predictive value (PPV) and negative predictive value (NPV).

Description

CROSS-REFERENCE TO RELATED APPLICATIONS[0001]This application relies on the disclosure of and claims priority to and the benefit of the filing date of U.S. Provisional Application Nos. 62 / 958,983 and 62 / 958,993, filed Jan. 9, 2020, 62 / 993,908, filed Mar. 24, 2020, and 62 / 983,045, filed Feb. 28, 2020, each of which is hereby incorporated by reference herein in its entirety.BACKGROUND OF THE INVENTIONField of the Invention[0002]The present invention relates to the field of disease detection and characterization. More particularly, the present invention relates to methods of detecting or characterizing disease using computational analysis of urine Raman spectra.SUMMARY OF THE INVENTION[0003]All diseases alter normal physiology and homeostasis. These alterations can occur at the molecular, subcellular, cellular, tissue, organ, organ system and organism levels, frequently manifesting in alterations in multiple locations (molecular->organism). Common alterations include changes in meta...

Claims


Application Information

Patent Timeline
IPC IPC(8): G01N21/65G16B40/30G16H10/40G01N33/493
CPCG01N21/65G16B40/30G01N2201/129G01N33/493G16H10/40G16H50/20G16B20/00Y02A90/10
Inventor ROBERTSON, JOHN L.SENGER, RYAN
Owner VIRGINIA TECH INTPROP INC
Why Eureka
Try Eureka