
Fabry Perot Interferometry for Measuring Cell Viability

a technology of interferometry and perots, which is applied in the field of fabry perot interferometry for measuring cell viability, can solve the problems of affecting the accuracy of cell viability measurement, and requiring expensive consumables and/or a long time to complete. achieve the effect of more accurate aggregate measuremen

Pending Publication Date: 2021-05-13
NIRRIN BIOPROCESS ANALYTICS INC
View PDF2 Cites 2 Cited by
  • Summary
  • Abstract
  • Description
  • Claims
  • Application Information

AI Technical Summary

Benefits of technology

The patent is about a new technique for measuring the viability of cells in a bioreactor in real-time without exposing them to external conditions. This can be useful in optimizing cell growth, supporting product purification, and other stages in the manufacture of proteins or other areas. The technique can provide valuable information about cell structures and protein aggregation and can be done online during a flow process. It can also monitor multiple constituents present in the cell culture or other production processes. Overall, the patent describes a non-destructive, real-time approach for measuring cell viability in a bioreactor.

Problems solved by technology

Typical approaches can be destructive as they rely on removing and analyzing samples off-line.
This may be particularly problematic when measuring cell densities.
In addition, protocols followed in analyzing cell cultures often require expensive consumables and / or a long time to complete.
In many cases, the equipment needed to perform these analyses is expensive, involving calibrations, and trained operators.
Procedures may be time- and labor-intensive, problems that are often mitigated by decreasing the sampling frequency of a given process, thus reducing the data points.
Drawbacks such as these can persist even with automated sampling operations.

Method used


Image

  • Fabry Perot Interferometry for Measuring Cell Viability
  • Fabry Perot Interferometry for Measuring Cell Viability
  • Fabry Perot Interferometry for Measuring Cell Viability

Examples


example 1

[0158]This feasibility experiment for detecting IgM in an IgG solution employed a “slow” scanning technique, over time intervals of at least one minute, typically over a time interval of a few, e.g., 3, 4, 5, 6, 7, 8, 9 or 2, 10 minutes. The protocol included preparing an aqueous solution of 1 milligram per milliliter (mg / mL) IgG in phosphate buffered saline (PBS), the IgG acting as purified monomer, followed by adding 1% of the heavier protein IgM (v / v also in PBS). The solution was recirculated through a flow cell and closed loop system, such as, for example a Hellma 1 mm pathlength flow cell (Hellma article #170-000-1-40) with a peristaltic pump (Cole-Palmer Masterflex®).

[0159]The number of detected events divided by the number of scans was expected to converge on the correct percentage of aggregates. Standard deviation (STD) was employed to tune event detection. STD×2.75 was determined as threshold for event detection (tuning) and was obtained empirically from 1% spiking runs. T...

example 2

[0162]As in the protocol described above, this feasibility study for detecting IgA in an aqueous IgG solution in PBS employed a solution containing 1 mg / mL of IgG, with IgG acting as a purified monomer. 1% of IgA (simulating a dimer) was added and the resulting solution was recirculated through a flow cell and closed loop system, as in Example 1. Once properly mixed, the number of detected events, divided by the total scans converged on the correct percentage of aggregates.

[0163]To investigate the robustness of the approach, the standard deviation employed was that determined in Example 1. The cumulative % aggregation as a function of time (in a “slow” scanning mode of several minutes) for the 1% IgA in a solution of 1 mg / mL IgG is presented in FIG. 21.

example 3

[0164]An aqueous solution of IgG (1 mg / mL) containing 1% IgA in PBS, prepared as described in Example 2, was used to investigate the feasibility of real time detection, measuring % aggregation over a time scale of a few seconds (e.g., 10 seconds). The known flowrates employed ranged between 1 and 5 mL / minute; the scan volume was 1 microliter; the scan rate was 1 scan per 0.1 seconds. As seen in FIG. 22, the plots for real-time aggregate % for the various flow rates asymptotically approached the known concentration of 1% IgA.


PUM


Abstract

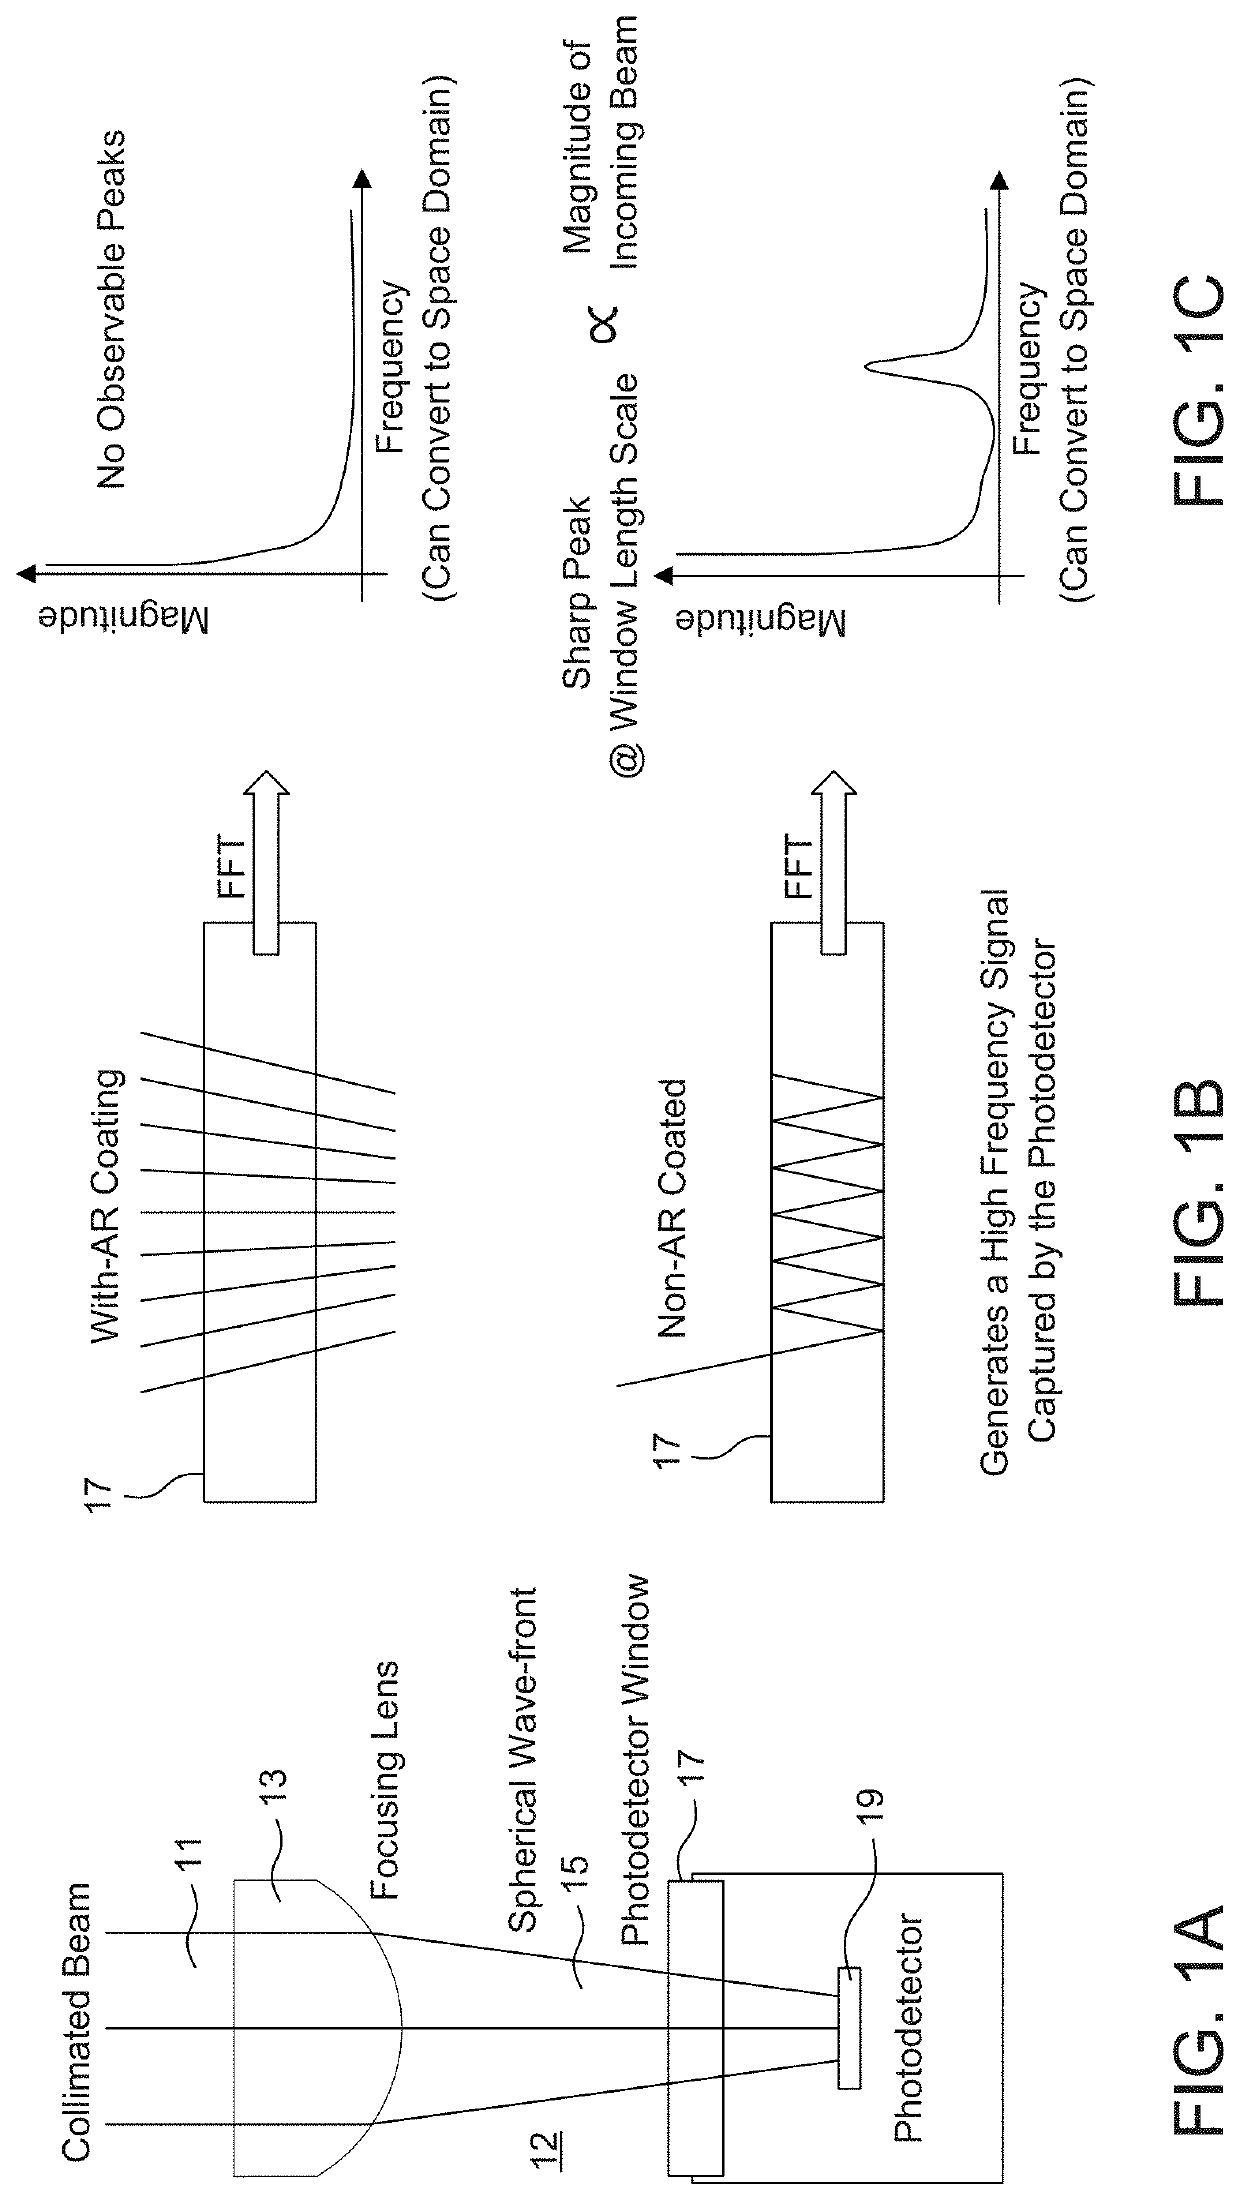
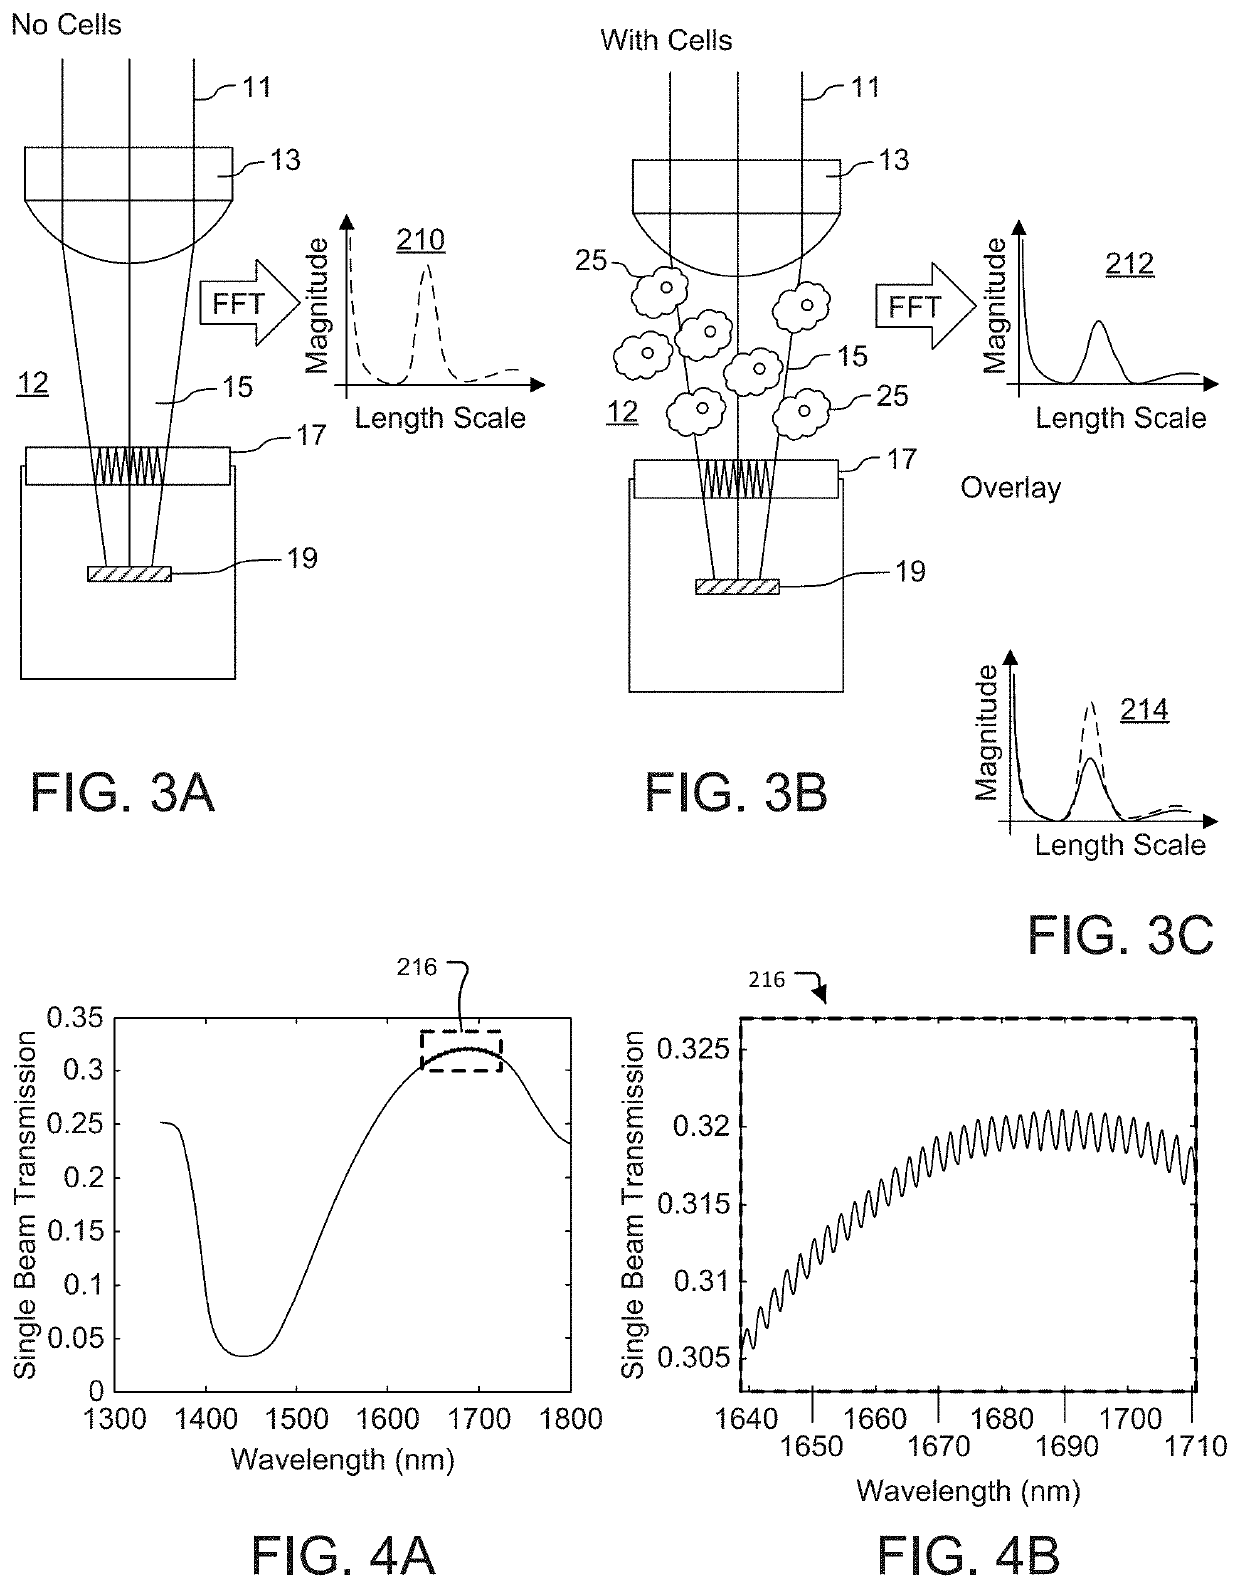
A method for studying cell viability and protein aggregation involves establishing a Fabry Perot etalon signal within an optical spectroscopic feature, e.g., in the near infrared region. Protein aggregation and cell viability can be reflected by changes observed in the magnitude of the Fourier Transform peaks observed in the frequency or space domain associated with the contrast of the etalon. In short, the presence of viable cells and protein aggregates can degrade the etalon contrast of an etalon window. In some cases, the concentration of cells and monomeric protein can be measured as well.

Description

RELATED APPLICATIONS[0001]This application claims the benefit under 35 USC 119(e) of U.S. Provisional Application No. 62 / 933,583, filed on Nov. 11, 2019 and U.S. Provisional Application No. 63 / 053,280, filed on Jul. 17, 2020, which both are incorporated herein by reference in their entirety.BACKGROUND OF THE INVENTION[0002]Many processes in the chemical, biochemical, pharmaceutical, food, beverage and in other industries require some type of monitoring. Sensors have been developed and are available to measure pH, dissolved oxygen (DO), temperature or pressure in-situ and in real-time. Common techniques for detecting chemical constituents include high performance liquid chromatography (HPLC), gas chromatography-mass spectroscopy (GCMS), or enzyme- and reagent-based electrochemical methods.[0003]Various optical spectroscopy approaches are also available to assess components, also referred to as analytes, in a sample. Among these, probably the most common is absorption spectroscopy. In...

Claims


Application Information

Patent Timeline
IPC IPC(8): G01N21/39C12M1/34G01N33/68G01N21/45G01N21/359G01N21/3577
CPCG01N21/39C12M41/32G01N33/6854G01N2201/06113G01N21/359G01N21/3577G01N21/45G01N21/31G01N2021/451G01N21/8507G01J3/26G01N2021/399
Inventor HASSELL, BRYAN A.ATIA, WALID A.MARCHESSAULT, DAVID P.
Owner NIRRIN BIOPROCESS ANALYTICS INC
Learn More