Image forming cytometer
a cytometer and image technology, applied in the field of image cytometry analysis, can solve the problems of difficult microscopy, poor contrast, and microscopy that requires specialised optical components, and achieves the effect of simple, effective and reliabl
- Summary
- Abstract
- Description
- Claims
- Application Information
AI Technical Summary
Benefits of technology
Problems solved by technology
Method used
Image
Examples
example 2
Properties of Low Wavelength Microscopy
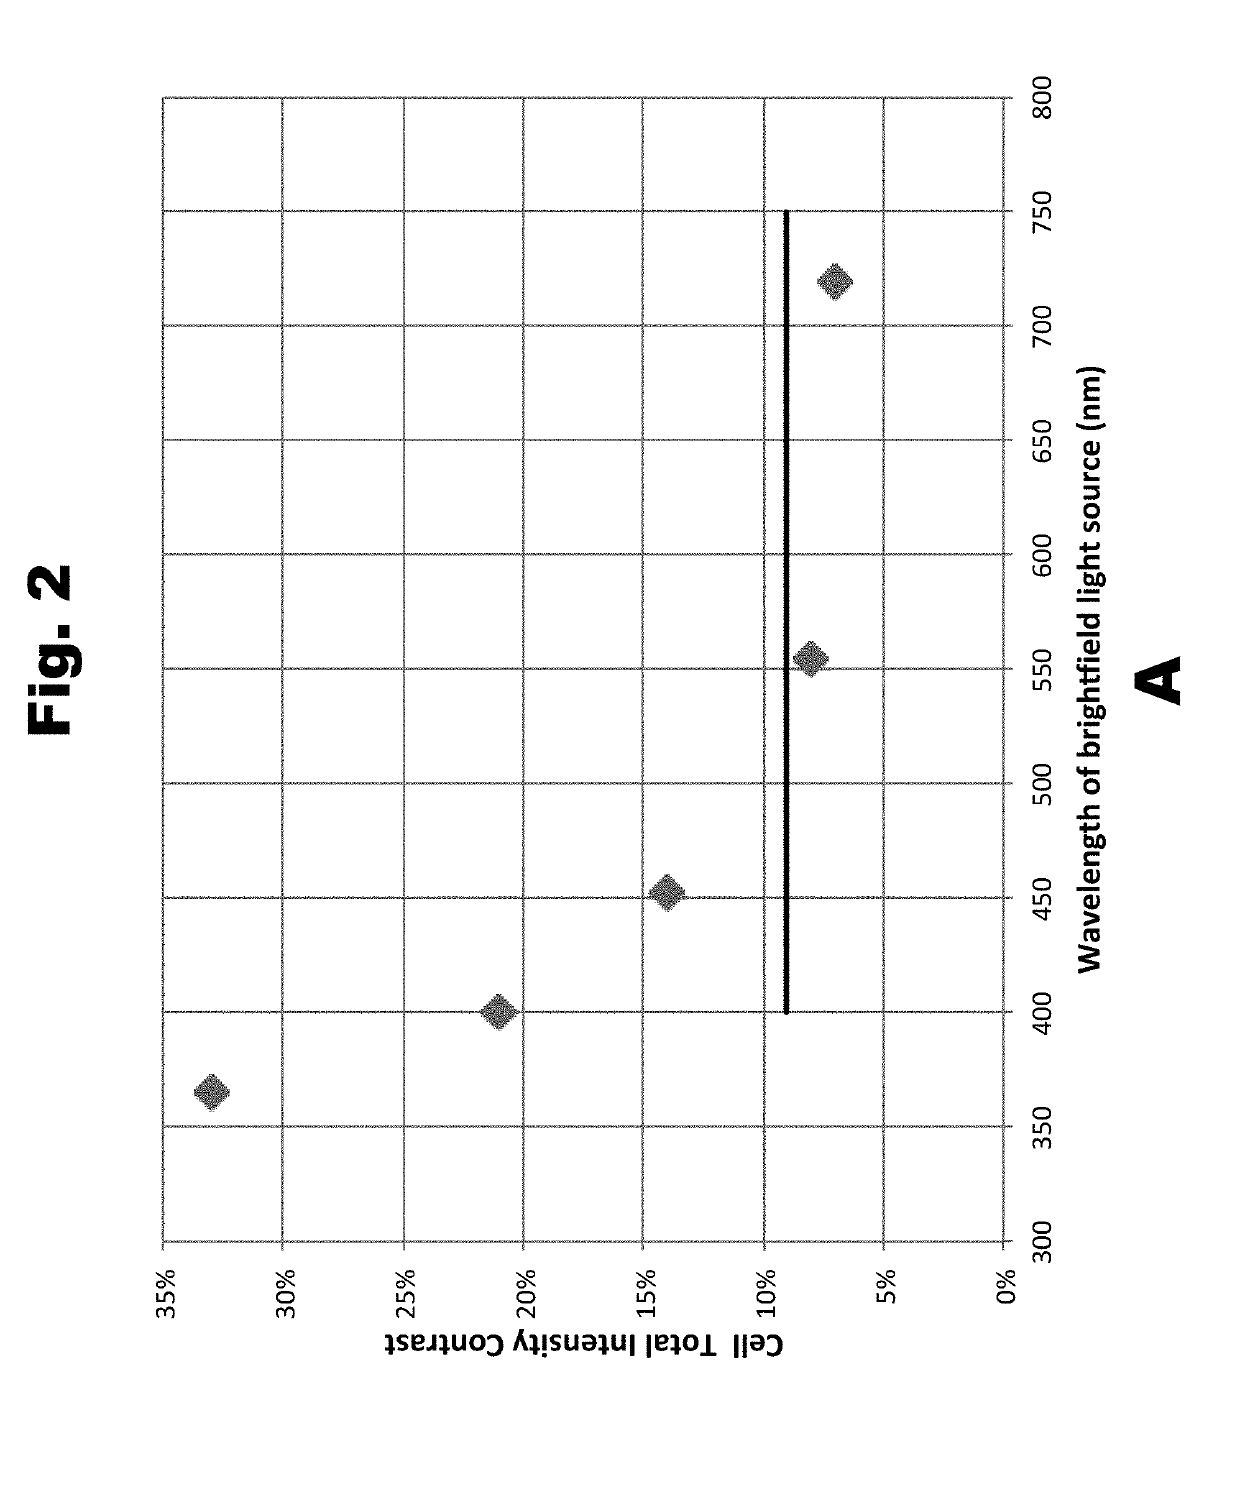
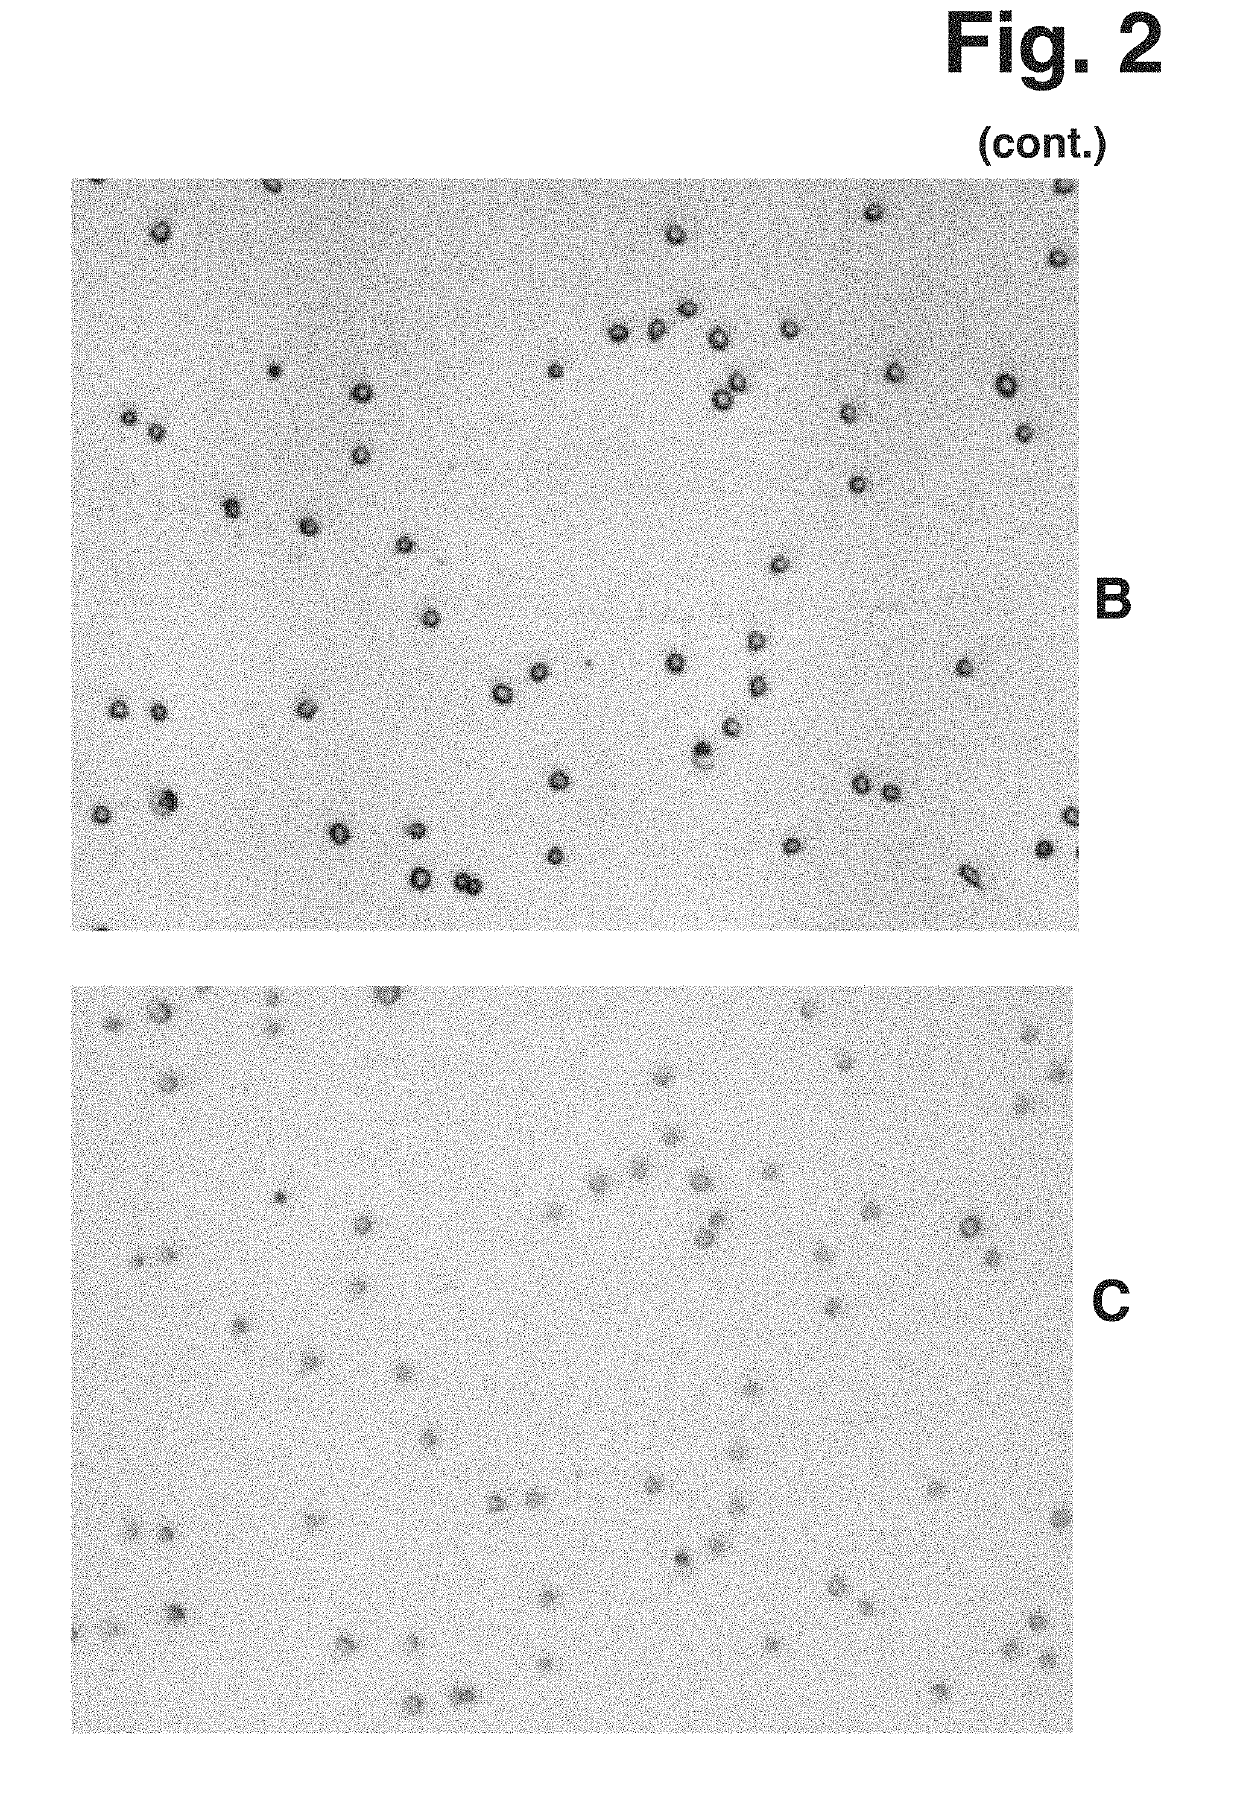
[0120]Contrast in Bright Field microscopy according to the present invention was investigated by measuring a sample of Jurkat cells (human leukemia cell line, subclone A3, ATCC CRL-2570). The measurements were performed using four light sources of different wavelength. Three of the light sources were single colour narrow-waveband Light Emitting Diodes (LEDs) and the fourth light source was a broad- waveband white LED. All light sources were in optical arrangement where emitted light was collimated when passing the sample.
[0121]The output from the narrow- waveband LEDs was used without modification but the output from the white LED was used with modification, as well as being modified using narrow-band filters. The wide- waveband light from the white LED represents typical conditions of visible microscopy. The principle wavelengths of the narrow-waveband light used in the measurement are listed in the following Table 2-1.
TABLE 2-1List of Light S...
example 3
Enhancement of Signal to Background
[0126]When performing fluorescence analysis of a biological sample it is important to manage excitation and emission light in order to obtain adequate contrast in the image. There are basically two approaches to improving contrast, firstly to use an excitation filter to reduce light of wavelength longer than what is used for the excitation of fluorescence and secondly to use an emission filter to reduce light of wavelength shorter than the fluorescent light from reaching the array of active detection elements.
[0127]In order to perform high-sensitivity fluorescence analysis, where signal contrast is an important aspect, it is necessary to consider all aspects of the optical system which affect the collected intensity information. This includes aspects such as excitation intensity, auto-fluorescence of any component of the system and attenuation of optical filters. In the task of improving contrast in collecting fluorescence spatial intensity informa...
example 4
Detection of Particle Standard
[0138]A system according to the present invention was used to identify and quantify calibration beads, which typically are used to calibrate flow cytometry instruments. The beads were Rainbow Calibration Particles (P / N RCP-30-5A), Spherotech USA a set of beads 3 μm in diameter comprising 8 groups producing different intensities of fluorescence.
[0139]The image cytometer of the present invention was set to illuminate the sample with excitation light in a narrow band around 475 nm and to detect fluorescence emission in a waveband at around 536 nm. Light from the sample compartment was collected using 4× collection objective with NA 0.20 and focused onto the array of active detection elements. The beads were handled according to instructions provided by the supplier and placed in a sample compartment of approximately 100 μm thickness.
[0140]Series of images of spatial light intensity information were collected by an array of active detection elements, firstl...
PUM
| Property | Measurement | Unit |
|---|---|---|
| incidence angle | aaaaa | aaaaa |
| incidence angle | aaaaa | aaaaa |
| incidence angle | aaaaa | aaaaa |
Abstract
Description
Claims
Application Information
 - R&D
- Intellectual Property
- Life Sciences
- Materials
- Tech Scout
- Unparalleled Data Quality
- Higher Quality Content
- 60% Fewer Hallucinations
Browse by: Latest US Patents, China's latest patents, Technical Efficacy Thesaurus, Application Domain, Technology Topic, Popular Technical Reports.
© 2025 PatSnap. All rights reserved.Legal|Privacy policy|Modern Slavery Act Transparency Statement|Sitemap|About US| Contact US: help@patsnap.com


