
Anomaly data priority assessment device and anomaly data priority assessment method

a technology of anomaly data and priority assessment, which is applied in the direction of instruments, testing/monitoring control systems, process and machine control, etc., can solve the problems of large amount of anomaly data detected, take a lot of time to analyze and process factors and countermeasures, and achieve high accuracy

Inactive Publication Date: 2019-10-10
MITSUBISHI ELECTRIC CORP
View PDF0 Cites 27 Cited by
  • Summary
  • Abstract
  • Description
  • Claims
  • Application Information

AI Technical Summary

Benefits of technology

The present invention allows for the quick and accurate identification of important anomaly data from a large amount of data. This means that important data can be prioritized and analyzed more efficiently.

Problems solved by technology

Data matching a predetermined condition is detected as anomaly data with respect to the acquired data, but since a population parameter of the data is large, a large amount of anomaly data are detected.
For all of these numerous anomaly data, it takes a lot of time to analyze and process factors and countermeasures.

Method used


Image

  • Anomaly data priority assessment device and anomaly data priority assessment method
  • Anomaly data priority assessment device and anomaly data priority assessment method
  • Anomaly data priority assessment device and anomaly data priority assessment method

Examples


first embodiment

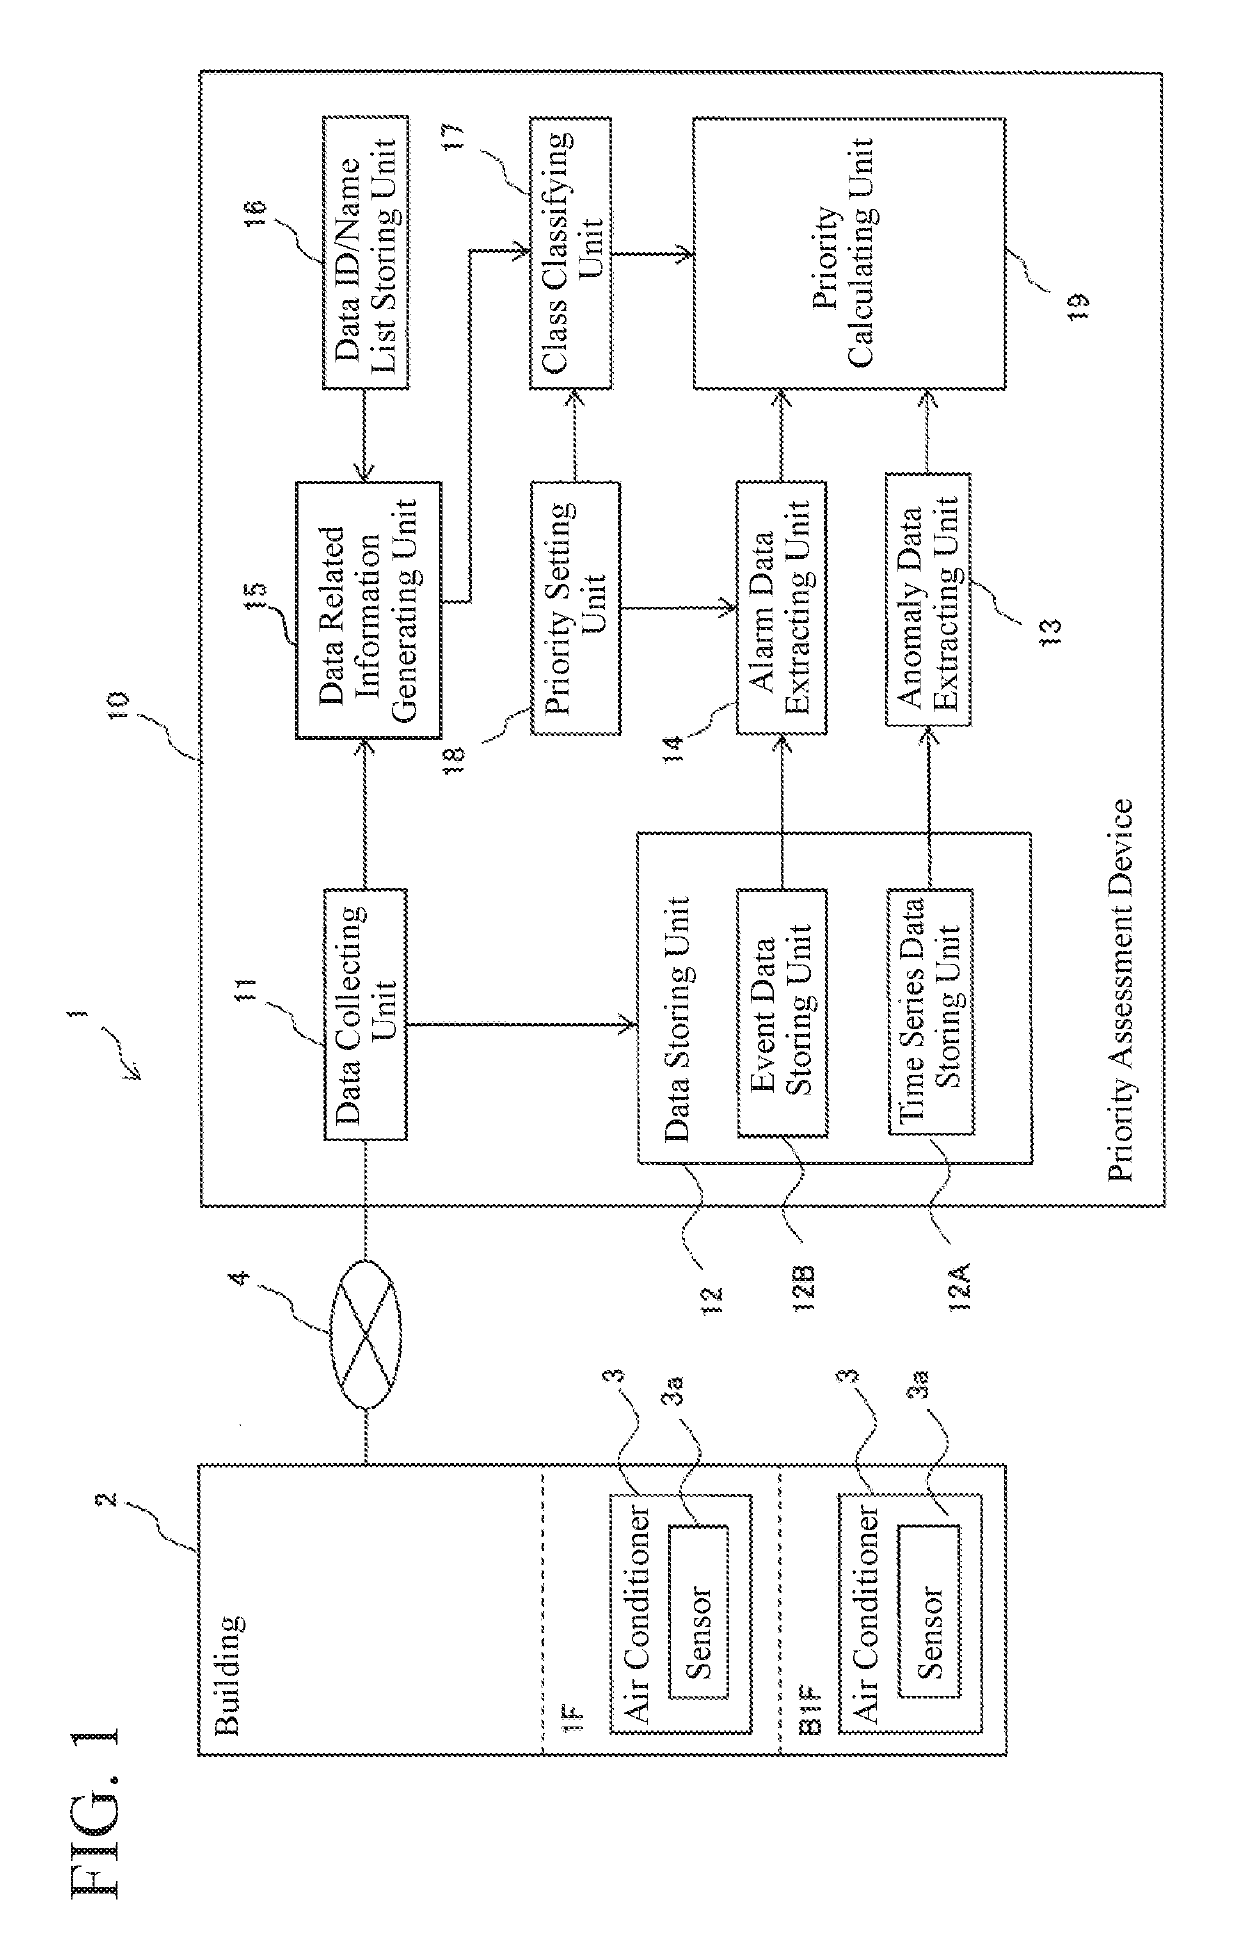
[0028]FIG. 1 is an overall configuration diagram of a facility management system 1 including an anomaly data priority assessment device 10 according to the present invention. The facility management system 1 acquires detection data from sensors 3a of air conditioners 3 installed on each floor of a building 2 as facilities, and performs diagnosis and management of the air conditioners 3 on the basis of the acquired detection data. Note that, in addition to the air conditioners 3, the building 2 also includes various facilities such as lighting facilities and power substations, and a large amount of detection data can be obtained therefrom, but in the first embodiment, detection data from the sensors 3a of the air conditioners 3 will be described.

[0029]Among the detection data, the facility management system 1 analyzes anomaly data, in particular, for diagnosis and management, and since a large amount of anomaly data are detected, the anomaly data priority assessment device 10 for ass...

second embodiment

[0062]Next, a second embodiment will be described. The second embodiment is the same as the first embodiment except that priority regarding occurrence timing of anomaly data and alarm data is omitted.

[0063]In the second embodiment, as shown in FIG. 9, co-occurrence of anomaly data P and alarm data, that is, an anomaly AL1, an alarm AL2, and a real alarm AL3, is determined in unit time. In FIG. 9, the unit time is set to one hour, and for example, when the anomaly data P occurs between 10:00 and 11:00, it is determined whether the anomaly AL1, the alarm AL2, or the real alarm AL3 occurs within this time. In FIG. 9, since the anomaly AL1 occurs between 10:00 and 11:00 in which the anomaly data P occurs, it is determined that the anomaly data P and the anomaly AL1 co-occur.

[0064]Note that the alarm AL2 is temporally closer to the anomaly data P than the anomaly AL1, but in the second embodiment, since the co-occurrence is determined in units of time in which the anomaly data P occurs, ...


PUM


Abstract

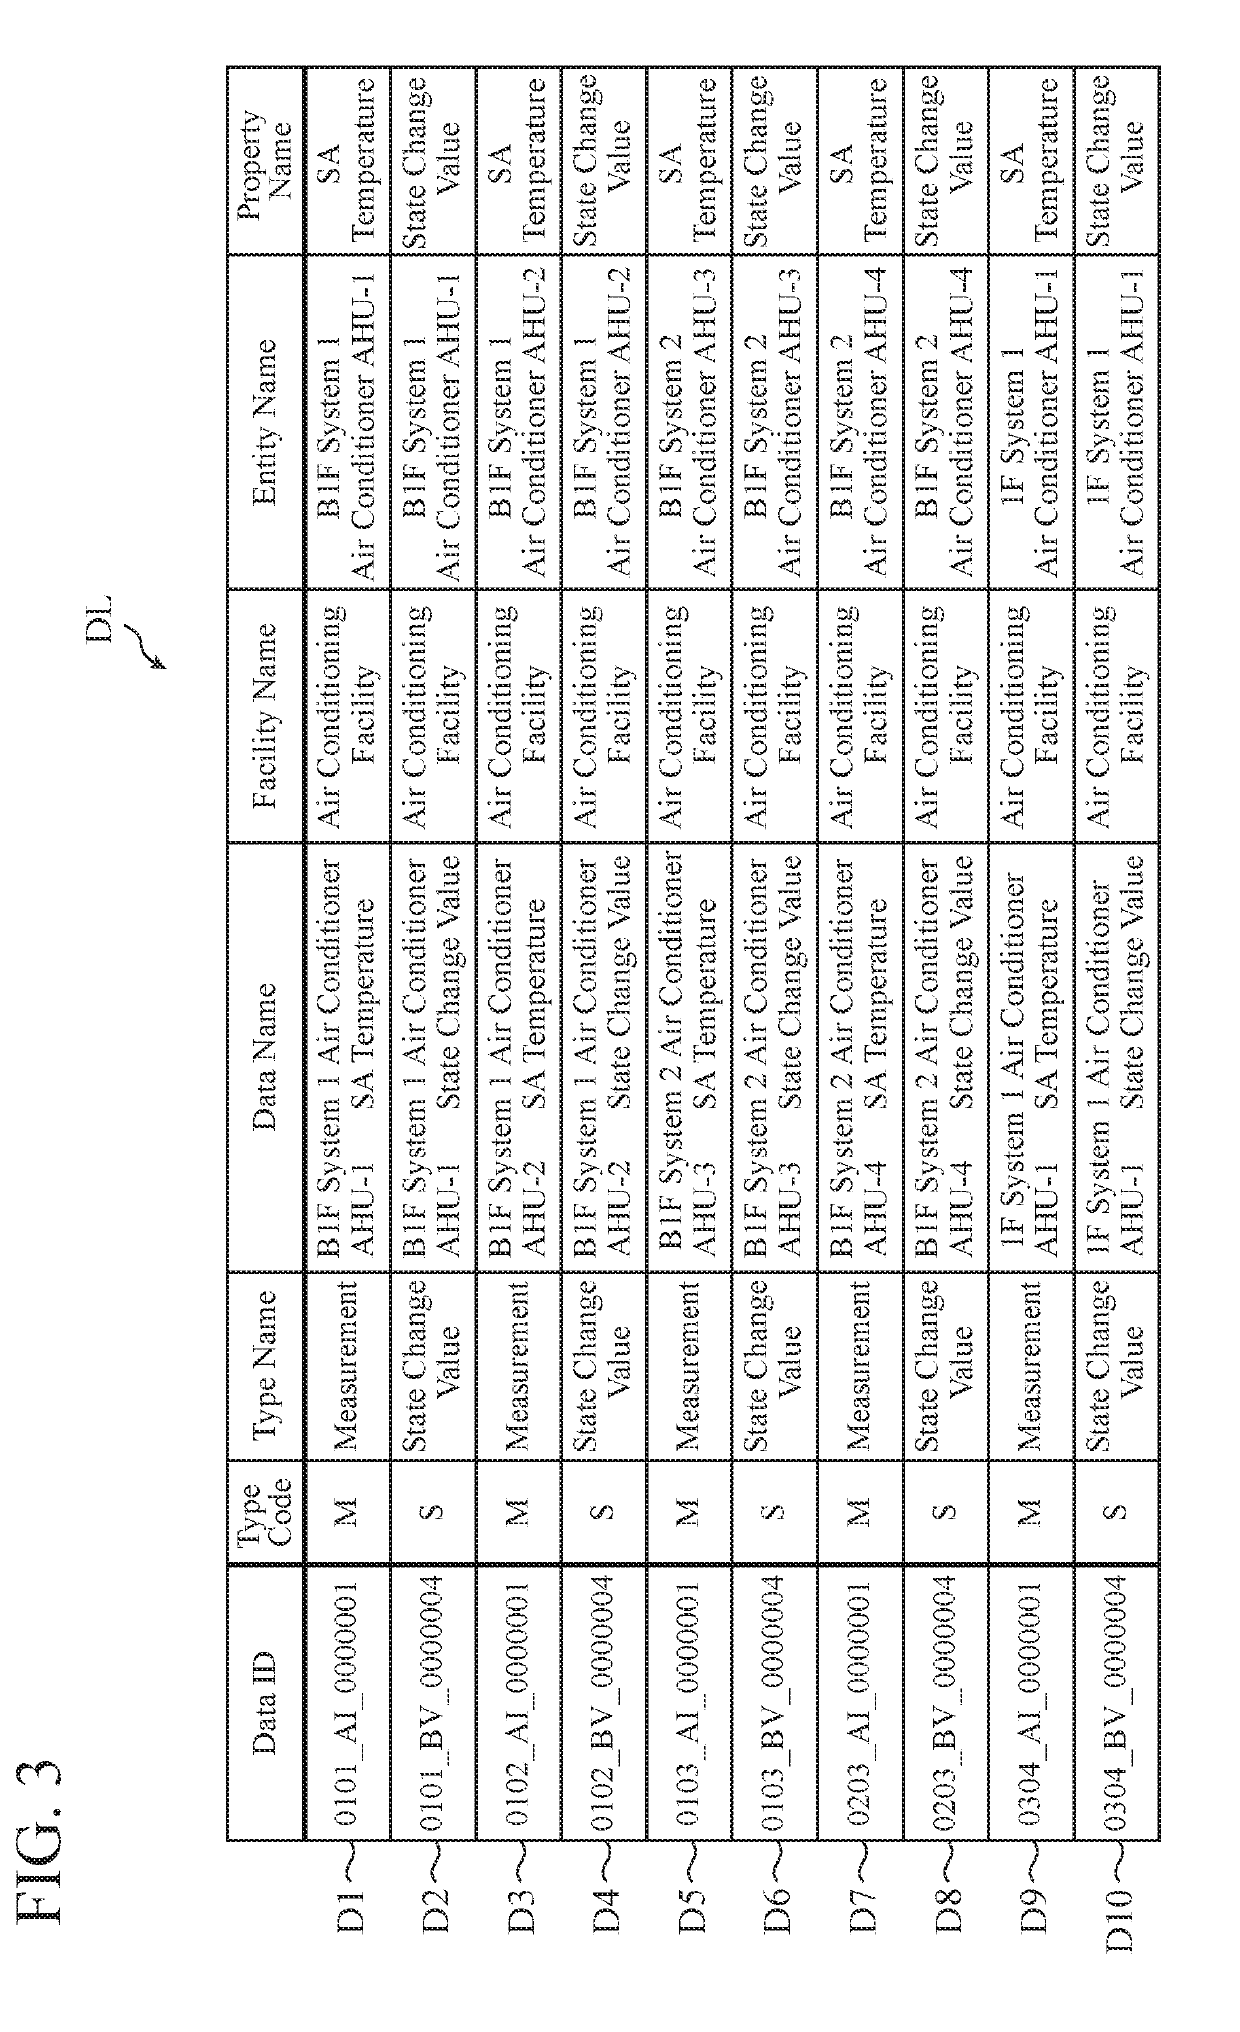
Provided are: a data related information generating unit for generating data related information DL including detection data and air conditioner information of air conditioners; a class classifying unit for creating a plurality of classes on the basis of the air conditioner information related to alarm data extracted by an alarm data extracting unit among the air conditioner information and for classifying the data related information DL into the plurality of classes; a priority setting unit for setting priority to each of a plurality of types of alarm data and the plurality of classes; and a priority calculating unit for assessing co-occurrence of anomaly data extracted by an anomaly data extracting unit and the alarm data, assessing co-occurrence of the alarm data and the plurality of classes, assigning priority about the alarm data and the plurality of classes to the co-occurred anomaly data, and calculating priority of anomaly data.

Description

TECHNICAL FIELD[0001]The present invention relates to an anomaly data priority assessment device and an anomaly data priority assessment method, and more particularly, to an anomaly data priority assessment device and an anomaly data priority assessment method for assessing priority of a large amount of anomaly data collected from facilities.BACKGROUND ART[0002]Various facilities such as lightings and air conditioners are installed in a building, plant, or the like, and a provider of a monitoring service for the building, plant, or the like acquires data on these facilities periodically or each time to monitor the facilities. When the facility to be monitored is an air conditioner, for example, the acquired data includes measured values measured by various sensors and set values, such as a set temperature, a measured temperature, an air conditioning state, a voltage value, a current value, and a pressure value. The acquired data may reach thousands depending on a size of a building ...

Claims


Application Information

Patent Timeline
IPC IPC(8): G06F16/2458
CPCG06F16/2477G06F16/2465G05B23/02G05B23/0235G05B23/0245G05B23/0278
Inventor MASUZAKI, TAKAHIKOKITAGAMI, SHINJIYONEYAMA, JUNICHIKIMURA, TAKEYUKI
Owner MITSUBISHI ELECTRIC CORP
Learn More