
Determining similarities in computer software codes for performance analysis

a technology of computer software and similarities, applied in the field of determining similarities in computer software codes for performance analysis, can solve the problems of steep learning process, difficult to follow the results of profilers, and inability to fully understand their functionalities, etc., and achieve the effect of high performance, fast, reliable and cost-effectiv

Active Publication Date: 2018-05-31
FUJITSU LTD
View PDF1 Cites 1 Cited by
  • Summary
  • Abstract
  • Description
  • Claims
  • Application Information

AI Technical Summary

Benefits of technology

The patent describes an automated way to compare and diagnose software codes using profiling technologies. The system converts text-based data from profiling tools into a standardized format and analyzes it to find areas of similarity or difference in code performance. This makes it easier for users without expert knowledge to compare and diagnose codes without having to manually sift through data. The system is fast and reliable, making it a cost-effective solution for high-performance computing and software programming communities. Overall, the invention provides a seamless and straightforward way to characterize and compare codes.

Problems solved by technology

However, the outcomes of profilers are typically not straightforward to follow, and often require deep knowledge of their functionalities.
As a result, a steep learning process for acquiring the knowledge needed for understanding working details of the profiling technologies is required.
In addition, since the analysis of these profiling results can be laborious and time-consuming, this manual process can adversely impact users' work productivity.
It is evident that the more exhaustive the profiling process is, the higher the number of different benchmarks is required.
As a result, the requirements for comprehending and processing the resulting wide-ranged metrics, produced in a text-based format, are also exhaustive.
Therefore, obtaining a standard format for representing a particular metric and comparing its values against those produced by the other benchmarks, which may also have been produced by different profiling tools, can be tedious and very inefficient.
While some of these profiling technologies have further been provisioned to provide visual interpretations (images) on codes' performance, so-called ‘trace files’, such images between profilers are never of a standard format.

Method used


Image

  • Determining similarities in computer software codes for performance analysis
  • Determining similarities in computer software codes for performance analysis
  • Determining similarities in computer software codes for performance analysis

Examples


Embodiment Construction

[0023]Reference will now be made in detail to the embodiments, examples of which are illustrated in the accompanying drawings, wherein like reference numerals refer to the like elements throughout. The embodiments are described below by referring to the figures.

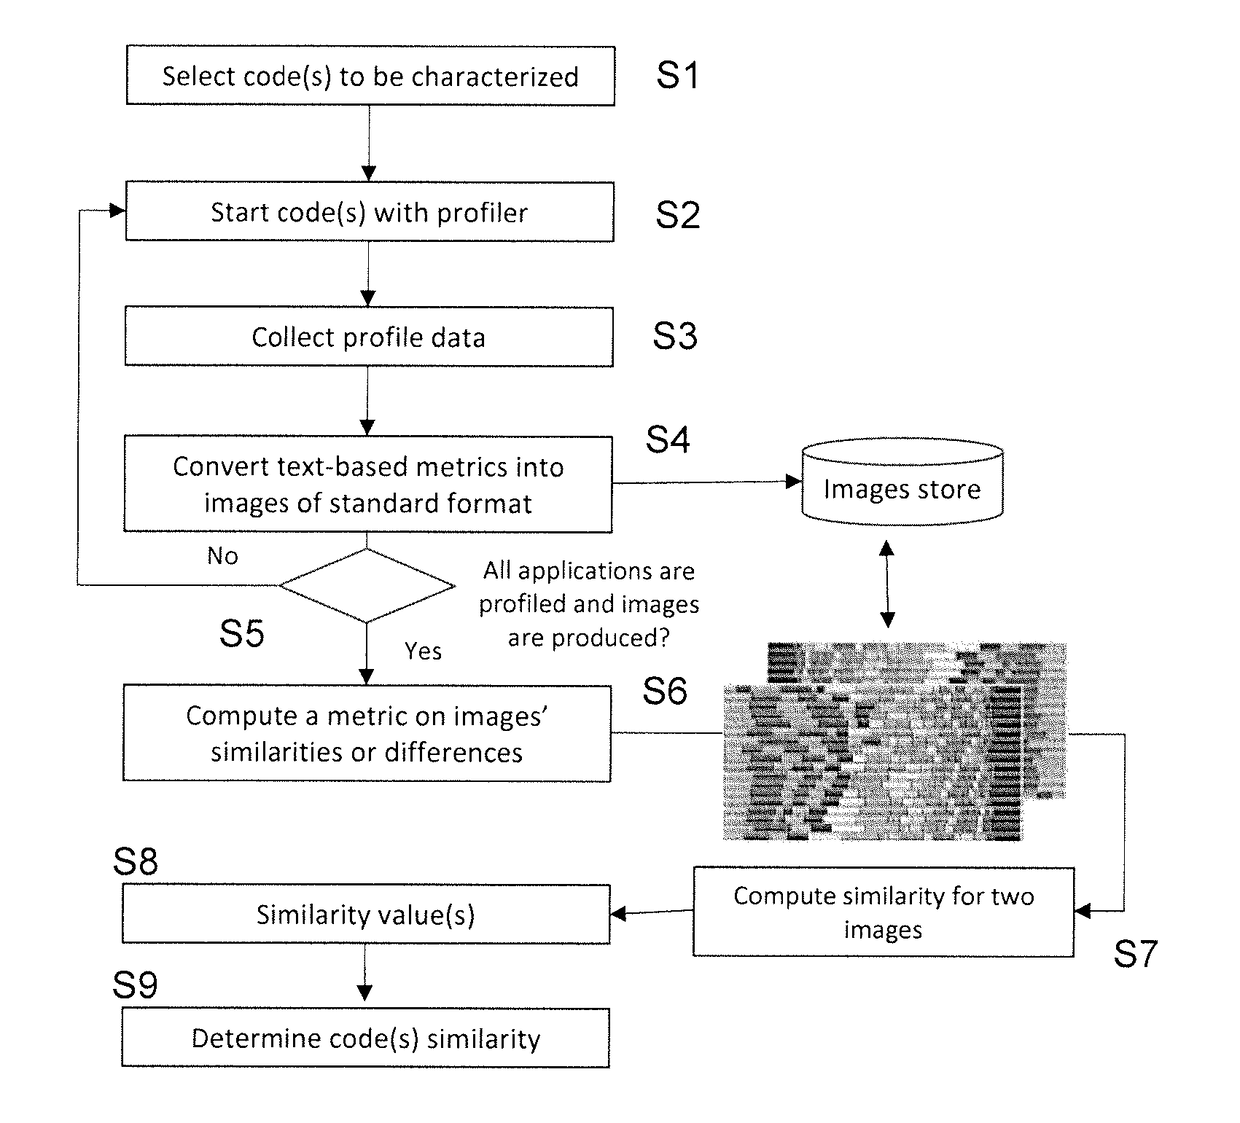
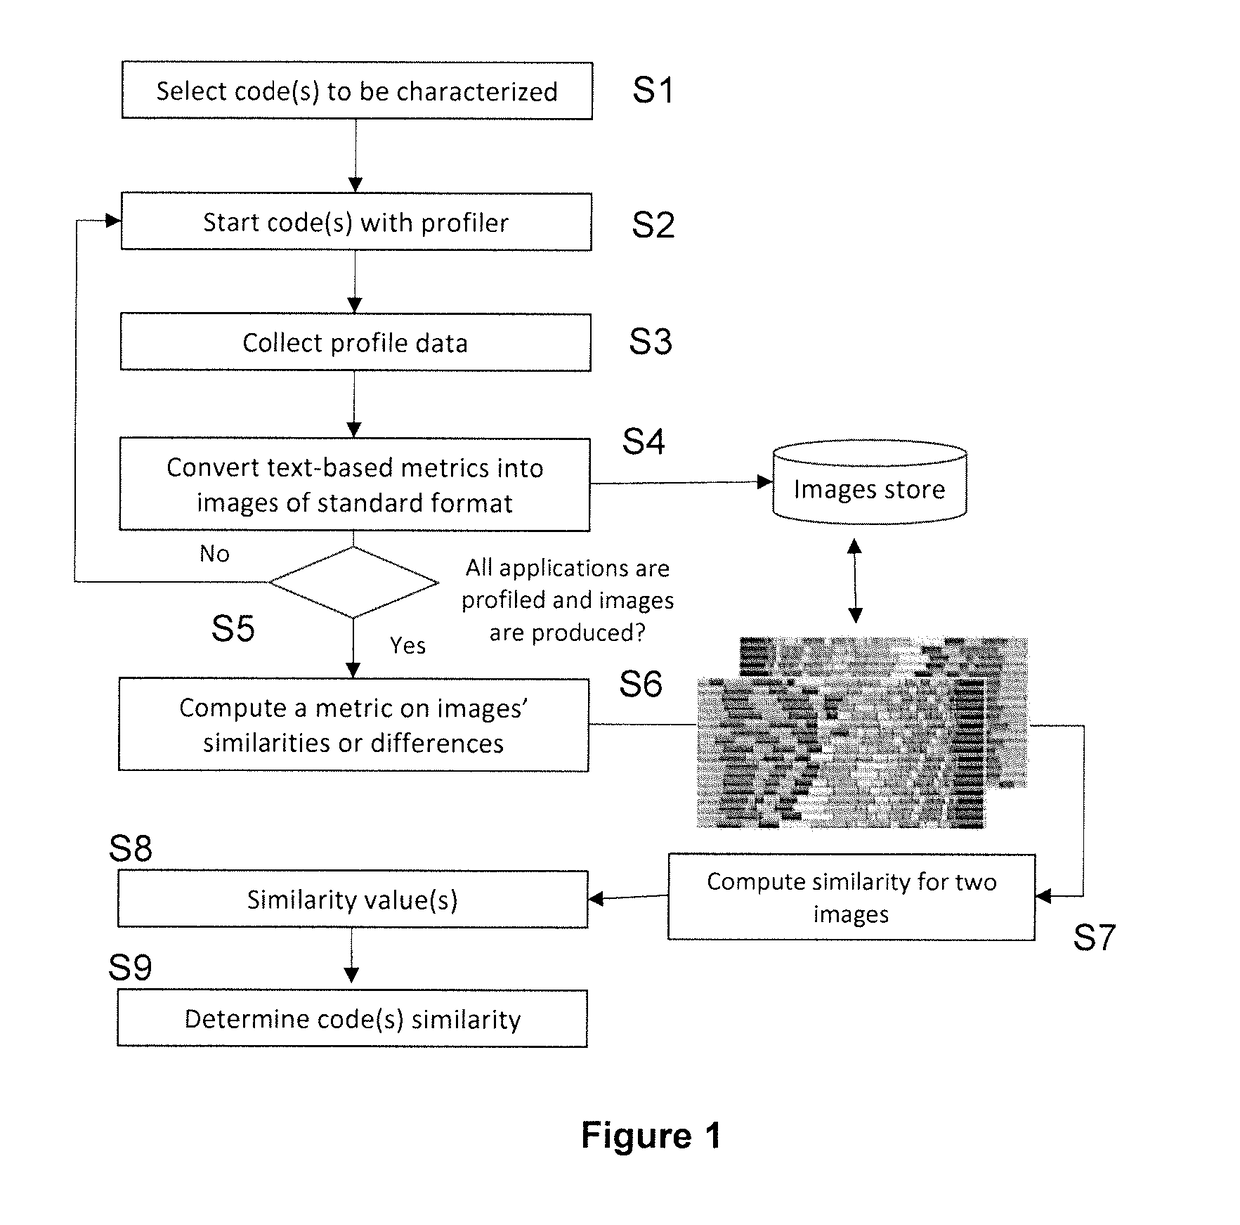
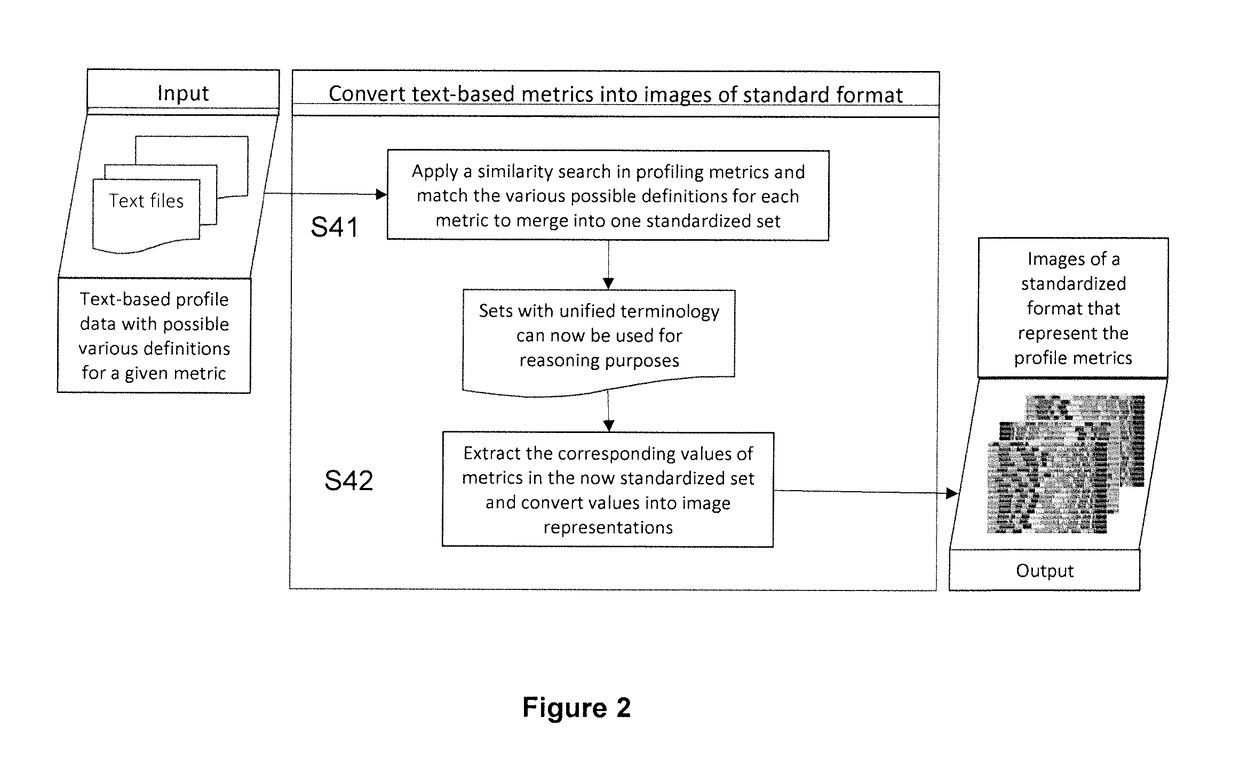
[0024]An embodiment provides a method and apparatus to compute similarities, or differences, in profiling metrics for computer software codes (different applications / executables and / or different instances of the same application / executable) for use in analysis of execution performance. This may be achieved as follows:[0025]Firstly, the definitions used for representing metrics on codes' performance are standardized[0026]Secondly, the values that correspond to the now standardized metrics are converted into images, where all images have the same format (although it is not essential to use a specific format)[0027]Thirdly, similarities / differences between these images is determined (for example, using a deep neutral network as a...


PUM


Abstract

Execution performance of software code is analyzed by converting values of profiling metrics, obtained by at least one software profiling tool in respect of at least one computer software code, into images using a profiling metric conversion process. The conversion process may comprise identifying a set of profiling metrics with synonymous labels within a plurality of labeled profiling metrics whose values are to be converted, using at least one natural language processing scheme, matching all profiling metrics in the set to the same label, and, for each set of profiling metrics, converting values corresponding to the profiling metrics in the set into respective images such that all the converted images have the same image format. The comparison method further comprises computing at least one of similarities and differences between at least two of the images, and comparing execution performance of the software code(s) corresponding to the two images based on the results of the computation.

Description

CROSS-REFERENCE TO RELATED APPLICATIONS[0001]This application claims the benefit of German Application No. 102016223484.6, filed Nov. 25, 2016, in the German Intellectual Property Office, the disclosure of which is incorporated herein by reference.BACKGROUND1. Field[0002]The present embodiments relate to determining similarities in computer software codes for use in execution performance analysis.2. Description of the Related Art[0003]Characterising the performance of computer software codes (applications / executables), and finding similarities between their execution profiles, relies on interpreting the outcome from profilers, i.e. software profiling tools that perform a profiling process. Profiling is a form of program analysis that measures a variety of metrics that characterise software applications, with focus on run-time behaviour given a particular input. Non-exhaustive examples of such metrics are the elapsed time from the beginning to the end of the program execution, and th...

Claims


Application Information

Patent Timeline
Patent Type & Authority Applications(United States)
IPC IPC(8): G06F11/36G06F11/30G06F11/34
CPCG06F11/3616G06F11/302G06F11/3428G06F11/3466G06F11/3612
Inventor AL-JARRO, AHMED
Owner FUJITSU LTD
Learn More