Blood-based biomarkers of tumor sensitivity to pd-1 antagonists
a blood-based biomarker and tumor sensitivity technology, applied in the field of cancer treatment, can solve the problems of significant number of patients not showing an anti-tumor response, and achieve the effect of inhibiting binding
- Summary
- Abstract
- Description
- Claims
- Application Information
AI Technical Summary
Benefits of technology
Problems solved by technology
Method used
Image
Examples
example 1
n of Whole Blood Samples and Subsequent Gene Expression Analysis Using the NanoString nCounter™System or the Illumina TrueSeq NGS System
1. Patient Cohort:
[0249]Keynote-001 is a phase 1 study sponsored by Merck Sharp and Dohme Corp. to assess the safety and efficacy of single-agent pembrolizumab in patients with progressive locally advanced or metastatic carcinoma, melanoma and NSCLC. A secondary objective of Keynote-001 is to investigate the correlation between biomarkers and the anti-tumor activity of pembrolizumab. Exploratory biomarker research included the collection of whole blood samples for gene expression profiling. Gene expression analysis was performed on baseline and post-dose blood samples for 44 melanoma patients from the Keynote-001 study. This cohort of 44 patients had the following characteristics.
[0250]75% of the patients had received previous ipilimumab treatment. Pembrolizumab dose & treatment schedules varied among the patients as follows:[0251]10 mg / kg given onc...
example 2
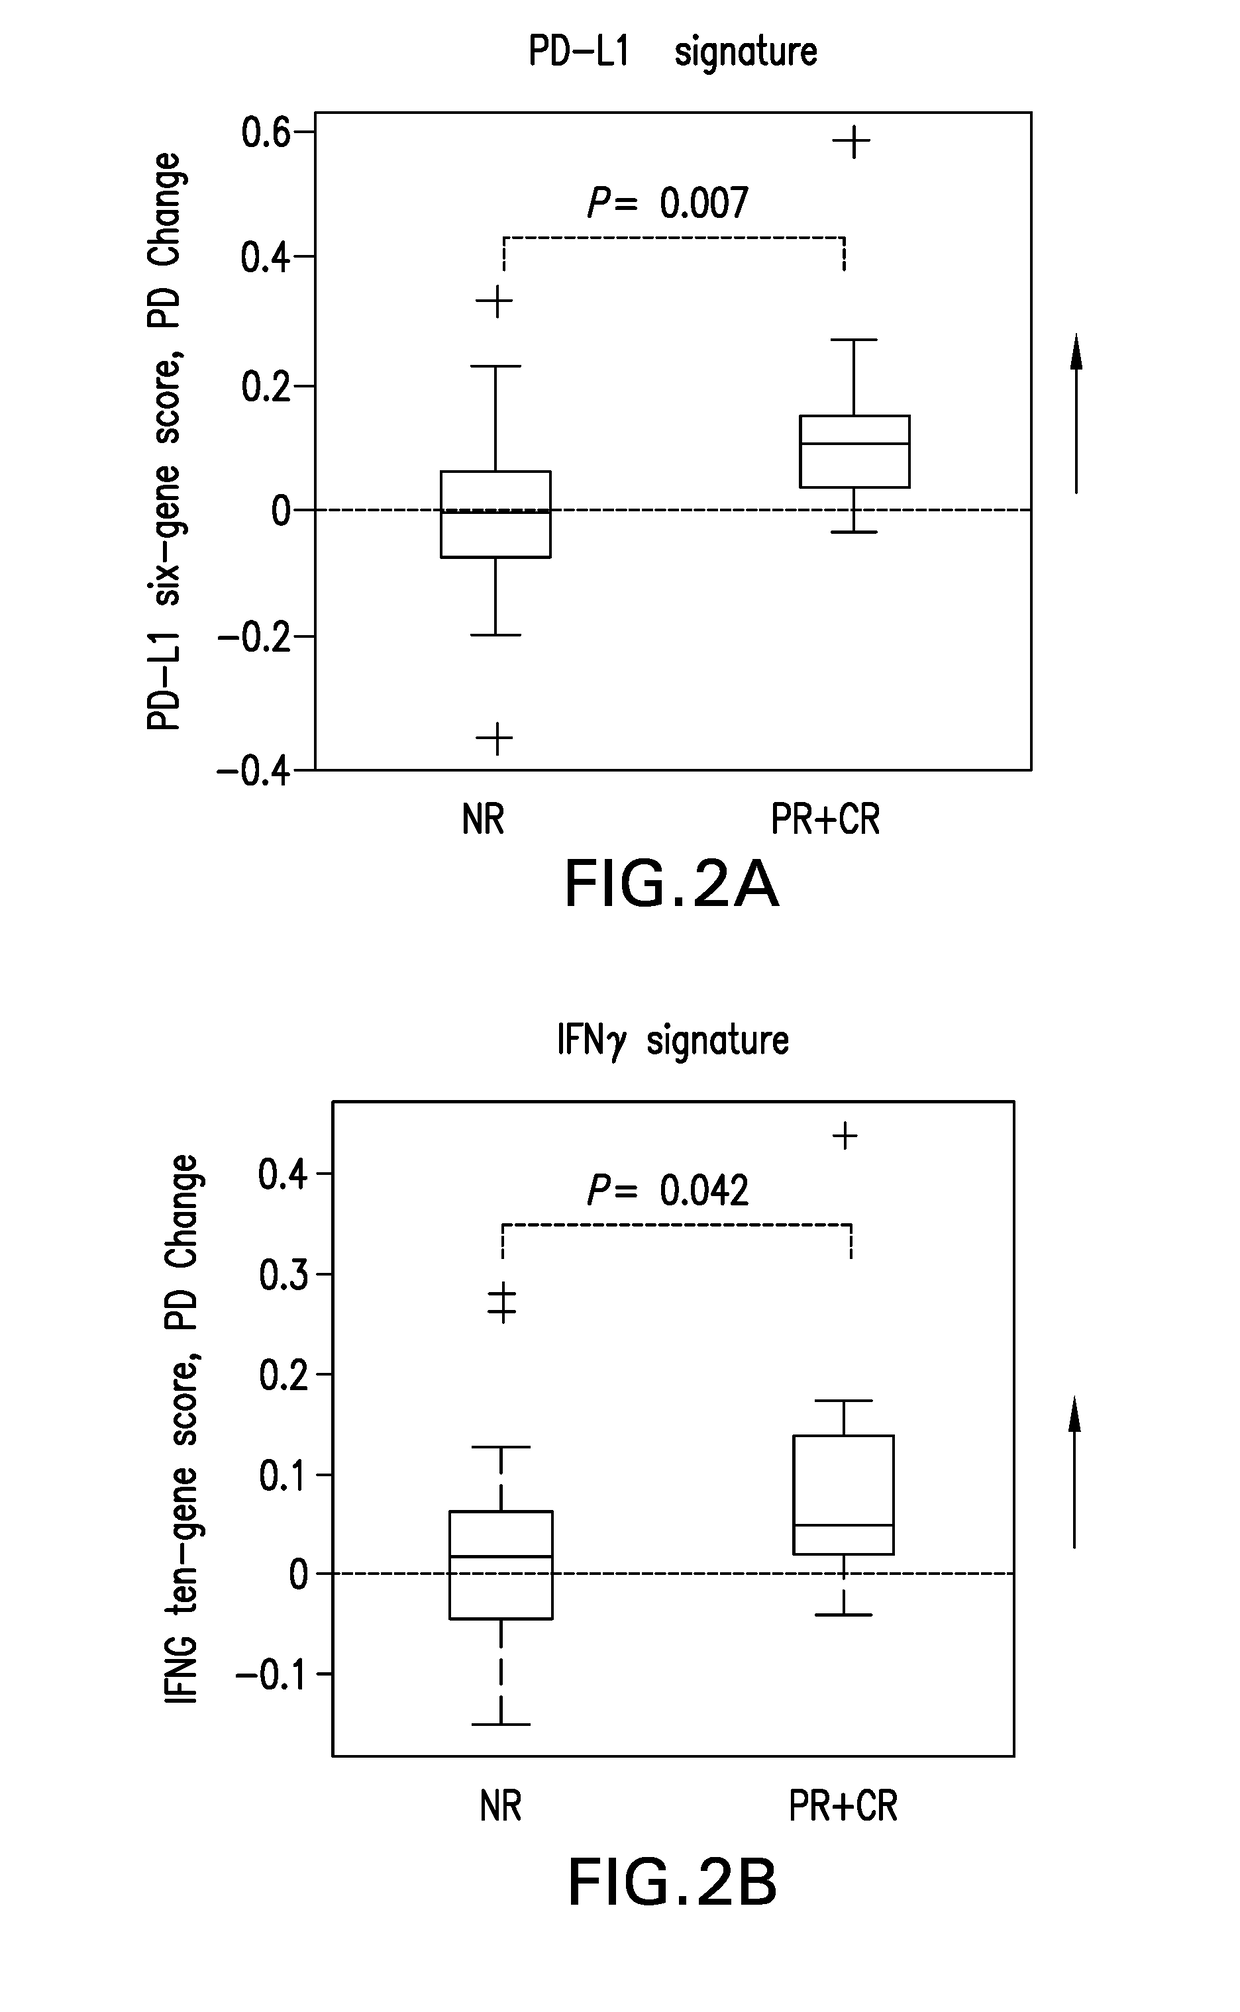
of PD-L1 and IFNG Gene Signature Scores and Anti-Tumor Response in Melanoma Patients Treated with Pembrolizumab
[0261]Formal hypothesis testing was applied to associating gene signature scores with clinical outcomes as the inventors remained blinded to the clinical outcome data prior to finalization of the statistical analysis plan and construction of gene signature scores.
[0262]PD-1 and PD-L1 RNA expression measured by RNA-Seq was analyzed by paired t-test comparing baseline and post-dose levels in blood samples across the 44 melanoma patients and the results shown in FIG. 1. The X-axis shoes −log(10p) values of 1, 2, 3, 4, which correspond to p-values of 0.1, 0.01, 0.001, and 0.0001 respectively. The first dotted vertical line corresponds to a p-value 0.05. The Y-axis shows estimates of false discovery rate by Benjamini Hochberg method. Statistically significant post-single dose changes in expression of PD-1 and PD-L1 were observed, with p-values p-value<0.001 and p-value<0.01, res...
PUM
| Property | Measurement | Unit |
|---|---|---|
| Time | aaaaa | aaaaa |
| Time | aaaaa | aaaaa |
| Fraction | aaaaa | aaaaa |
Abstract
Description
Claims
Application Information
 - R&D
- Intellectual Property
- Life Sciences
- Materials
- Tech Scout
- Unparalleled Data Quality
- Higher Quality Content
- 60% Fewer Hallucinations
Browse by: Latest US Patents, China's latest patents, Technical Efficacy Thesaurus, Application Domain, Technology Topic, Popular Technical Reports.
© 2025 PatSnap. All rights reserved.Legal|Privacy policy|Modern Slavery Act Transparency Statement|Sitemap|About US| Contact US: help@patsnap.com


