PME-1 as a biomarker to predict and diagnose endometrial and breast cancer and gene silencing of PME-1 to inhibit epithelial to mesenchymal transition
- Summary
- Abstract
- Description
- Claims
- Application Information
AI Technical Summary
Benefits of technology
Problems solved by technology
Method used
Image
Examples
example 1
PME-1 Expression in Endometrial Cell Lines
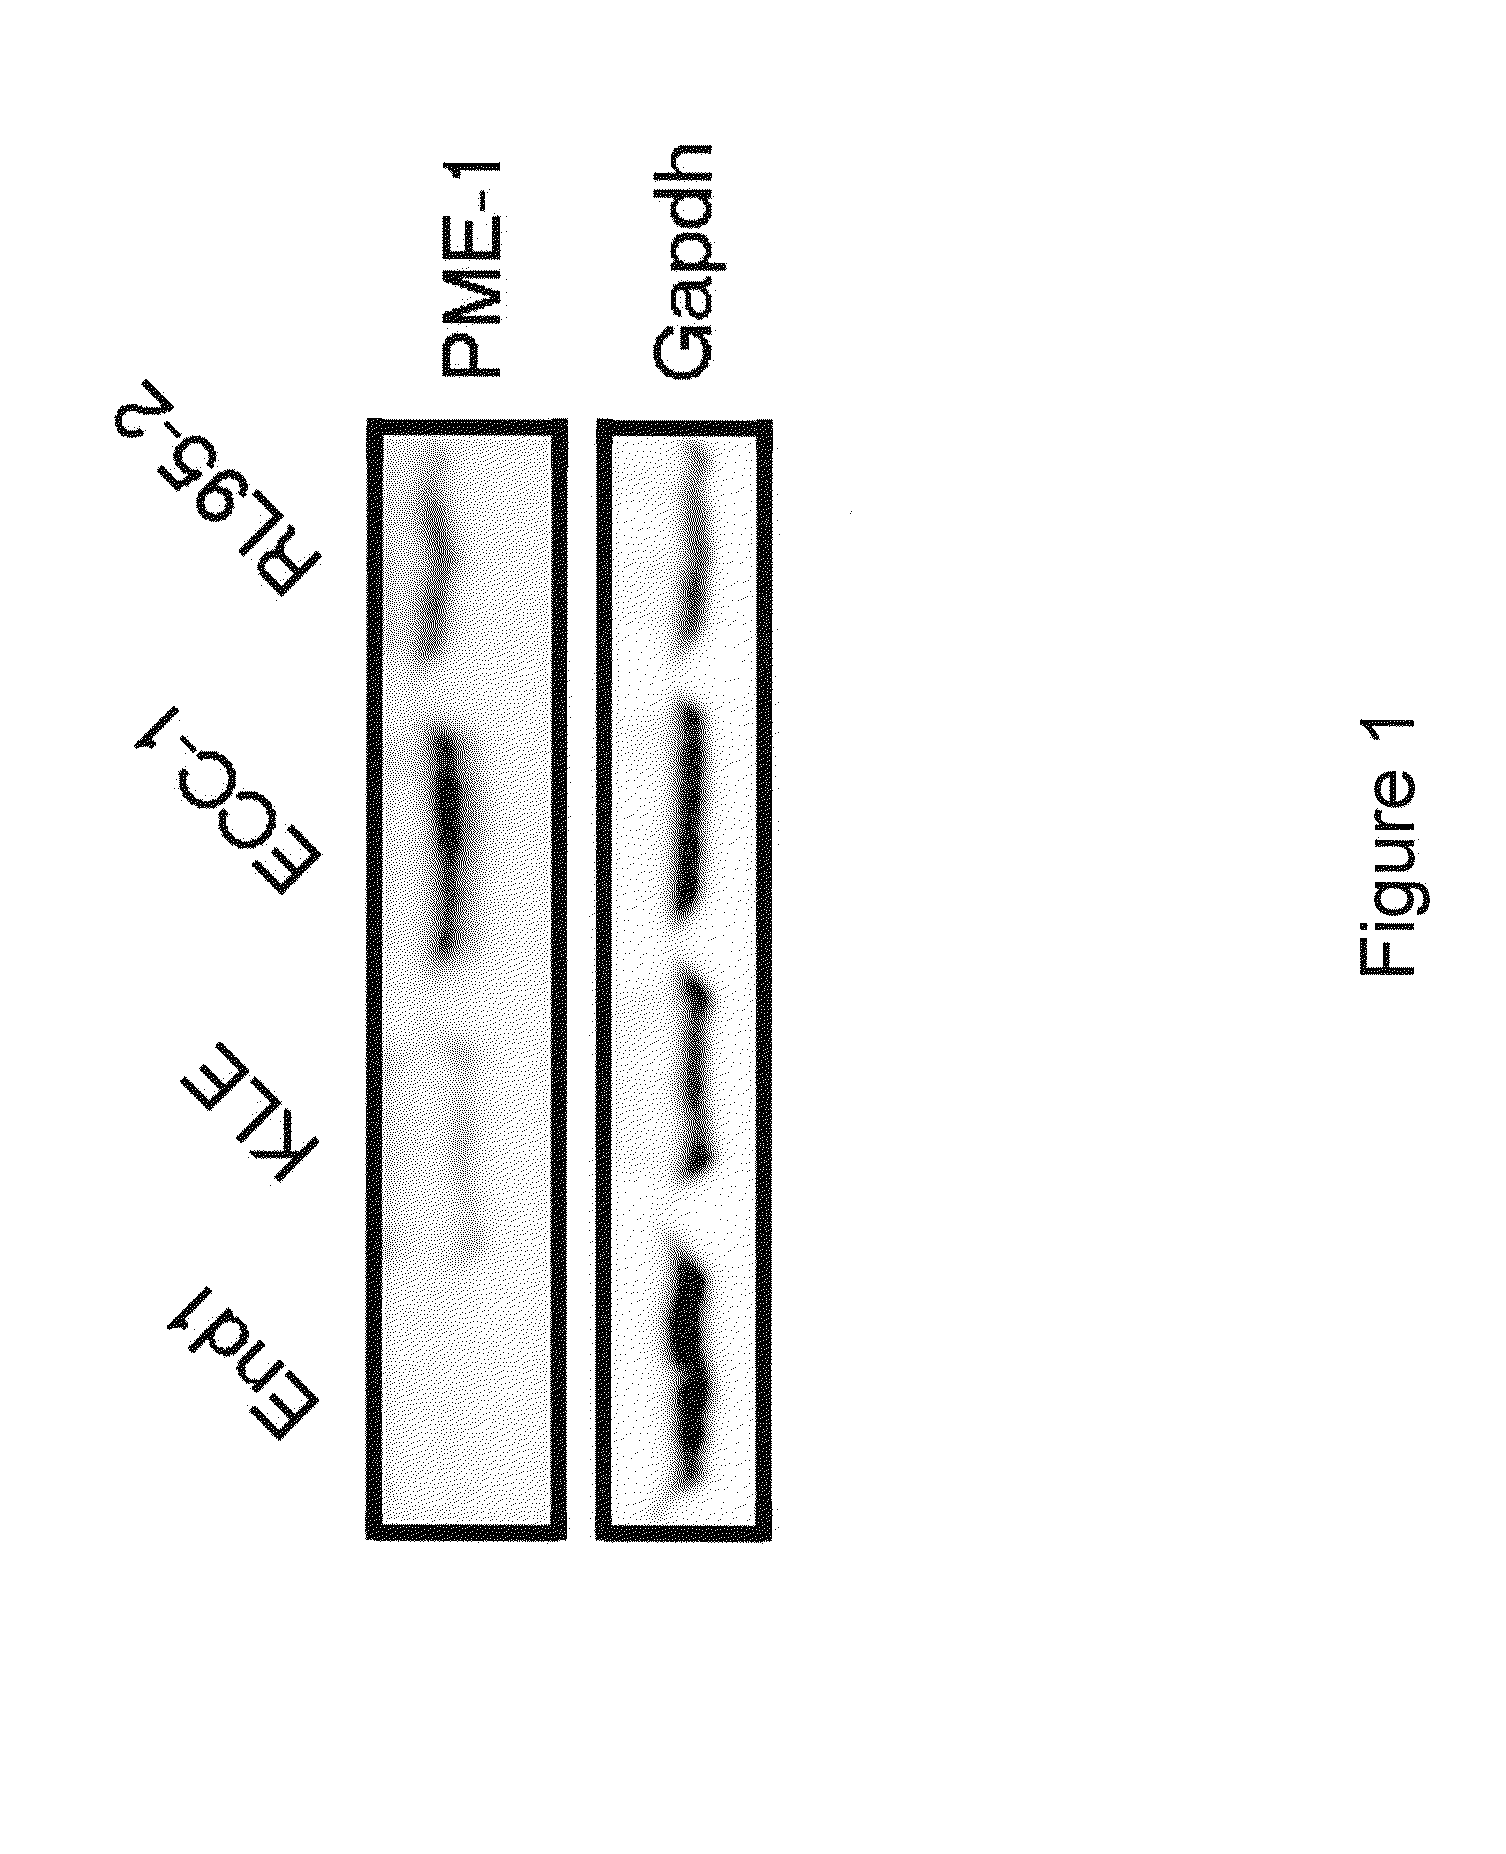
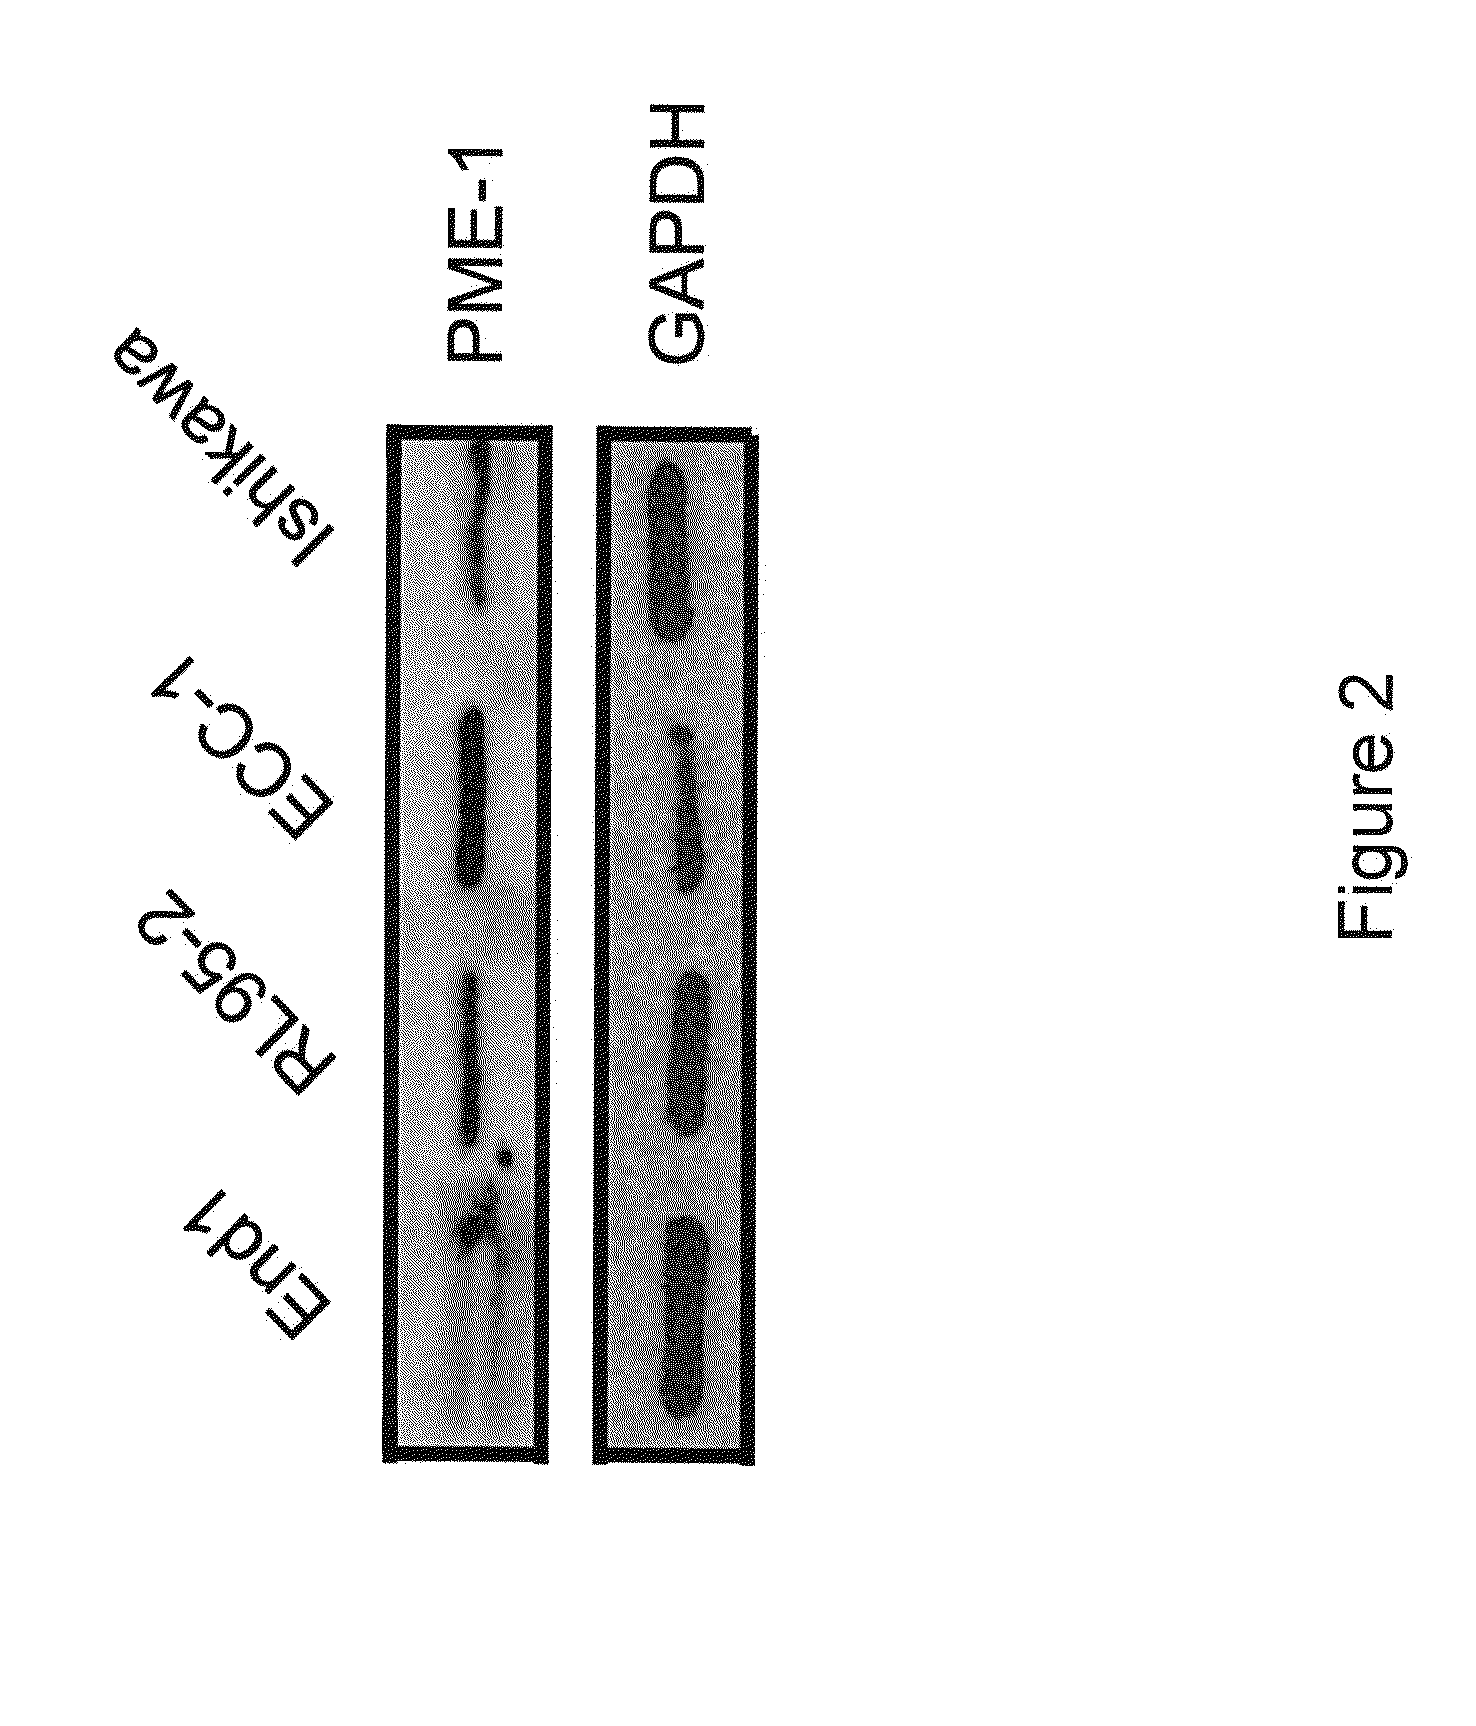
[0261]In these initial studies, we sought to determine the expression levels of PME-1 in various human endometrial cell lines (EC). We examined the expression level of PME-1 protein using Western Blot analysis (See, Materials and Methods).
[0262]As shown in FIGS. 1 and 2, the more aggressive / metastatic EC cell lines (RL95-2, Ishikawa, and ECC-1) were found to express more abundant PME-1 protein as compared to the less aggressive / metastatic EC line (KLE) and the immortalized endocervical cell line, End1. GAPDH was used as a loading control in these studies. These data suggest that PME-1 is expressed in endometrial cancer cells. The expression of PME-1 protein levels correlates with the degree of aggressiveness of EC; namely, the more aggressive / metastatic activity of EC, the higher the expression of PME-1 protein levels.
example 2
Western Blot Analysis of PME-1 Protein Expression in Tissue Samples from Patients with Endometrial Adenocarcinoma
[0263]After establishing that the degree of aggressiveness / metastasis in EC cell lines indeed correlates with an increased level of PME-1 protein, we next determined whether the same trend might occur in endometrial tissue samples obtained from patients.
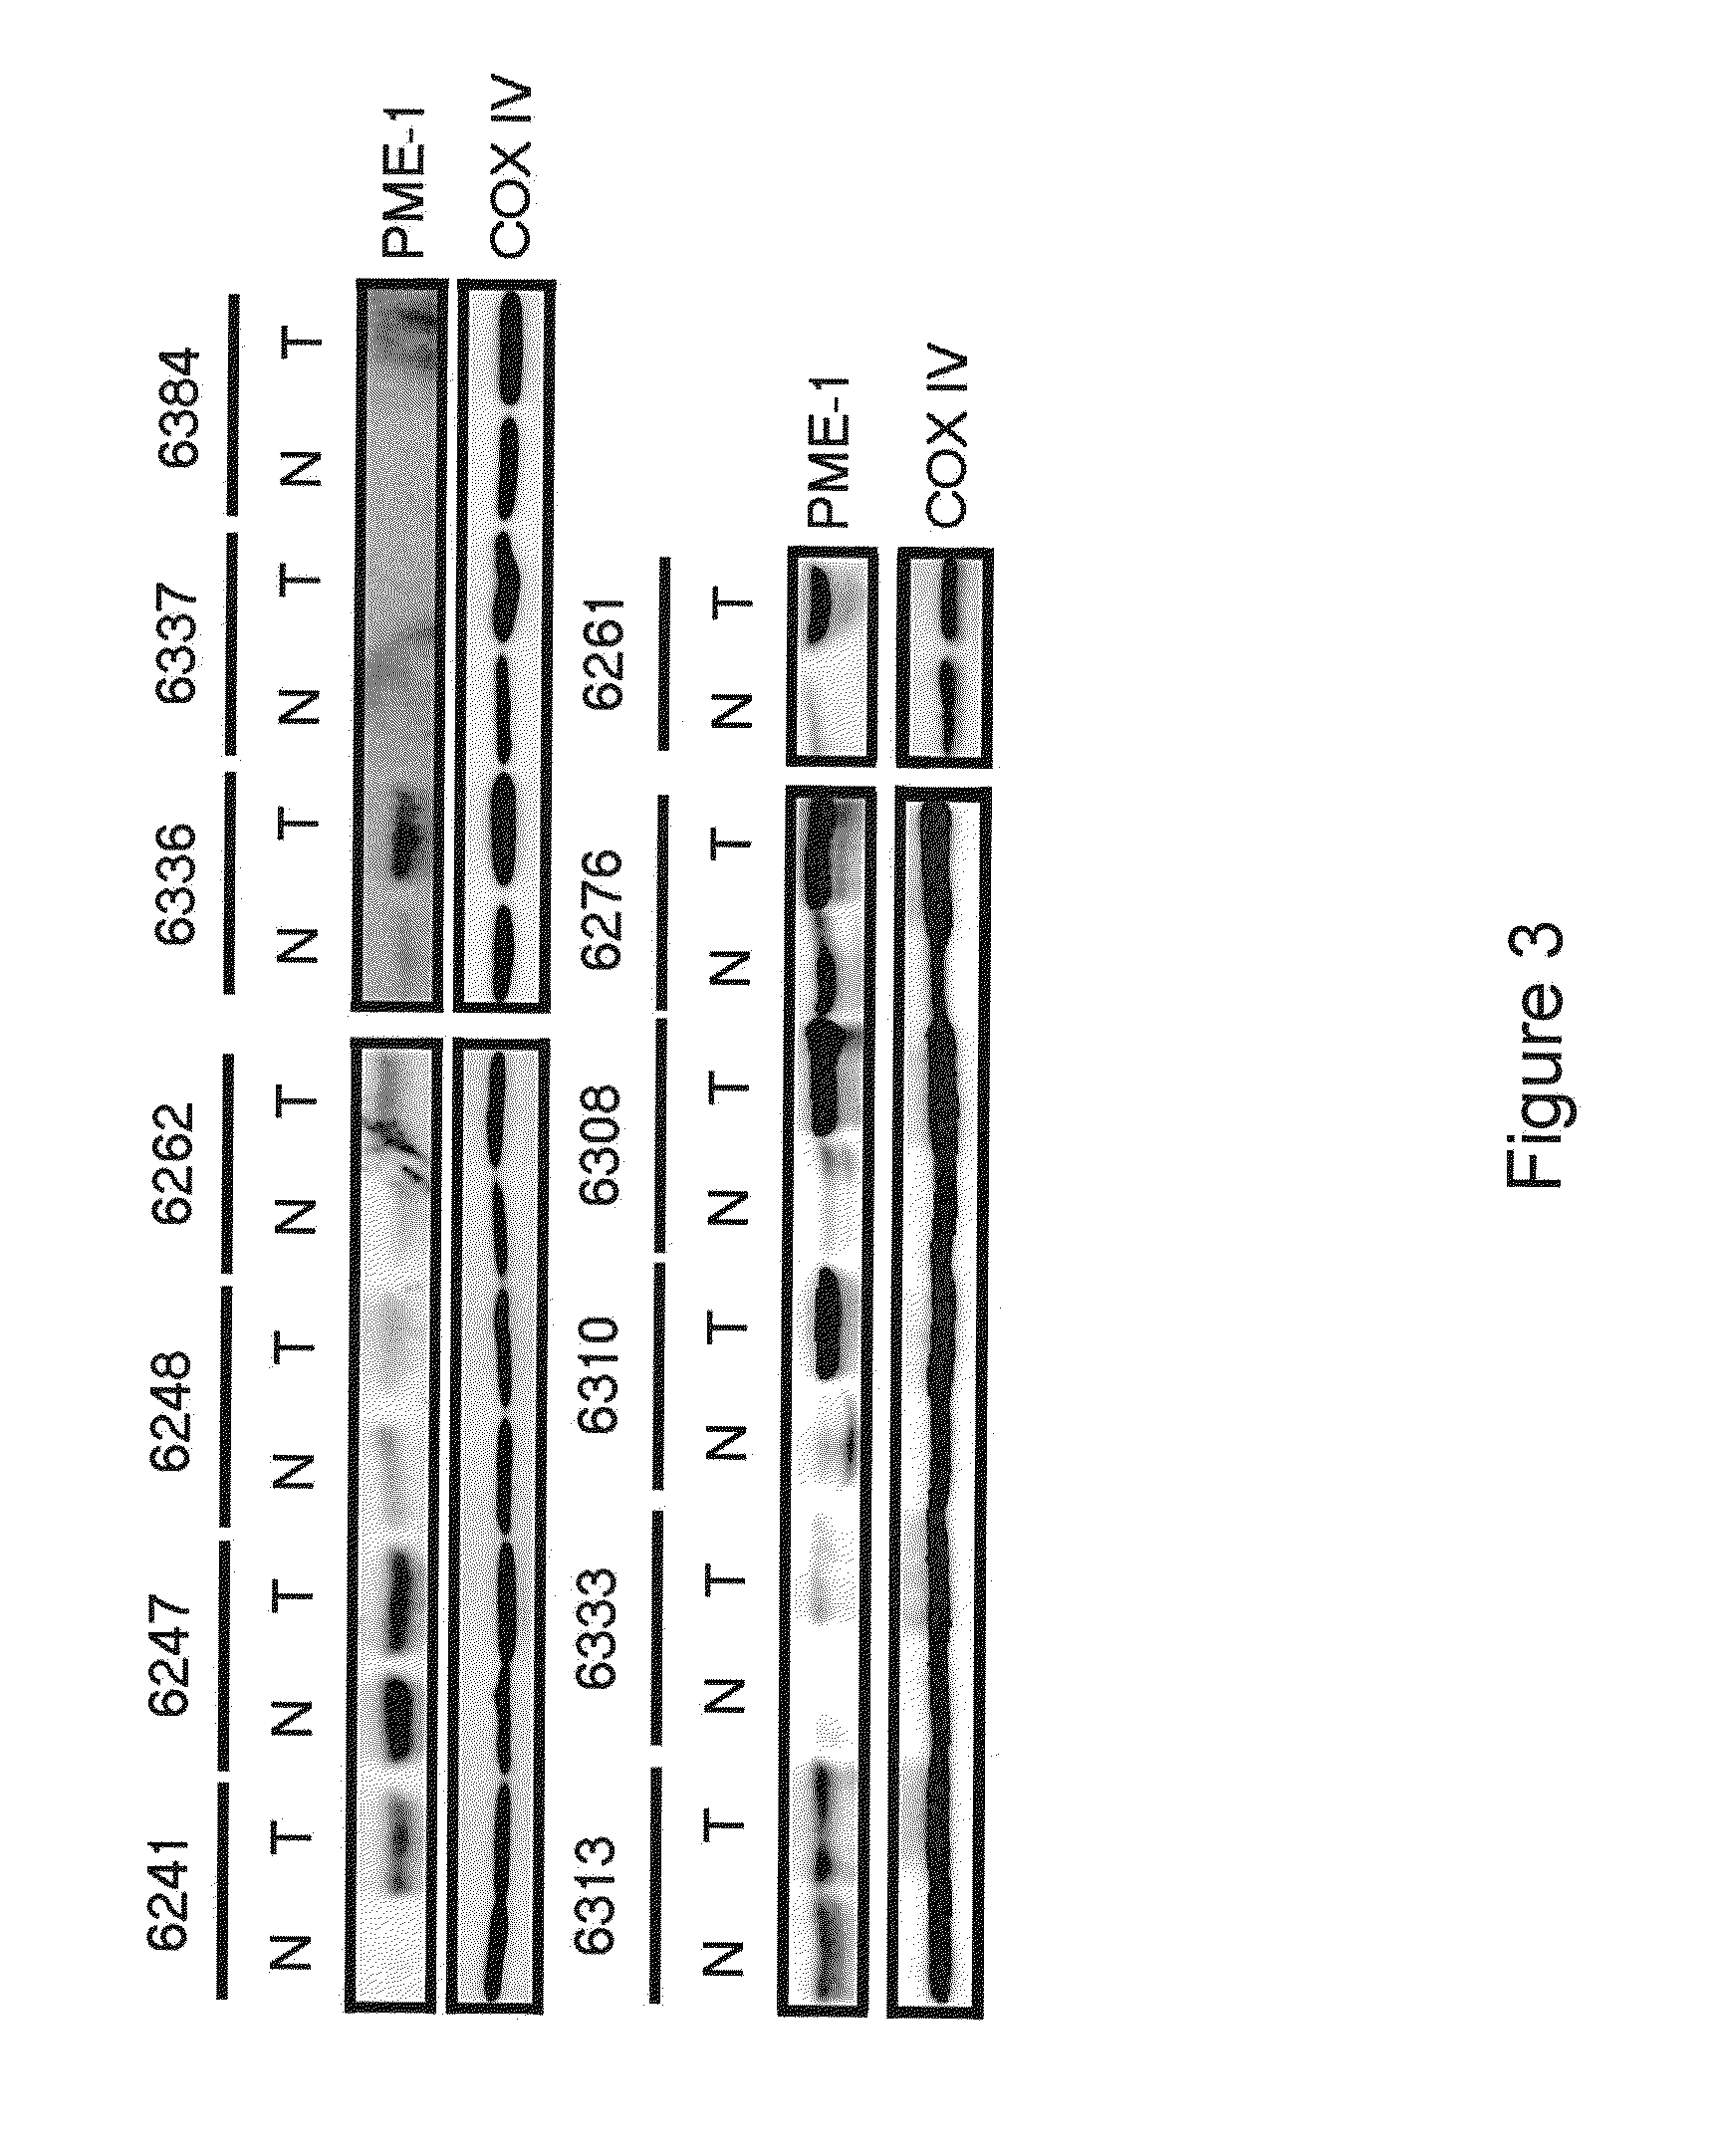
[0264]We obtained 30 matched pairs of tissue samples harvested from patients with endometrial adenocarcinoma. The details of the relevant patient data are provided in Table 1. We used Western Blot analysis to monitor the expression of PME-1 protein levels in these tissue samples from patients (FIG. 3).
[0265]Representative Western blots are displayed for several stage I EC patient samples. All stage II and stage III tissue samples purchased are also shown in FIG. 3. The top left panel shows stage IB patient samples (patient #6241, 6247, 6248, 6262) except for #6262, which is a grade 1 tumor. The top right panel shows three ...
example 3
Immunohistochemistry Analysis
[0269]We confirmed the PME-1 protein expression data by evaluating the immunohistochemistry of the tissue samples from EC patients. This immunohistochemistry study provides the basis for our observation of an increased PME-1 expression level in the context of tissue morphology.
[0270]We performed H&E staining on the tissue samples (FIG. 5i-iv) and co-stained tissue samples with anti-PME-1 antibodies (FIG. 5v-viii). Normal tissue showed regular gland formation in the endometrium with light PME-1 expression around glands within epithelial cells, as illustrated by the black arrows (FIG. 5i, v). In stage I EC, glands became irregular and PME-1 localization becomes more punctated and localized, as illustrated by the black arrows (FIG. 5ii, vi). Stage II EC was even less organized with increased PME-1 staining and more foci, as illustrated by the black arrows (FIG. 5iii, vii).
[0271]In stage III EC, PME-1 staining was darker and appeared to be limited to individ...
PUM
 Abstract
Description
Claims
Application Information
 - R&D
- Intellectual Property
- Life Sciences
- Materials
- Tech Scout
- Unparalleled Data Quality
- Higher Quality Content
- 60% Fewer Hallucinations
Browse by: Latest US Patents, China's latest patents, Technical Efficacy Thesaurus, Application Domain, Technology Topic, Popular Technical Reports.
© 2025 PatSnap. All rights reserved.Legal|Privacy policy|Modern Slavery Act Transparency Statement|Sitemap|About US| Contact US: help@patsnap.com


