
Flow rate determination method and apparatus

a flow rate and flow direction technology, applied in the direction of direct flow property measurement, measurement devices, instruments, etc., can solve the problems of inconvenient flow rate measurement, insensitive hot-wire method to the flow direction of fluid in the pipeline, and high cost of flow rate measurement errors

Inactive Publication Date: 2014-07-17
UNIVERSITY OF CANTERBURY
View PDF1 Cites 25 Cited by
  • Summary
  • Abstract
  • Description
  • Claims
  • Application Information

AI Technical Summary

Benefits of technology

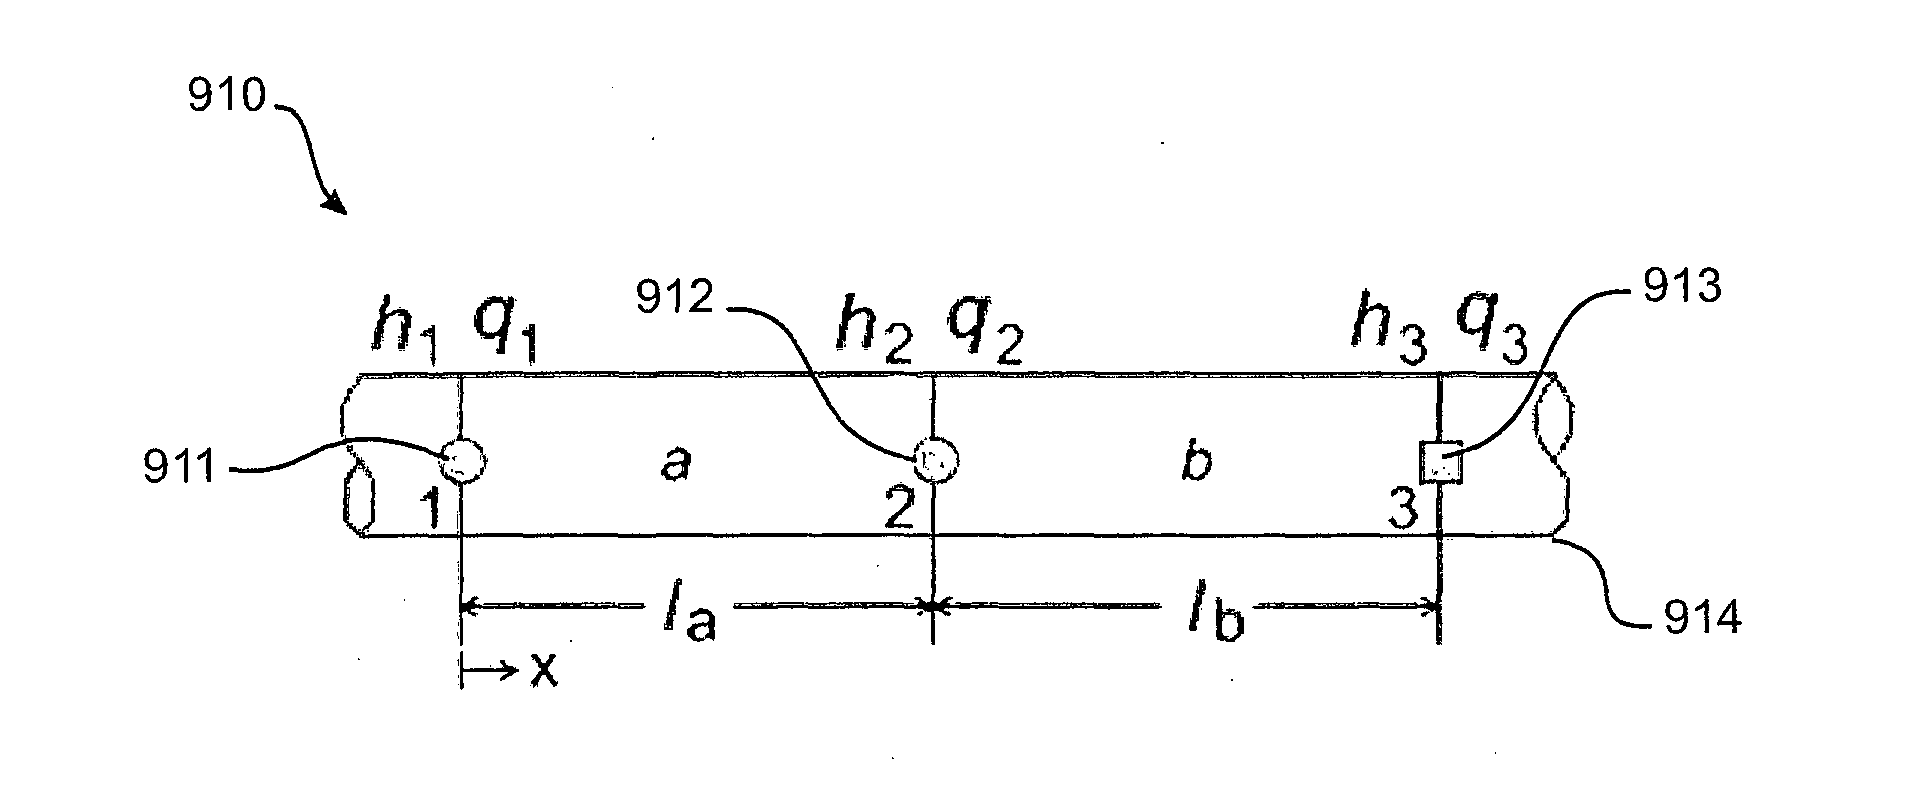
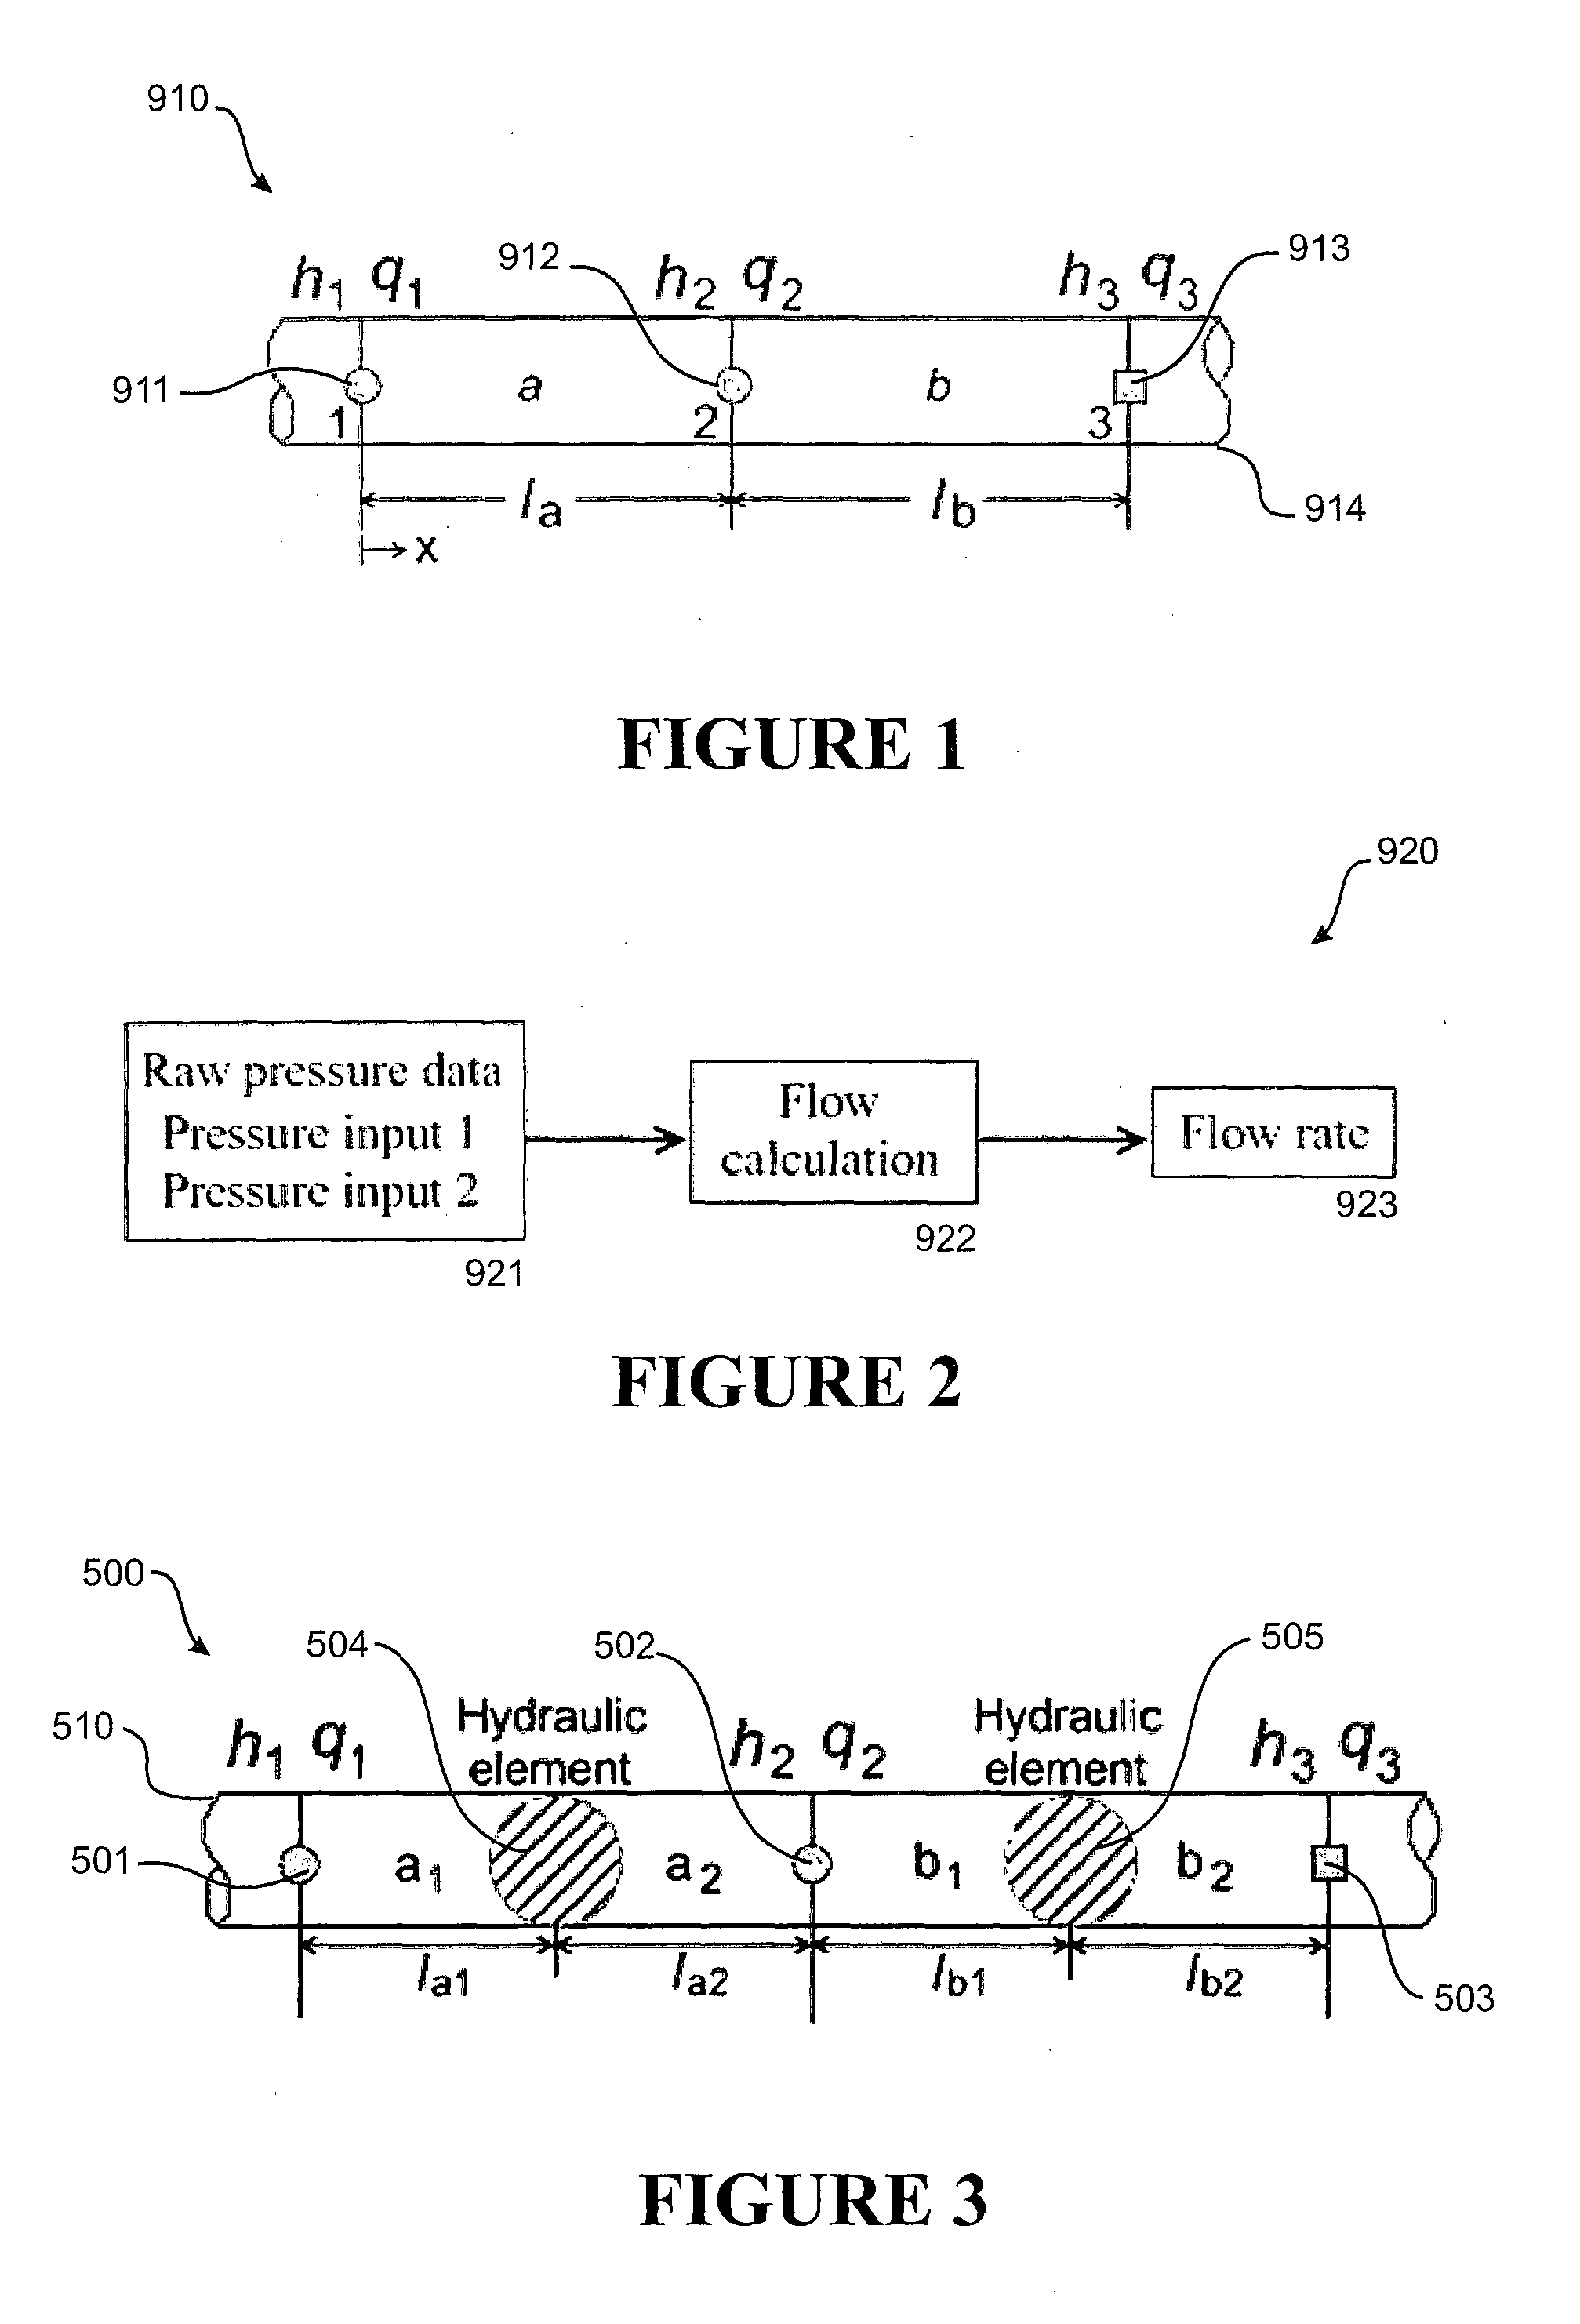
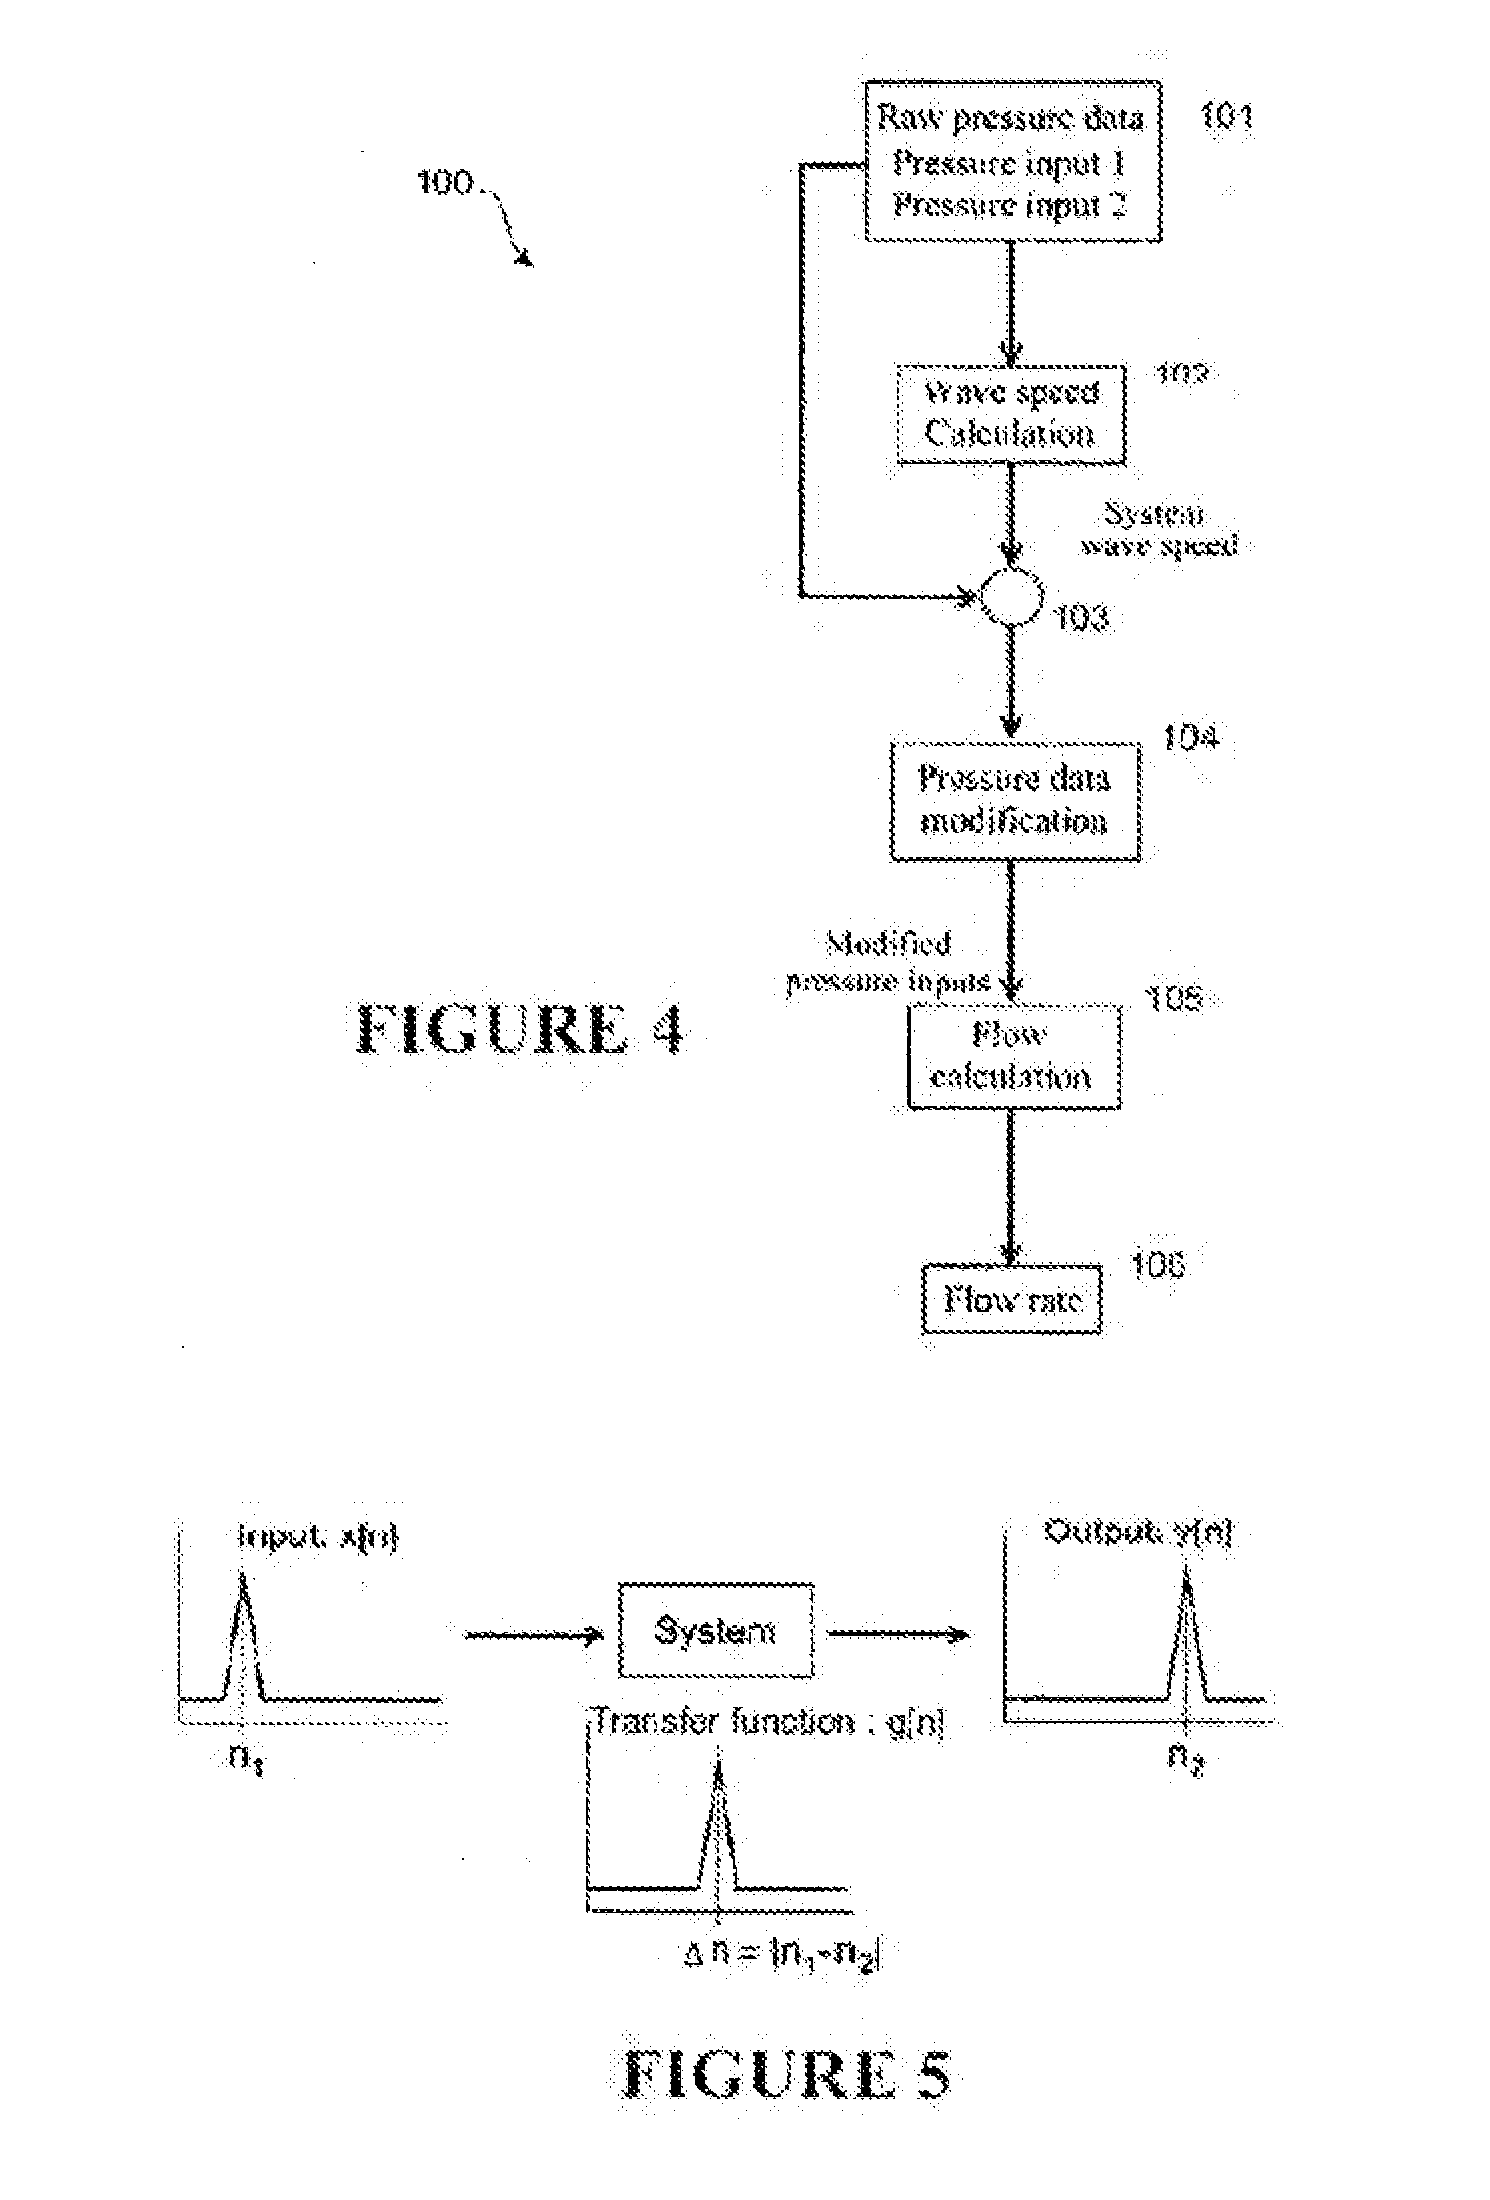
The present invention provides a method for determining the flow rate of fluid in a pipe by measuring pressure at two locations in the pipe and using the measured pressure to determine the wave speed of the fluid. This wave speed is then used to determine the flow regime of the fluid, which can be laminar or turbulent. The flow rate of the fluid is determined based on the wave speed and the resistance term associated with the flow regime. The method can be used to adjust the flow rate of the fluid if needed. The invention provides a more accurate method for determining the flow rate of fluid in a pipe compared to previous methods.

Problems solved by technology

In the oil and gas industry where fluids are sold from one party to another, the costs associated with flow rate measurement errors can be significant as the quantity of transferred fluid may be inconsistent with the demand, or as the cost per unit volume of the fluid increases.
Most existing devices / methods for measuring flow rate are only capable of determining a time-averaged flow rate.
The hot-wire method is insensitive to the flow direction of fluid in the pipeline and is intrusive.
Further, the hot-wire method requires costly maintenance and is not suited for field use.
Electromagnetic flow meters do obstruct the flow path of the fluid.
However, this method is intrusive as the electromagnetic flow meters need to be inserted at the pointer flow measurement within the pipeline system.
Additionally, the size of the meter increases with the pipe size.
Further, since Faraday's law of induction only applies to conductive fluids, the electromagnetic flow meters are limited by the conductivities of working fluids.
However, gasoline which has a conductivity of 10 9μS / cm cannot be measured by electromagnetic flow meters (Doebelin, E. O. (1990) “Measurement systems: application and design”, McGraw-Hill).
The drawbacks of this technique are the high costs associated with the apparatus, and the requirement for reflecting particles in the fluid as well as a transparent pipe section for beam transmission.
At least these drawbacks mean that LDVs are not suited to field use.
However, this parameter is extremely sensitive to the presence of air inside pipelines and can affect the accuracy of flow rate estimations.
The implication of this requirement is that as the spacing between transducers increases, the time lag between the two pressure measurements increases, causing a difference in the pressure traces between the two transducers.
The use of the Washio model in such arrangements leads to large errors in flow rate estimations.
Not compensating for the different flow regimes in the model can lead to significant errors in the flow rate measurement.
The Washio model is limited to situations where a perfect stretch of pipe exists between the pressure transducers and the discharge prediction point.

Method used


Image

  • Flow rate determination method and apparatus
  • Flow rate determination method and apparatus
  • Flow rate determination method and apparatus

Examples


experiment 1

[0444]The method of the present invention is verified using a pipeline system shown in FIG. 11. The system consists of a pipeline of length L which is bounded by constant head reservoirs. The system contains a signal generator at the middle of the system. Pressure is recorded at two points h1 and h2 which are separated by the dimensionless distance of 0.1. The frequency of the pressure measurement is 500 Hz. In all tests, the theoretical wave speed is 1000 m / s.

[0445]The measured pressure from the transducer at h2 closer to the generator g is regarded as the input x[n] and the other measured pressure from the transducer at h1 is considered as the output y[n] from the system which, in this case, is the pipe section between the two pressure measurement points.

[0446]Both continuous and discrete signals were used to test the algorithm. The size of both signals was 10% of the steady flow rate. The transfer function of the system was determined using these signals and it is presented in FI...

experiment 2

[0456]In a second experiment, the experimental verification of the method of the present invention is carried out on a pipeline system similar to the system described above with reference to FIG. 11. The system consists of a stainless steel pipeline having 41.6 m length and a diameter of 22.25 mm. The pipe is bounded by pressurised tanks that are part filled with water and where the pressures within each tank are maintained through the injection of compressed air. The pressure in the tanks is adjusted to create laminar and turbulent flow conditions. The inline valve at the downstream end of the system is closed to establish a static steady state condition.

[0457]Controlled flow perturbations for the validation of the method are introduced using two hydraulic devices; an electronically controlled solenoid valve and a manually operated side discharge valve which are located 8.5 m from the downstream reservoir. The solenoid valve has a flow diameter of 1.6 mm and the side discharge valv...

experiment 2a

State Flow Condition

[0462]Under the static steady state condition, four different pulse sizes were used: Size 1=1.4×10⁻⁵ l m3 / s, Size 2=1.5×10⁻⁵ m3 / s, Size 3=1.9×10⁻⁵ m3 / s, and Size 4=2.4×10⁻⁵ m3 / s. These flow rates are average flow rates out of the solenoid valve which are estimated from the measured discharge volume and the pulse duration. The choice of the pulse site is governed by the limitations of the solenoid valve.

[0463]The errors are summarised in Table 2. The results show that the average error across all pulse sizes is in the order of 0.1%. The method captures the maximum flow rate well but the error in the pulse profile was relatively large for all pulse sizes. The largest error in these tests was 2.0% for the biggest pulse size and the errors were found to generally increase with the pulse magnitude.

TABLE 2Summary of percentage errors in the flow predictions of different flowpulse magnitudesPulse sizeEVolumeEMaxEProfileSize 13.78 × 10−33.37 × 10−38.14 × 10⁻³Size 28.10 ×...


PUM


Abstract

A method 100 of determining a flow rate of a fluid flowing in a pipe. The method 100 includes measuring a pressure of fluid at at least two locations in the pipe 101, the pressure being measured by sensors that are positioned on or in the pipe. A wave speed of fluid is determined 102 based on measured pressure of fluid at a location in the pipe. The flow rate of fluid is determined 106 based on the determined wave speed and based on the measured pressures at two locations in the pipe. An apparatus for determining a flow rate of fluid flowing in a pipe is configured to perform the method 100.

Description

FIELD OF THE INVENTION[0001]The present invention relates to a method and apparatus for flow rate determination in a pipeline. Particularly, the present invention relates to a method and apparatus for flow rate determination in a pressurised pipeline.BACKGROUND OF THE INVENTION[0002]Flow rate or velocity is the speed at which the fluid travels within a pipe. The accurate measurement of flow rate in pressurised pipelines is important for a large number of industrial, engineering research and laboratory processes. In the food and beverage sector, the quality of the product depends largely on the correct measurement of each ingredient and is carefully monitored using real time flow measurements. In the oil and gas industry where fluids are sold from one party to another, the costs associated with flow rate measurement errors can be significant as the quantity of transferred fluid may be inconsistent with the demand, or as the cost per unit volume of the fluid increases. Accurate flow r...

Claims


Application Information

Patent Timeline
Patent Type & Authority Applications(United States)
IPC IPC(8): G01F1/34
CPCG01F1/34G01F1/66G01N11/04
Inventor LEE, PEDRO JOSE
Owner UNIVERSITY OF CANTERBURY
Learn More