Apparatus, System, and Method for Annotation of Media Files with Sensor Data
a sensor data and media file technology, applied in the field of multimedia capture, can solve the problems of difficult to index and search video data at the high semantic level, the difficulty of current search techniques that utilize signal-level content extraction from video, and the difficulty of scaling, so as to achieve efficient indexing and quick understanding of video visual content. the effect of visual conten
- Summary
- Abstract
- Description
- Claims
- Application Information
AI Technical Summary
Benefits of technology
Problems solved by technology
Method used
Image
Examples
implementation case study
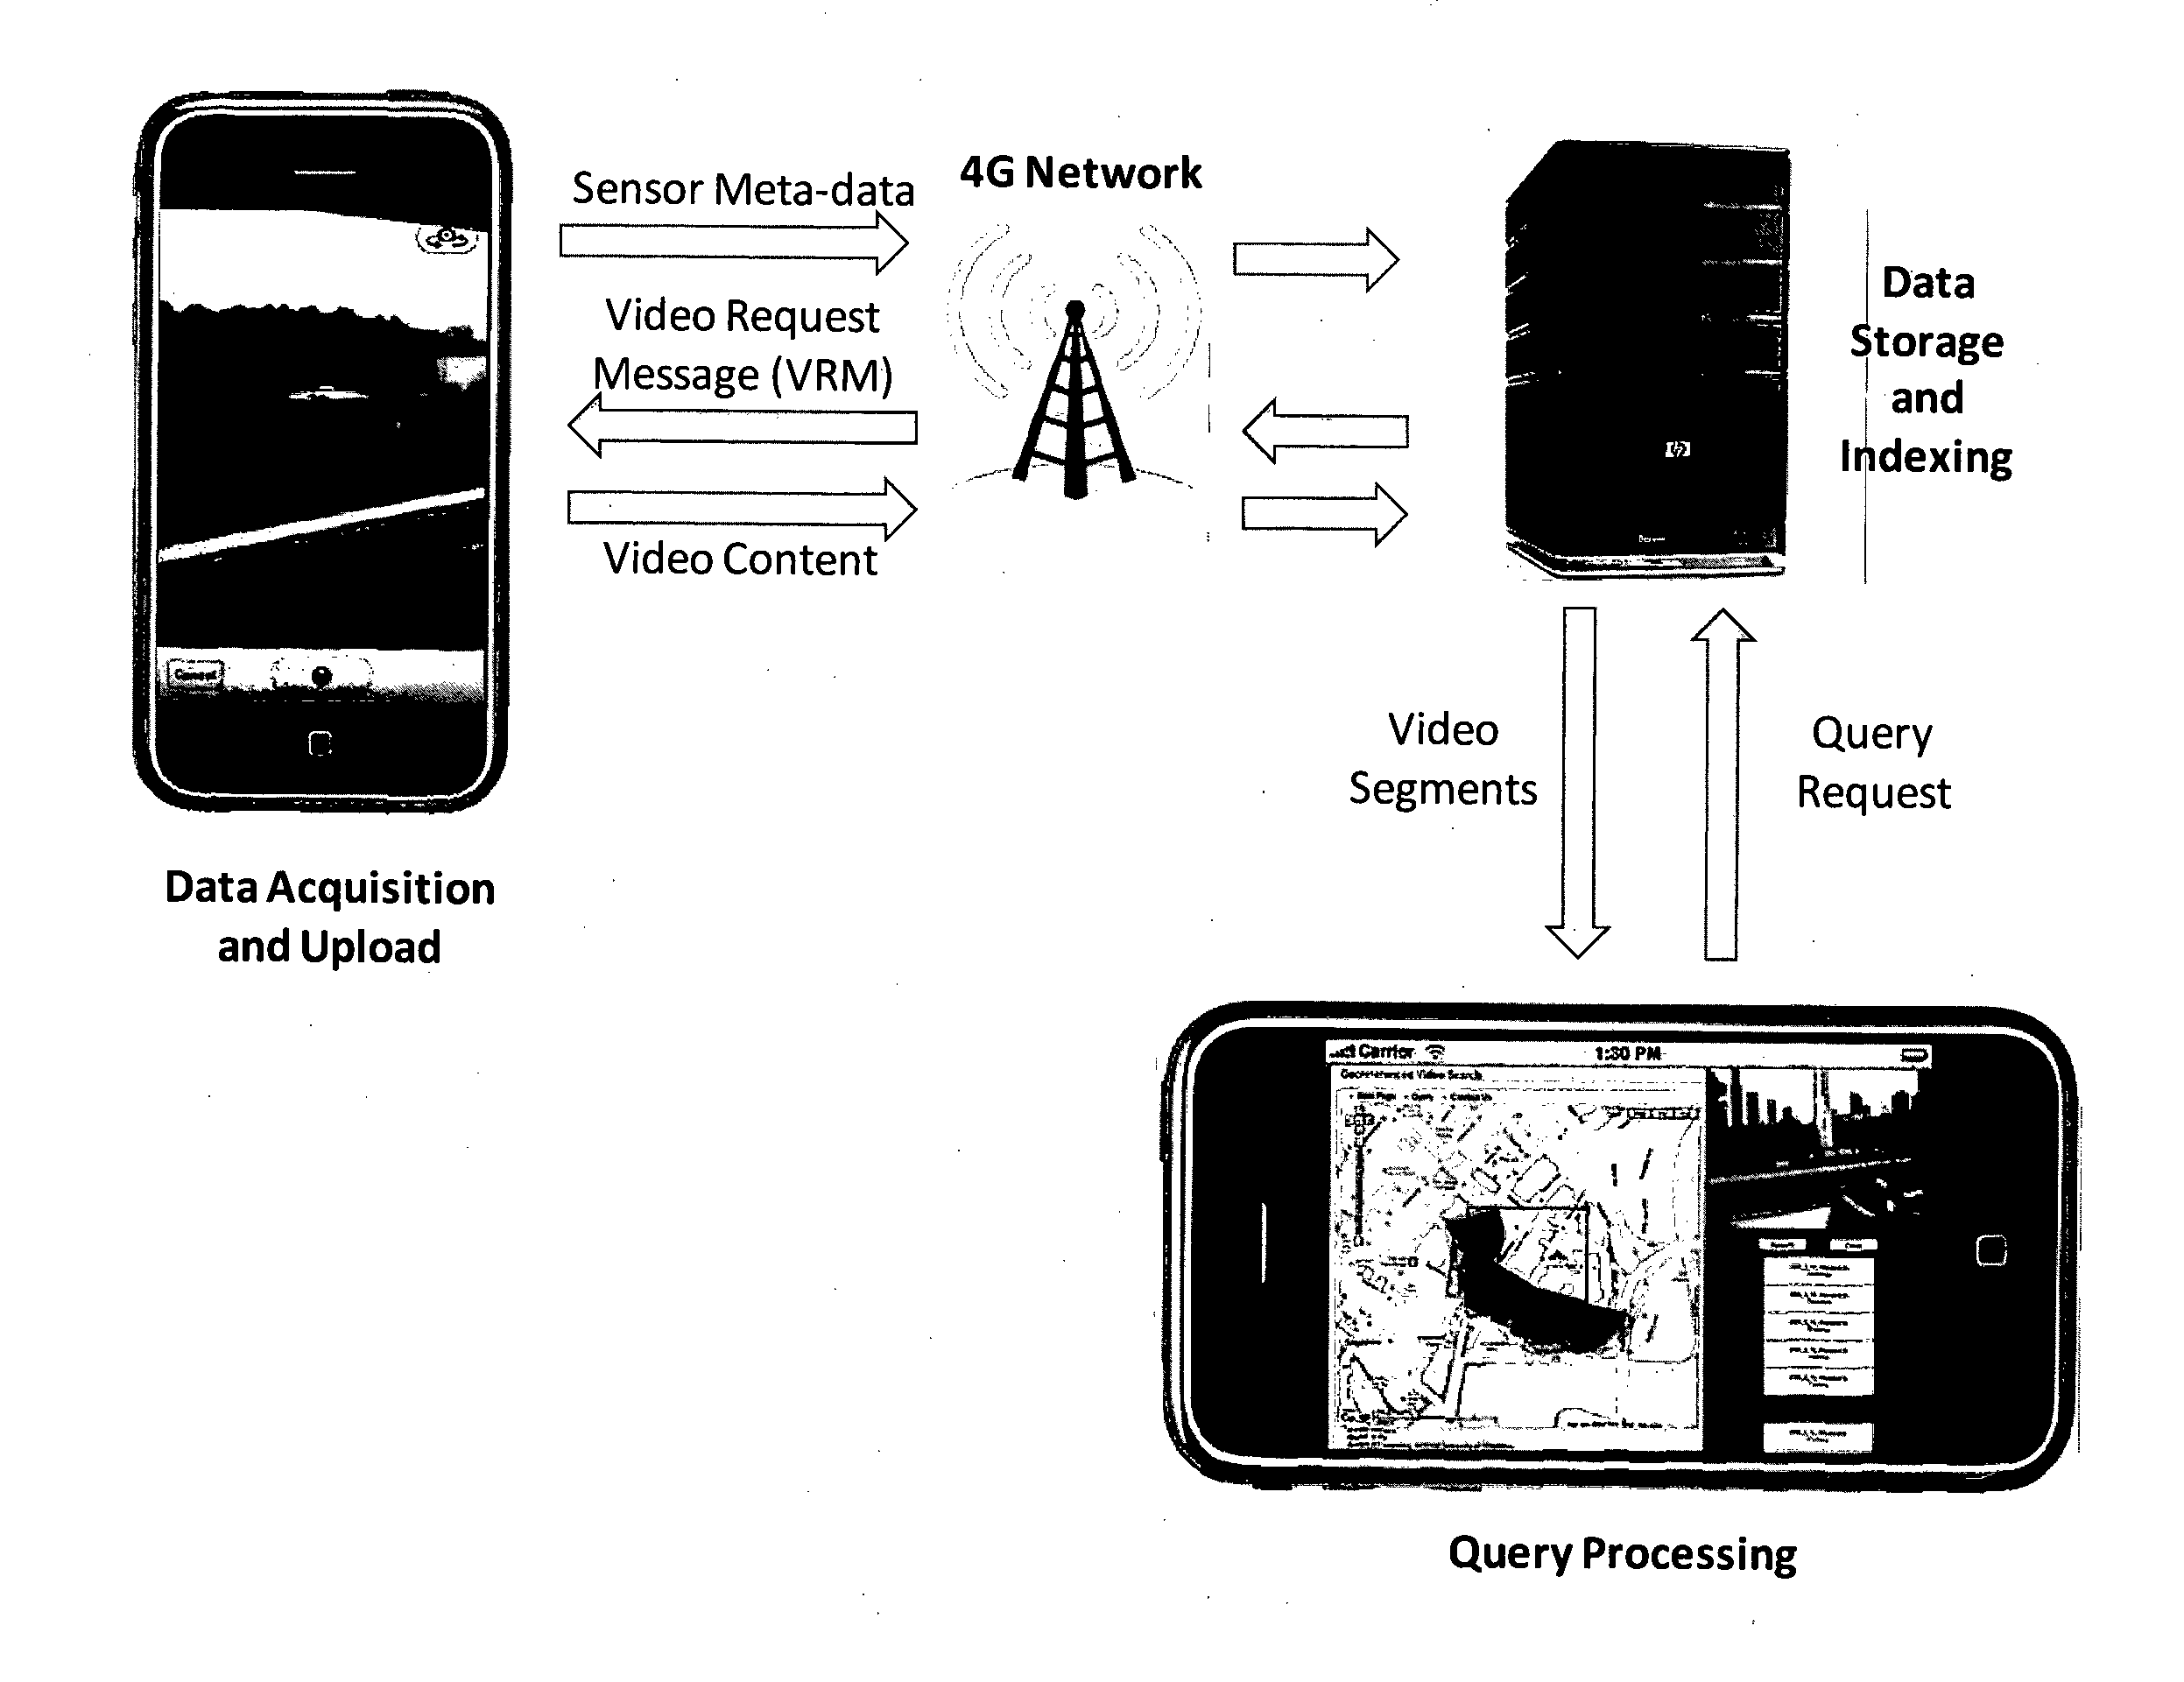
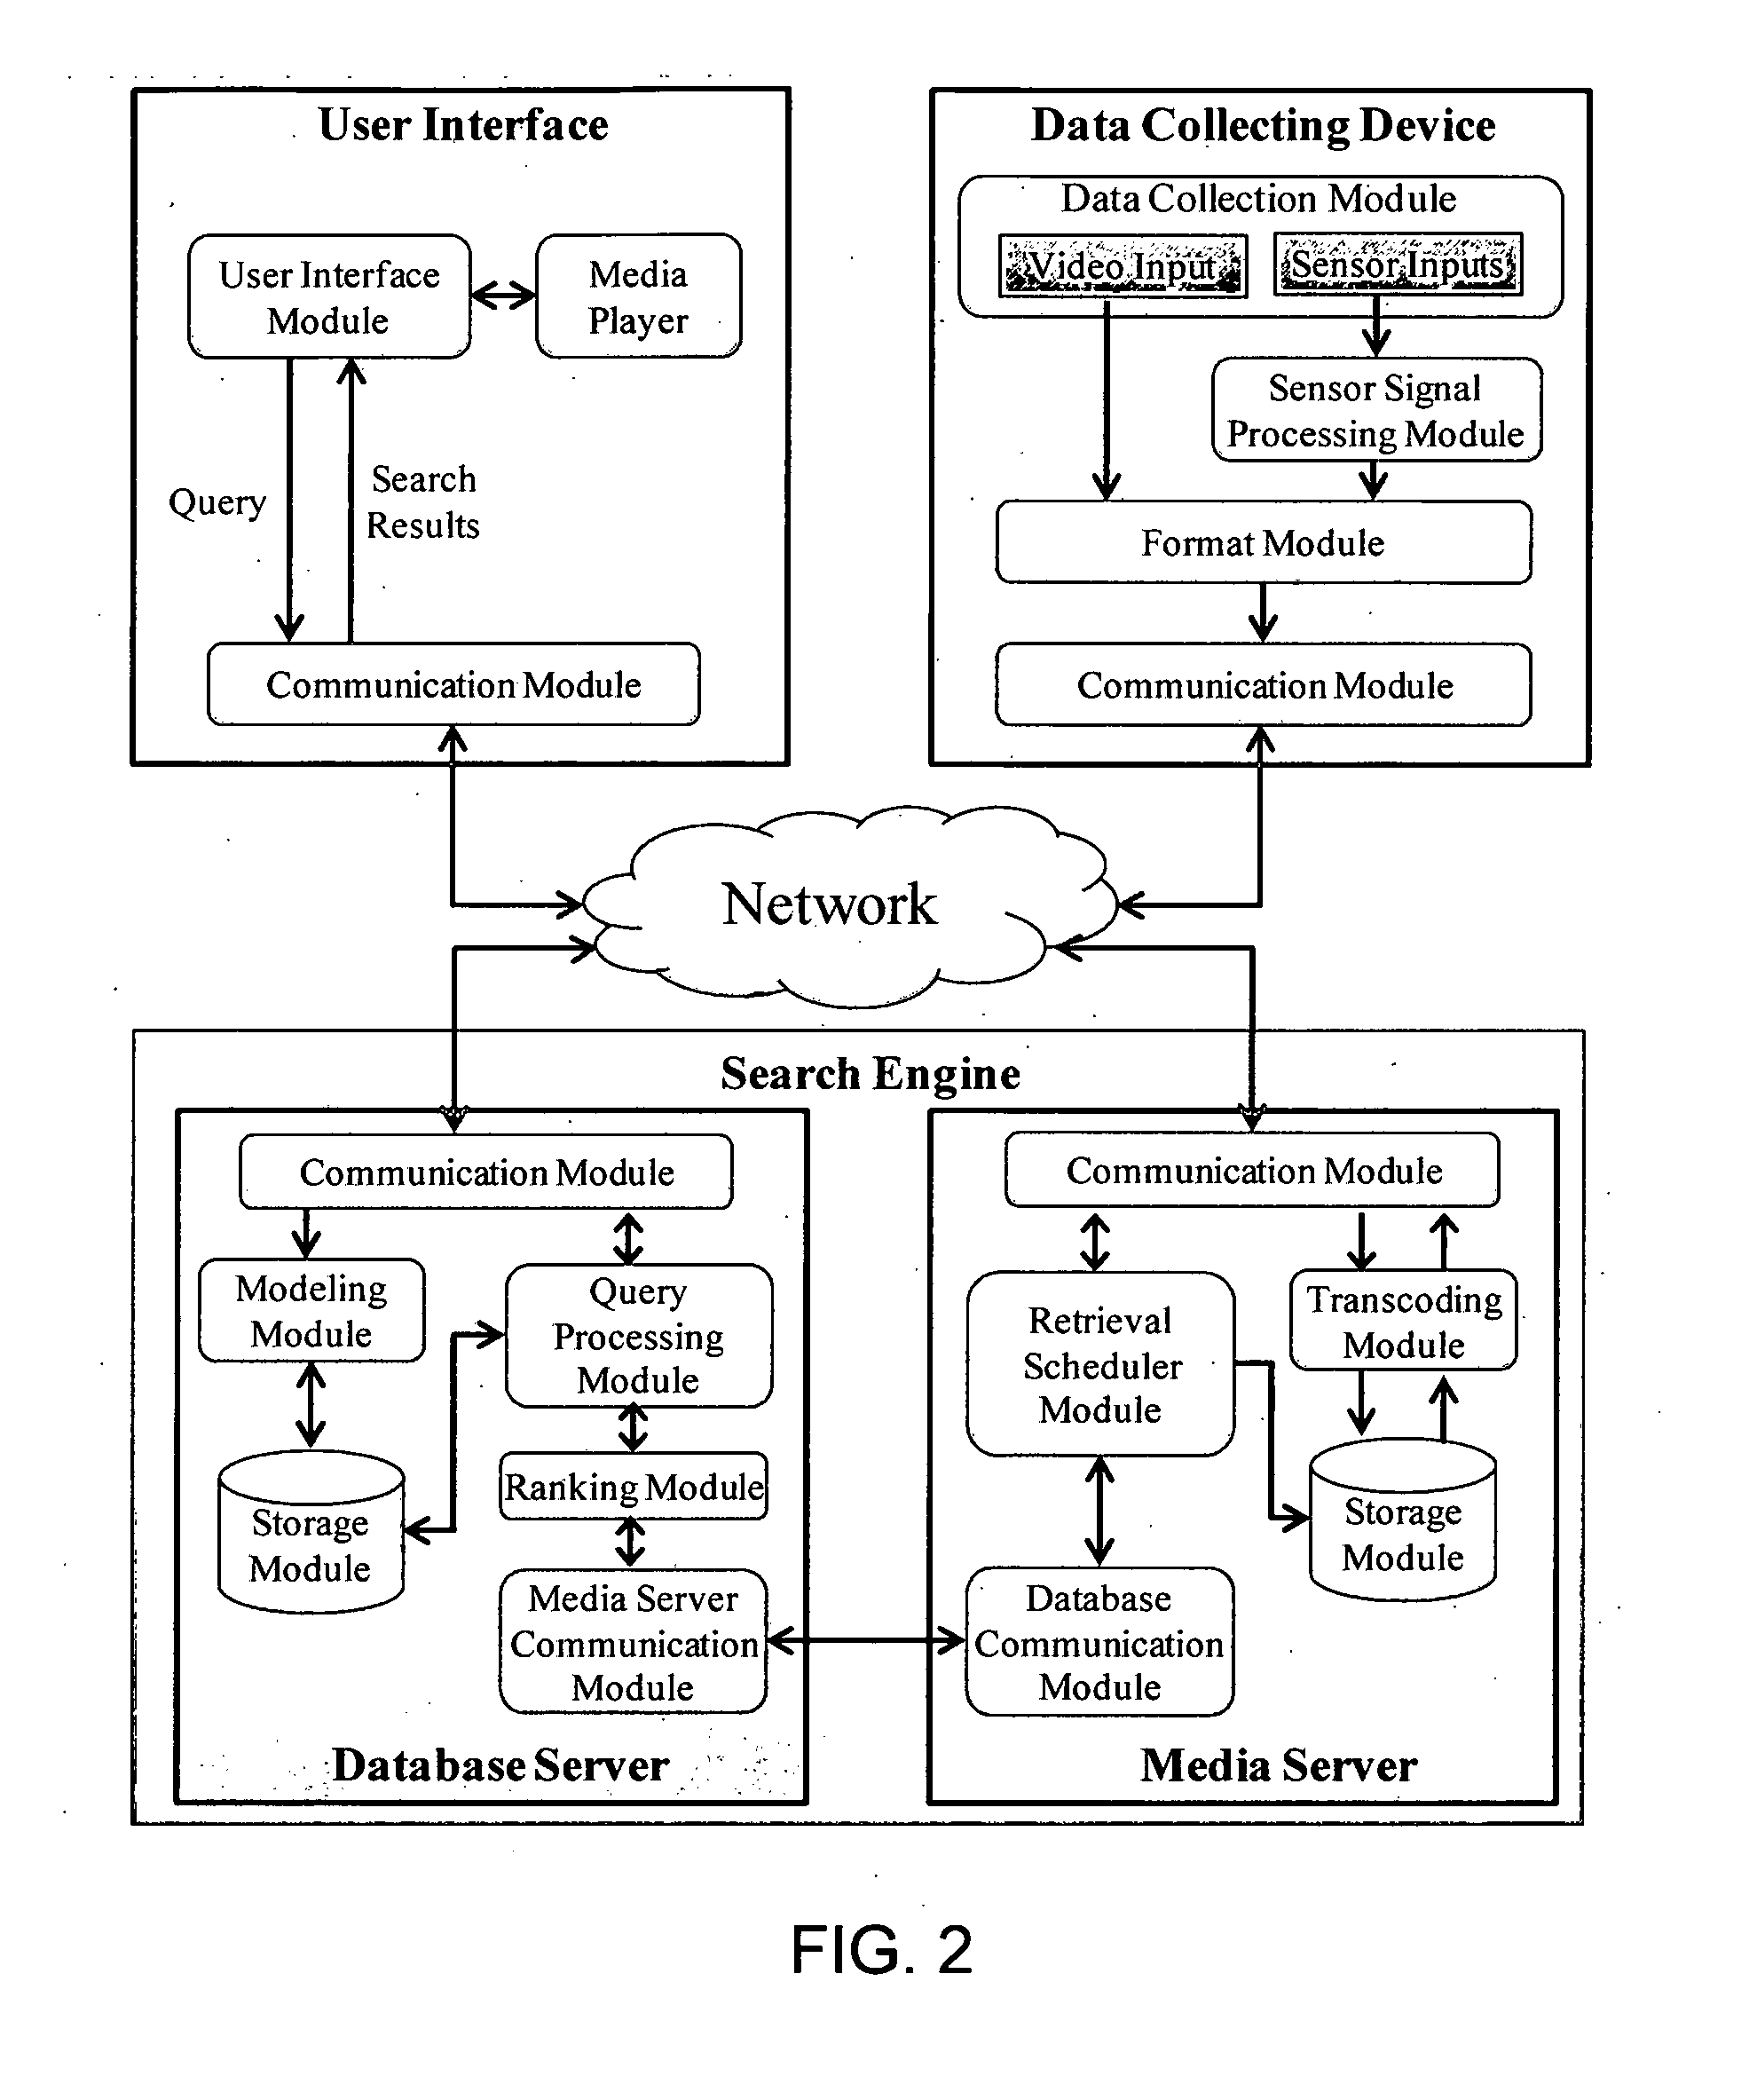
[0087]Here, the solutions of the modules in implementing the framework is introduced. Note that the present disclose is not necessarily providing optimal solutions for all modules discussed, but instead intend to provide an example solution for each critical module to demonstrate the feasibility and adequacy of the proposed sensor-rich video search framework.
[0088]Collecting Sensor Data and Modeling Viewable Scene: The implementation focuses on the geographic properties of the video contents, i.e., the exact area on the ground covered by the video scenes. To capture the geographic properties, the video recording system is prototyped with three devices: a video camera, a 3D digital compass, and a Global Positioning System (GPS). It is assumed that the optical properties of the camera are known. The digital compass mounted on the camera heads straight forward as the camera lens. The compass periodically reports the direction in which the camera is pointing with the current heading ang...
example 1
[0122]The histogram of video clip Vk is constructed as follows:
Ohk={<c1,f1,I1>,<c2,f2,I2>,<c3,f3,I3>}={<(2,3),3,{<2,8>,10,7>,<20,5>}>,<(3,3),1,{<10,7>}>,<(4,3),1,{<10,7>}>}.
This histogram consists of three grid cells c1, c2, and c3 appearing 3, 1, and 1 times in VkG, respectively. c1 appears in three video segments. One starts at 2 and lasts for 8 seconds. Another at 10 for 7 seconds. The other starts at 20 and lasts for 5 seconds. c2 appears once starting at 10 and lasts for 7 seconds. c3 appears once starting at 10 and lasts for 7 seconds. FIG. 8 demonstrates two example histograms, where different frequency values within the histograms are visualized with varying color intensities.
[0123]The histogram-based implementation counts the number of overlaps between the s and grid cells, and therefore the histogram bins can only have integer values. Alternatively, for the histogram cells that partially overlap with the s, flo...
PUM
 Abstract
Description
Claims
Application Information
 - R&D
- Intellectual Property
- Life Sciences
- Materials
- Tech Scout
- Unparalleled Data Quality
- Higher Quality Content
- 60% Fewer Hallucinations
Browse by: Latest US Patents, China's latest patents, Technical Efficacy Thesaurus, Application Domain, Technology Topic, Popular Technical Reports.
© 2025 PatSnap. All rights reserved.Legal|Privacy policy|Modern Slavery Act Transparency Statement|Sitemap|About US| Contact US: help@patsnap.com


