
In situ-dilution method and system for measuring molecular and chemical interactions

a molecular and chemical interaction, in situ technology, applied in the direction of instruments, transportation and packaging, laboratory glassware, etc., can solve the problems of insufficient human error, time-consuming, and insufficient accuracy of analyte concentration

Inactive Publication Date: 2013-06-20
FLIR SYST INC
View PDF10 Cites 18 Cited by
  • Summary
  • Abstract
  • Description
  • Claims
  • Application Information

AI Technical Summary

Benefits of technology

The patent describes a method for diluting a fluid containing analyte. The method involves applying a second fluid containing no analyte to a third flow path, which results in further dilution of the third fluid. This can be useful in various applications where it is necessary to dilute a fluid containing analyte.

Problems solved by technology

This is time consuming and provides ample opportunity for human error.
Furthermore, in the stepped injection method, the analyte concentration is not accurately represented during the transition zones when the analyte concentration is changing.
However, this method requires the use of an external gradient maker.
Thus, a steady state analyte concentration in the sensing region cannot be obtained.
However, the pulse method relies heavily on dispersive mixing to generate the analyte concentrations.
In some cases the inventors assume approximate relationships that can be applied under particular conditions that apply to special case applications and more general application is not possible.
In sum, these prior art methods are either time consuming or fail to provide an accurate representation of the analyte concentration in the sensing regions.

Method used


Image

  • In situ-dilution method and system for measuring molecular and chemical interactions
  • In situ-dilution method and system for measuring molecular and chemical interactions
  • In situ-dilution method and system for measuring molecular and chemical interactions

Examples


example 1

Validation of the In Situ Dilution Method for Determining Association and Dissociation Constants

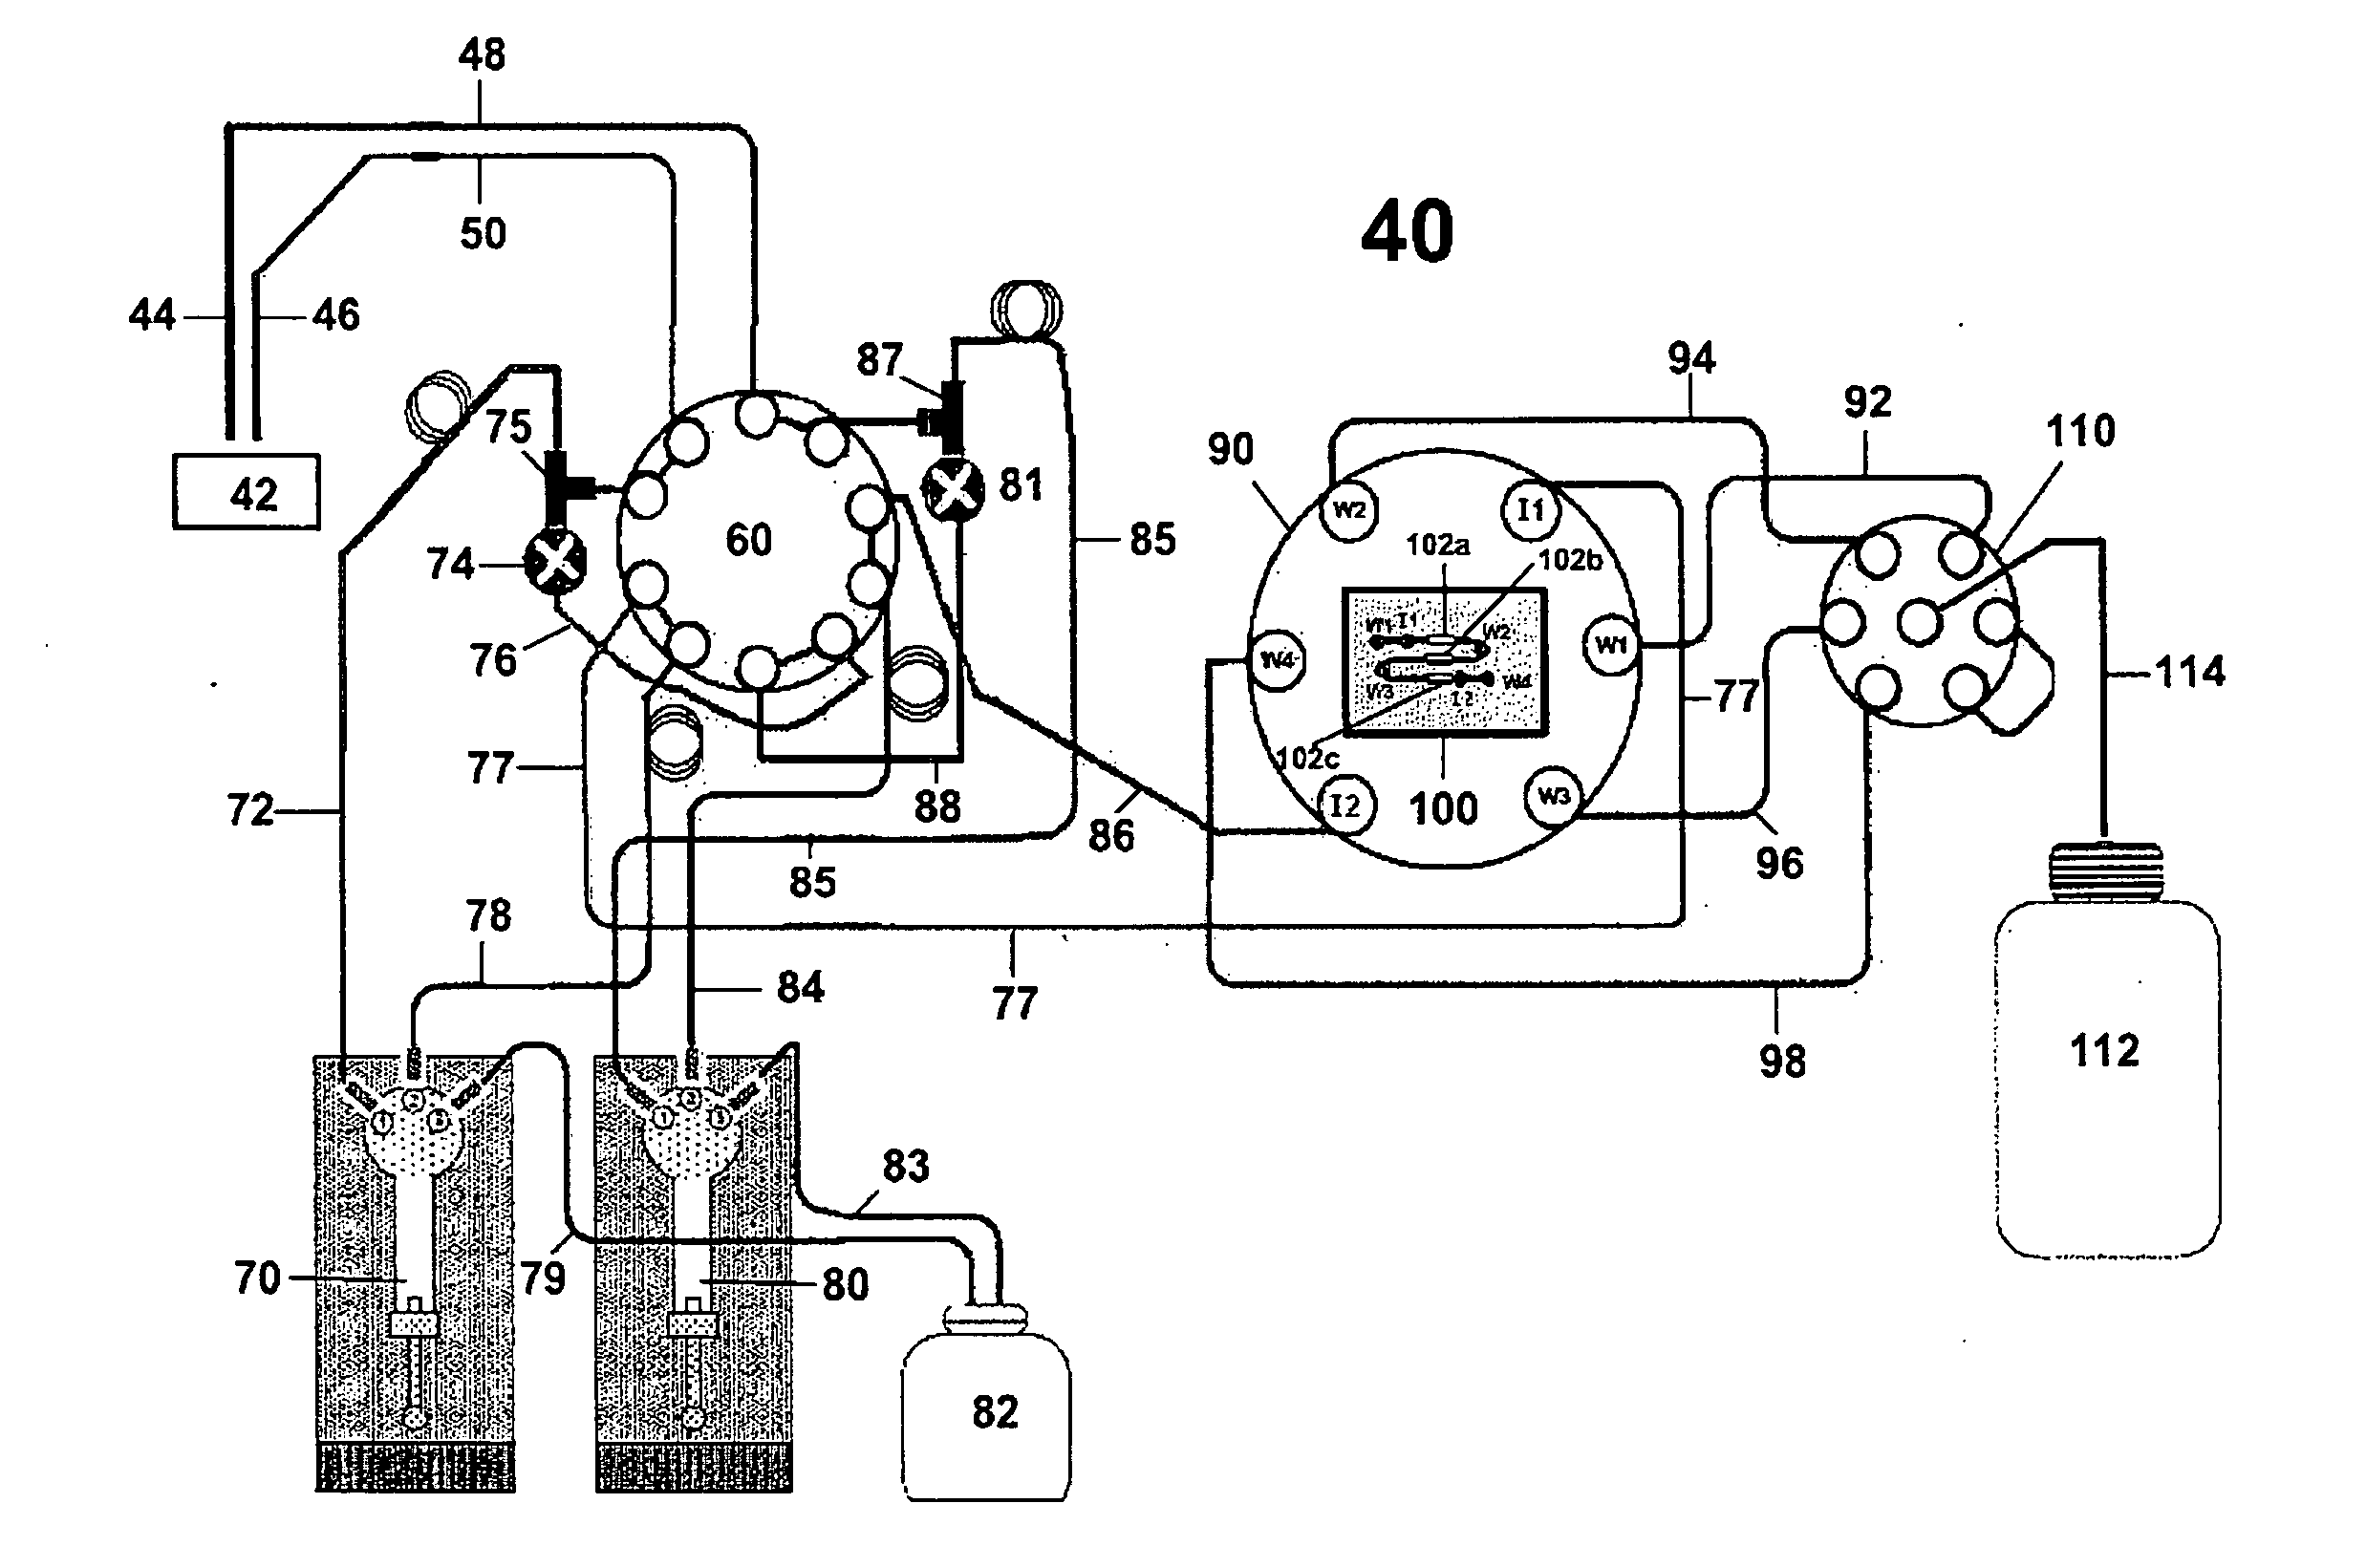
[0069]In Example 1, the kinetic values for the interaction between carboxybeneze sulfonamide and immobilized carbonic anhydrase were determined using a standard multiple injection method and the in situ dilution method described herein. In the classical approach sequential injection method (FIGS. 4A-4D) a series of individual concentrations were prepared as a serial doubling dilution set starting from a neat concentration of 40 mM giving a total of nine different concentrations. These concentrations were made up in the running buffer (i.e HEPES buffer saline, pH 7.4). 50 mL of each sample was injected at 50 mL / min and allowed dissociate for 300 seconds. Each concentration was repeated in duplicate and the entire analysis was repeated at four different analysis temperatures (10 C, 20 C, 30 C, 40 C—FIGS. 4A-D, respectively). FIG. 5 shows this analysis repeated using the in-situ dilution met...

example 2

Measuring Stepped (50 Steps) Increase in Analyte Concentrations Using the In-Situ Dilution Method

[0072]The sample in this case is water containing dimethylsulfoxide (DMSO) while the buffer pump was primed in water. The SPR based biosensor responds to the increase in refractive index as the concentration of DMSO increases. The sample pump flow rate and the buffer pump flow rate were incrementally adjusted inversely to each other while the volumetric flow rate through the flow cell was set as if to be held constant. The ideal step injection curve (linear) assuming no-air compliance and the recorded step injection bulk refractive index curve (non-linear) where a 20 μL air segment was placed within the sample injection line to cause delayed sample stream flow.

[0073]The injections described herein are preferably performed using liquid pumps with linear stepping action where the flow rate increases linearly with a linear increase in drive rate. This is the behavior expected from precision...

example 3

The Effect of Dispersion on Kinetic Analysis

[0076]As stated earlier, dispersion can give rise to unpredictable analyte concentration profiles and any error in the analyte concentration will give rise to a corresponding error in the kinetic analysis. It is therefore desirable to use flow control and mixing techniques that do not rely on dispersion. In more detail, if an analyte is injected into a tube flowing under laminar flow conditions then it will tend to mix with the analyte free liquid already present in the tube. Assuming pressure driven flow, as the analyte segment travels along the tube it will become diluted due to the combined effect of molecular diffusion “smeared out” by the parabolic convective flow profile within the tube. This is used to great advantage to produce sigmoidal shaped analyte gradient injections (such as in WO 2004 / 109295 A1 and WO2009 / 025680), but it is difficult to model the analyte concentration accurately when the dispersion volumes are low to interme...


PUM

PropertyMeasurementUnit
volumeaaaaaaaaaa
volumeaaaaaaaaaa
volumeaaaaaaaaaa

Abstract

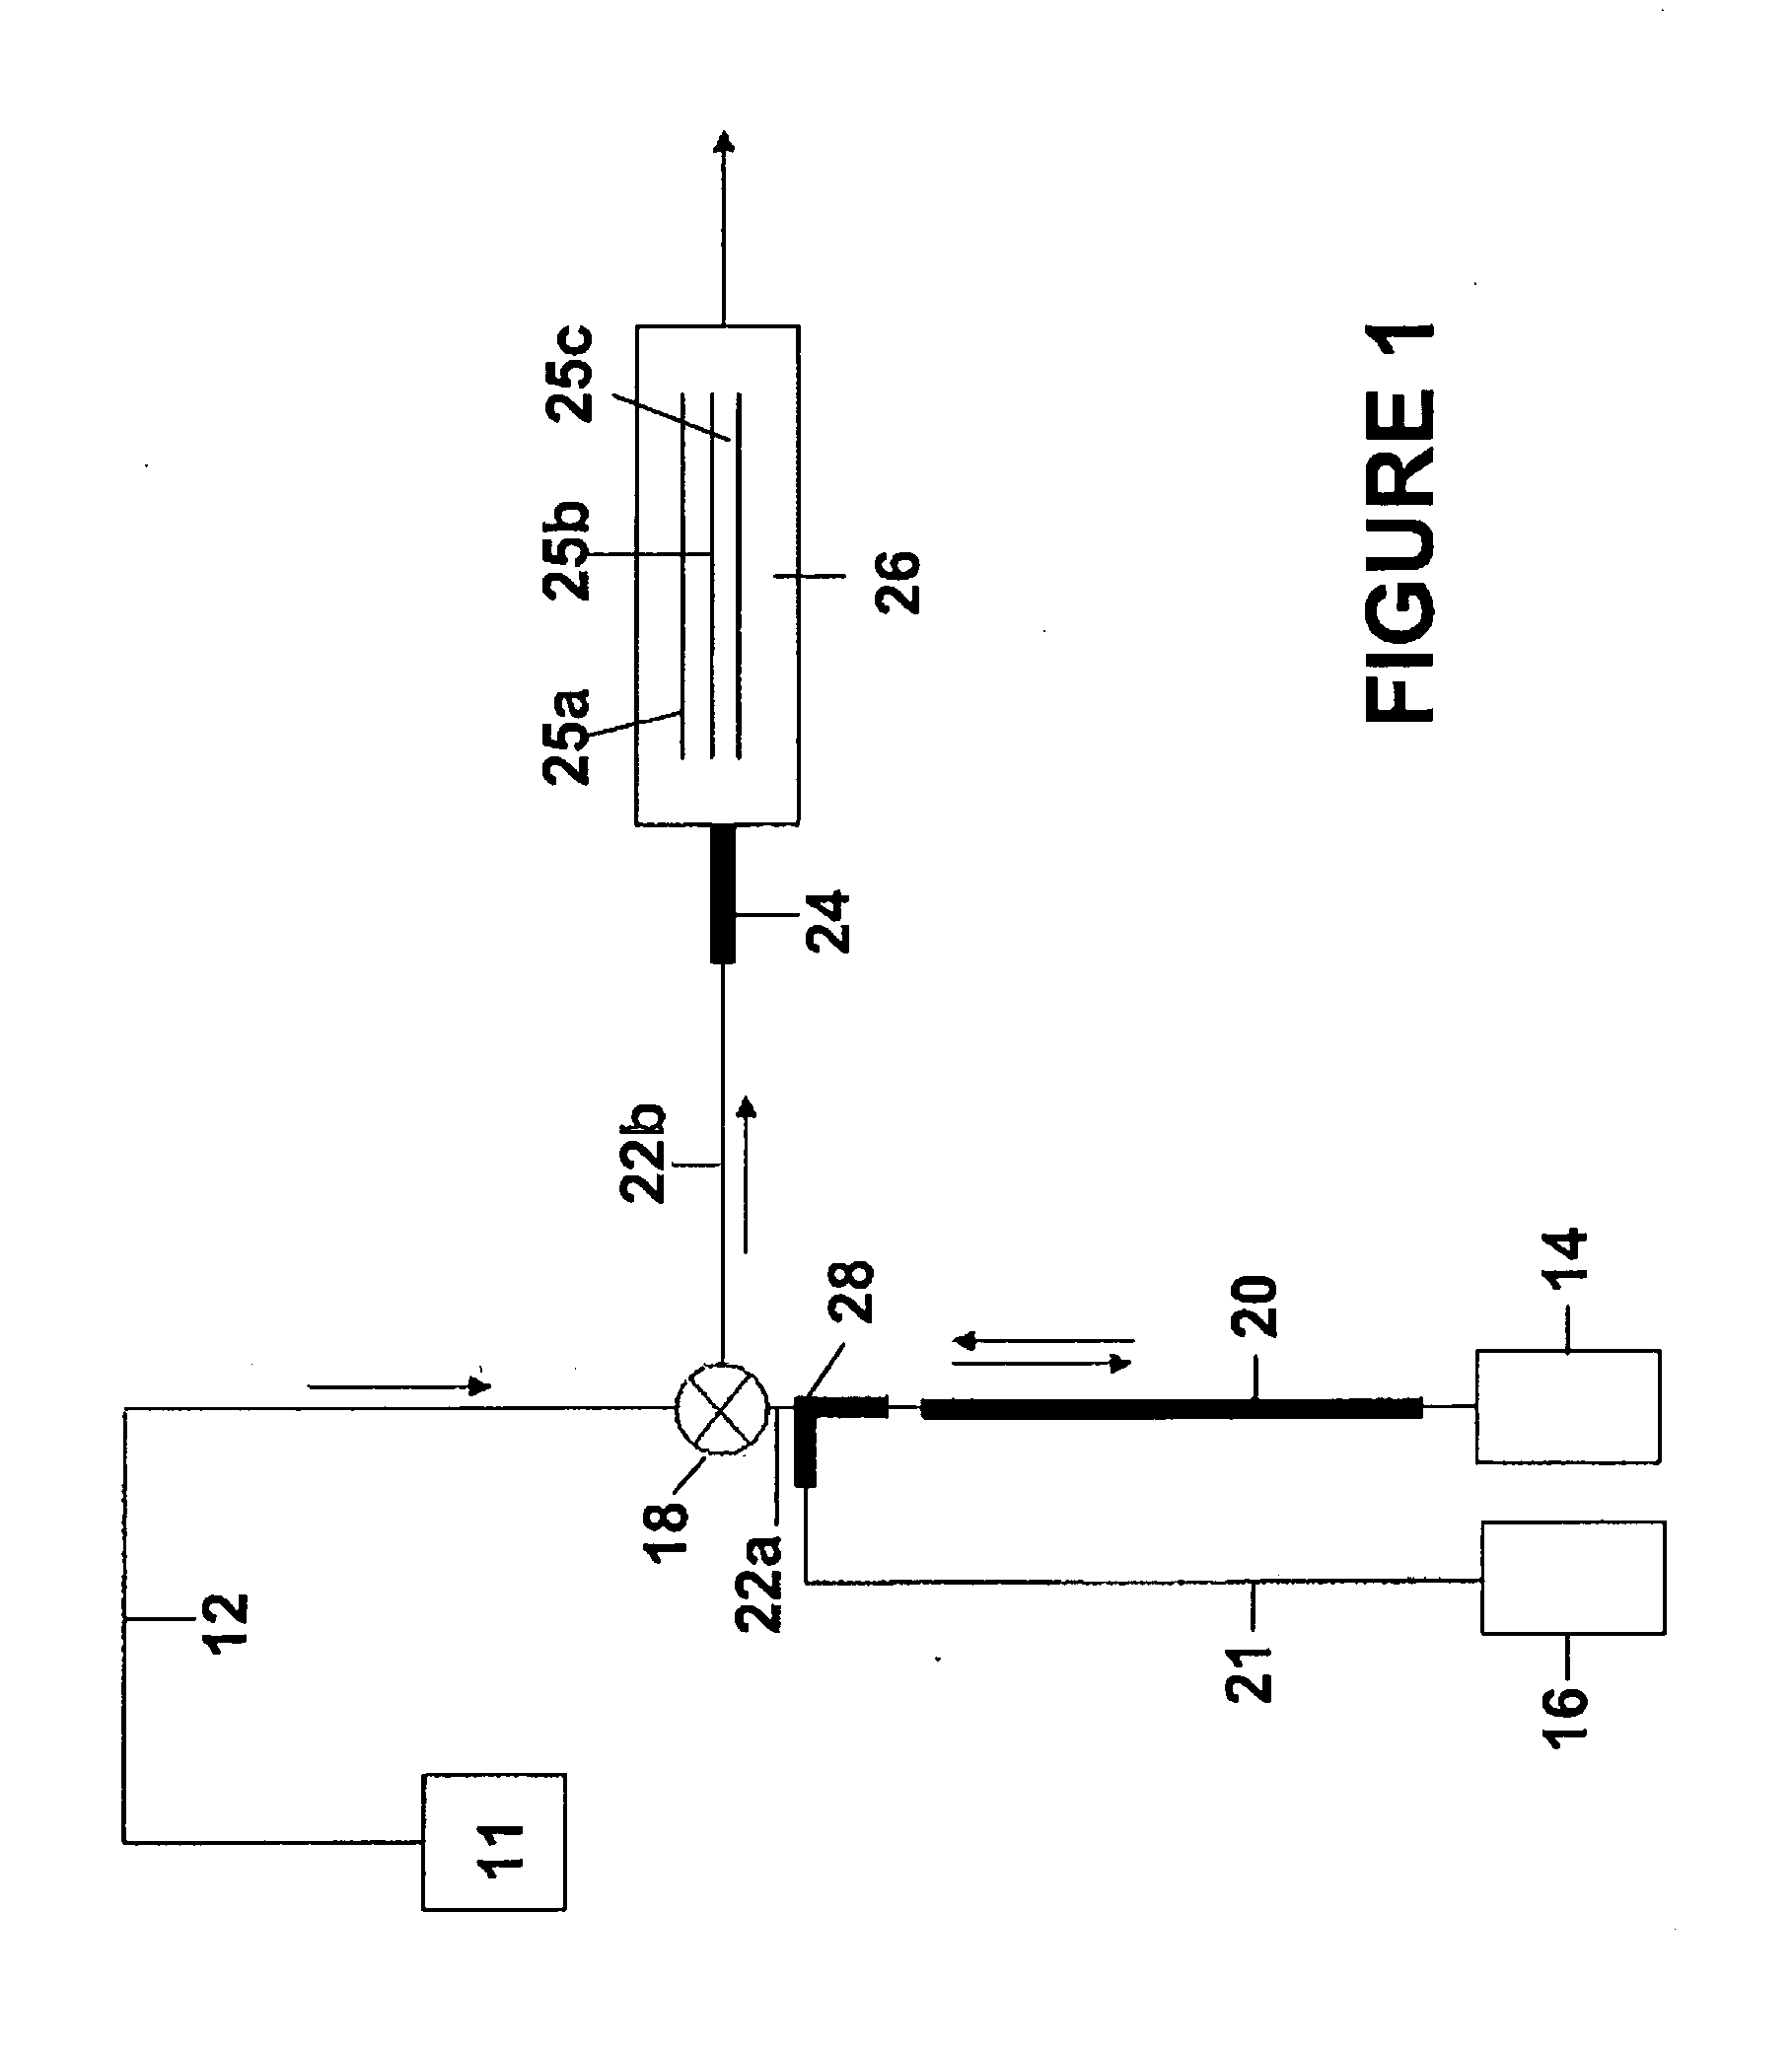
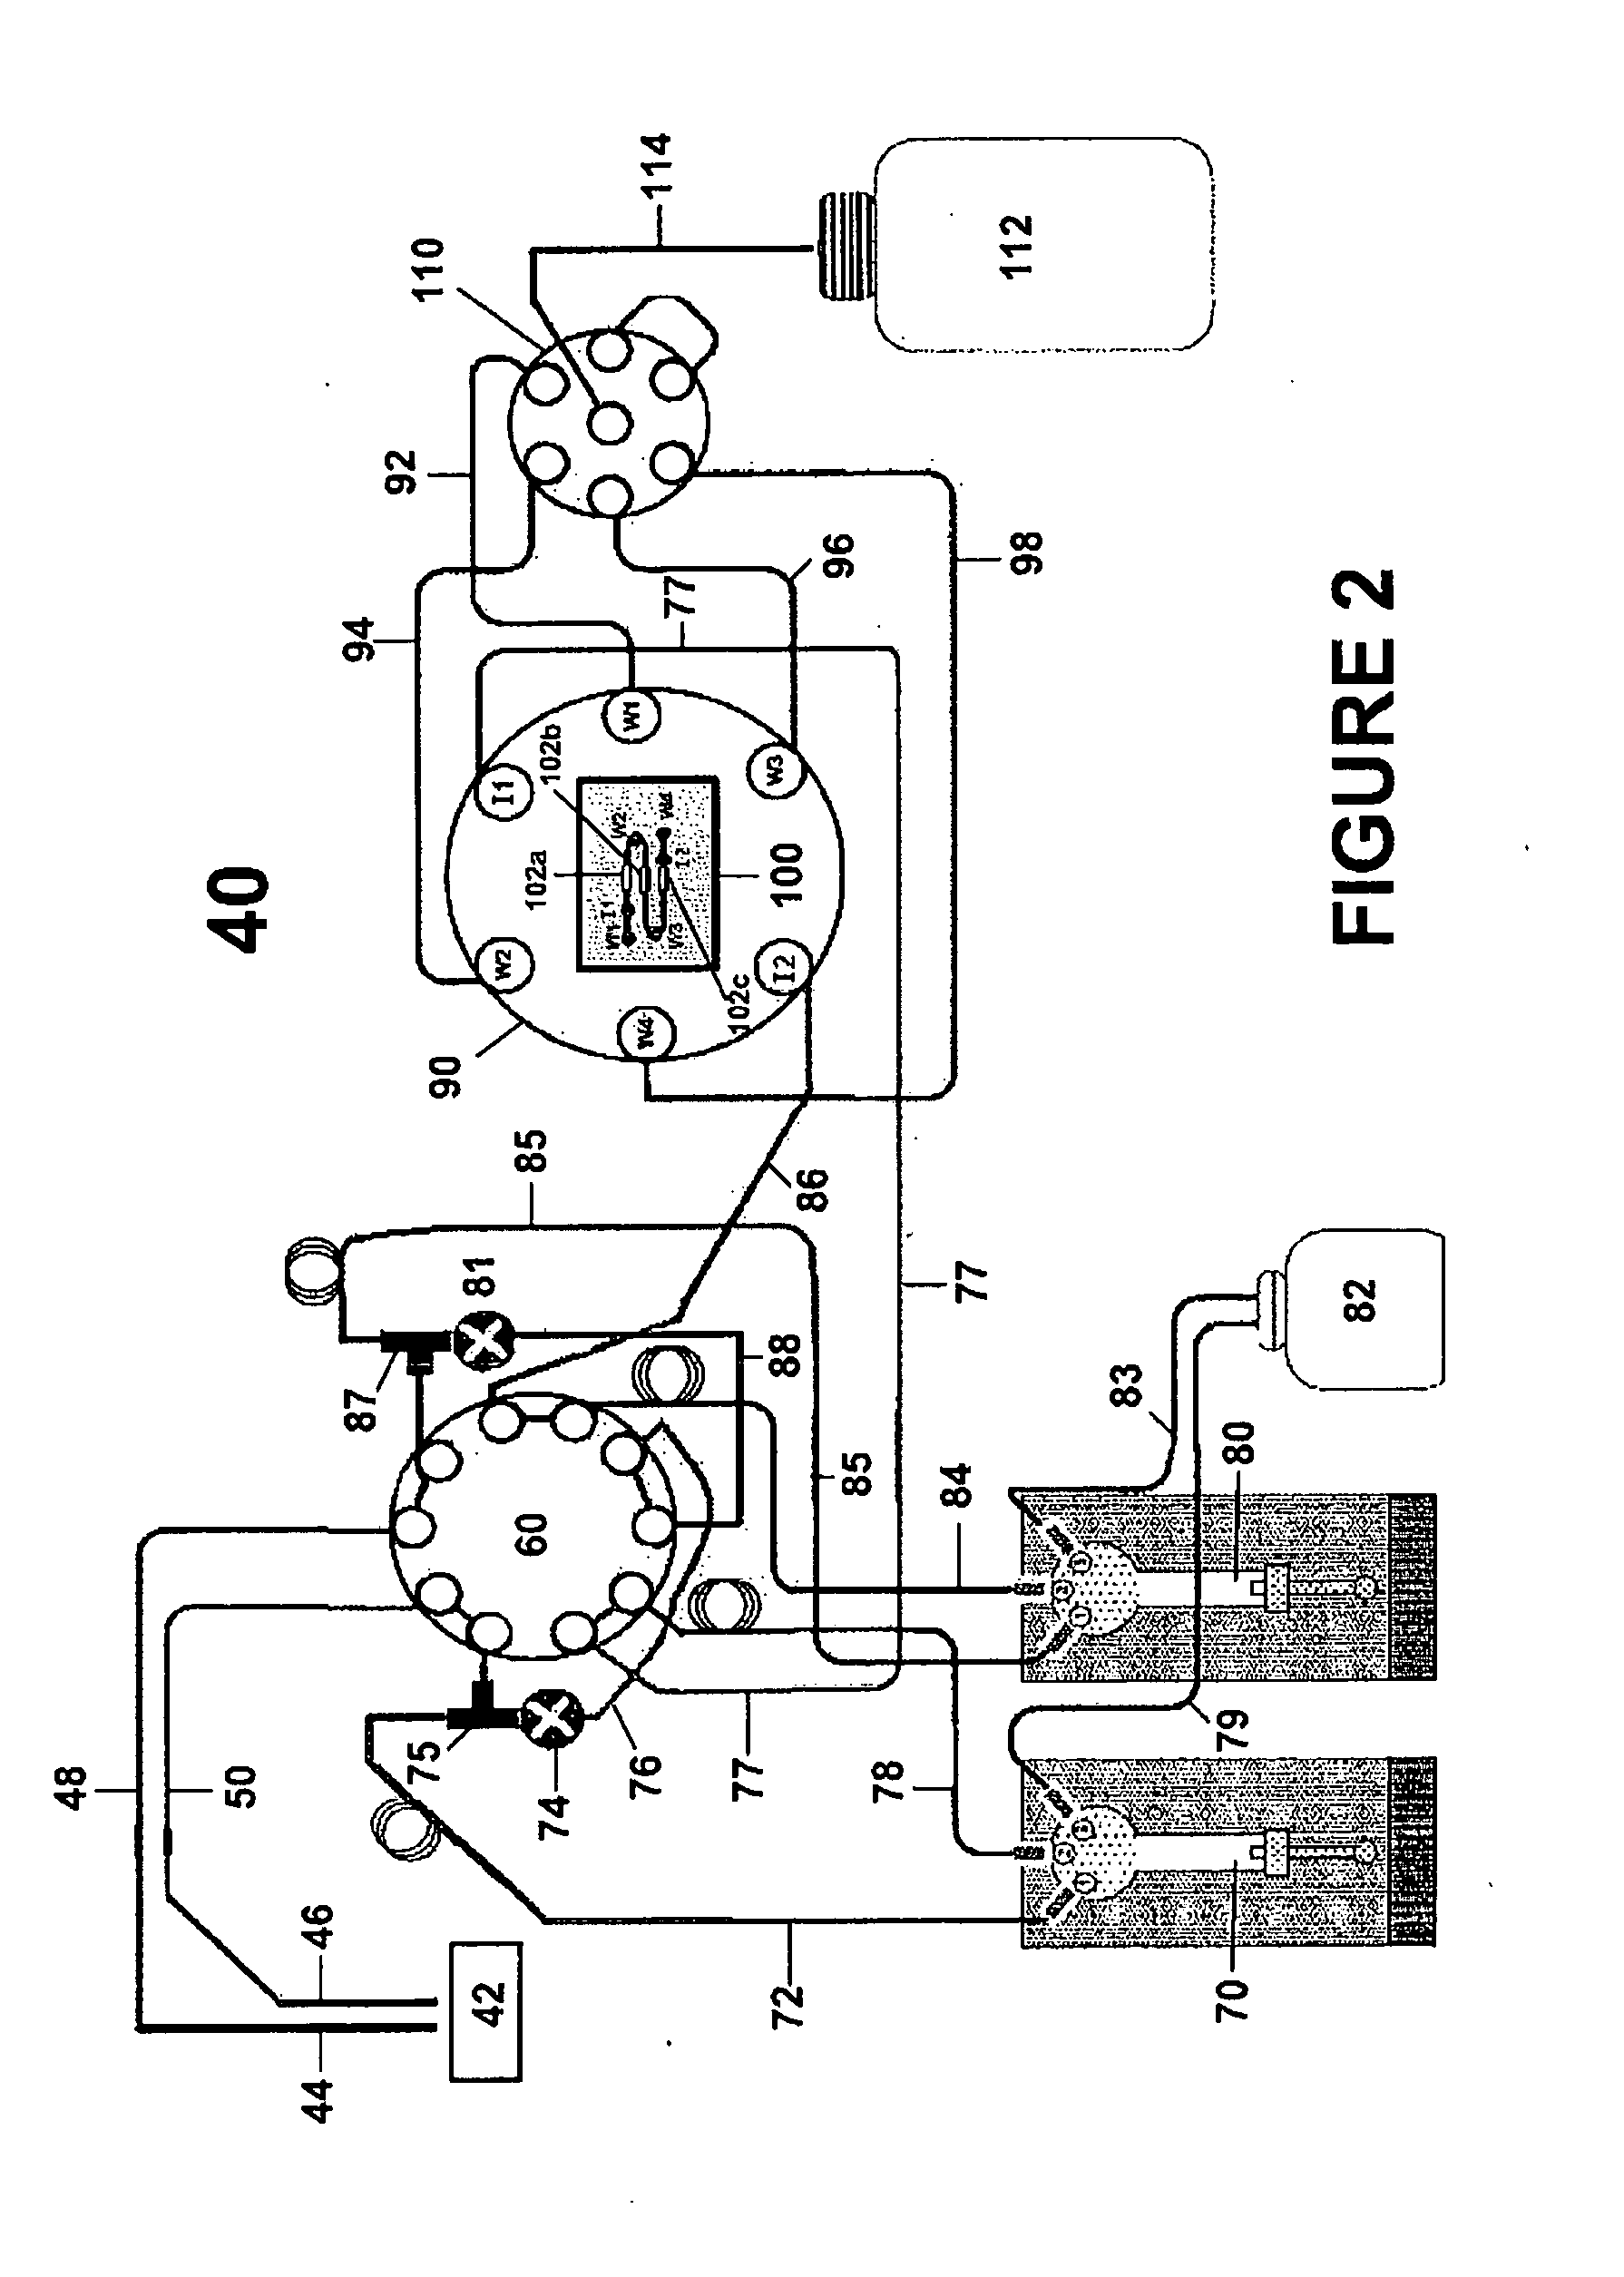
The present invention relates to a method for testing multiple analyte concentrations within a biosensor system through a single injection of sample. The method involves flowing a fluid sample containing a neat analyte concentration along a flow path in a fluid system and diluting the sample by causing it to merge with a fluid that is free of analyte in a second flow path under laminar flow conditions. The merged fluid stream is directed through a turbulent third flow path of a very low dead volume. The third flow path carries the merged fluid stream to a sensing region where the analyte is exposed to an immobilized ligand. The concentration of analyte can be controlled in this method by adjusting the flow rates of the sample flow and analyte-free fluid flow. A fluidic system for carrying out this method is also disclosed.

Description

BACKGROUND OF INVENTION[0001]Surface plasmon resonance (SPR) based biosensors are commonly used to perform kinetic studies of complex molecular interactions such as between hormone-receptor, enzyme-substrate and antigen-antibody. The biosensors are typically in the form of one or more sensing surfaces housed within a sensing region of a microfluidic system. The microfluidic system further defines a series of flow paths that direct fluid flow to the sensing region. The one or more sensing surfaces of the sensing region support immobilized molecules referred to as “ligands.” The ligands bind molecules known as “analytes” which are present in fluids that are directed to the sensing region via the microfluidic system. Current analysis methods determine the kinetic interaction of the ligand and analyte by separately injecting a series of analyte concentrations into the system and measuring the change in refractive index at the sensing region. Based on the changes in refractive index, one...

Claims


Application Information

Patent Timeline
Patent Type & Authority Applications(United States)
IPC IPC(8): G01N21/55
CPCB01F5/0647B01F13/0059G01N21/55B01L3/502738B01L3/50273B01F25/4331B01F33/30G01N33/557
Inventor QUINN, JOHN GERARD
Owner FLIR SYST INC
Learn More